
CONTENTS
16.2.1 GNP Synthesis and Characterization
16.2.2 Production and Characterization of Nanocomposites
16.4 Nanocomposite Electromechanical Modeling
Since it was first obtained as a single sheet in 2004 by Geim et al. [1], graphene has attracted tremendous interest in the scientific community thanks to its outstanding mechanical [2, 3 and 4], thermal [5], and especially electrical and transport properties [6]. The interest for graphene has been particularly pushed by the difficulties in exploiting and controlling the properties of carbon nanotubes (CNTs) throughout the last decade, as well as the high cost of the latter structures. Along with the interest in carbon-based nanostructures, composites filled with CNTs [7, 8, 9 and 10], graphite nanoplatelets (GNPs) [11, 12, 13, 14, 15, 16 and 17], or combined systems [18, 19, 20 and 21] have also recently drawn much attention from the scientific community, thanks to the very low loadings required to reach considerable improvement in functional properties, traditionally only achievable with high concentrations of conventional fillers. These new composites are continuously finding applications in various fields such as electromagnetic shielding, aeronautics, photovoltaics, actuators, and sensors. For instance, several studies have focused on the piezoresistive behavior of polymers reinforced with single- or multiwalled CNTs [22,23], expanded graphite, and GNPs [24, 25 and 26].
An important upcoming application of CNT-based composites is their use in high-density electronics to replace common commercial grease in thermal interface materials (TIMs) [27, 28 and 29]. TIMs, when applied between heat sources and heat sinks, are essential ingredients in thermal management, especially in the future generations of integrated circuits or ultrafast high-power density communication systems. Nevertheless, the outcomes of experiments involving CNT-based TIMs were controversial, thus providing strong motivation for further research on alternative fillers, such as GNPs [30, 31, 32 and 33].
Hung et al. [30] studied heat transport in polymer nanocomposites reinforced with GNPs using high-precision thermal conductivity measurements. They found that the resistance to heat conduction across interfaces between GNPs and the polymeric matrix has a strong effect on heat transport in nanocomposites.
Yu et al. [31] reported an efficient process for converting natural graphite into few-layer GNPs. When embedded in a polymeric matrix, GNPs cause a remarkable enhancement of the thermal conductivity of the nanocomposite at low-volume loadings and significantly outperform the CNT-based fillers.
In a more recent publication, the same group [32] showed that by combining single-walled CNTs and GNPs, it is possible to achieve a synergistic effect in the thermal conductivity enhancement of epoxy-based composites.
Finally, in a very recent publication [33], Shahil et al. developed a synthesis process of TIMs made of a graphene–multilayer graphene nanocomposite polymer and demonstrated extremely high thermal coefficient enhancement at low filler loadings.
Owing to their multifunctional properties, GNP-based composites could replace common TIMs in electronic devices, combining thermal management utilities with integrated stress–strain monitoring capabilities of the packaging. In other words, it could be possible to realize smart TIMs able to detect local stress–strain states due to the delamination phenomena, for example. For this purpose, the availability of simulation models capable of predicting the effective electrical conductivity of the composite, as a function of the type, volume fraction, and mechanical stress state, is of paramount importance for design purposes.
In this chapter, we present a full model for the evaluation of the electromechanical response of a GNP-based nanocomposite for possible application as a smart TIM in electronic/nanoelectronics. Section 16.2 describes the synthesis and fabrication processes of GNPs and GNP-based nanocomposites developed in the CNIS Lab of Sapienza University. A complete experimental characterization of the dc conducting properties of both GNPs and nanocomposites with increasing filler concentration is also performed. Next, the electromechanical model of the nanocomposite material is presented in Section 16.3. This model is based on the assumption that GNPs are not deformable particles randomly distributed inside the polymeric matrix. The tunneling-based conducting model proposed in Refs. [34, 35, 36 and 37] is applied to define the relation between the dc effective electrical conductivity of the nanocomposite and the average probabilistic distance among the nanoparticles in the matrix. The model is calibrated using the electrical conductivity values of the filler and of the composites measured in Section 16.2. Finally, in Section 16.4, the developed model is applied to predict the response of a GNP-based TIM. The results of the numerical simulations demonstrate the validity of the proposed approach and can provide an indications on the optimum design of GNPfilled nanocomposites with enhanced electromechanical response.
16.2.1 GNP SYNTHESIS AND CHARACTERIZATION
GNPs were synthesized through thermal expansion in the CNIS labs starting from a commercially available graphite intercalation compound (GIC), namely Grafguard 160–50N (intercalated expandable graphite flakes) as described in Refs. [17,21]. After thermal treatment at 1150°C, leading to thermally expanded graphite oxide (TEGO, with the typical worm-like structure of Figure 16.1a), the expanded graphite was tip sonicated in acetone, thus obtaining GNPs having thicknesses in the range 3–15 nm and lateral dimensions around 1–10 μm, as shown in Figure 16.1b.
A critical issue concerns the characterization of the GNP electrical conductivity, which strongly depends on the set of parameters used during the thermal expansion of GICs. Thick films made of GNPs were then fabricated by vacuum filtration (using nanopore-sized AAO membranes as filters) to estimate the effective dc conductivity of the GNPs as described in Refs. [16,38].
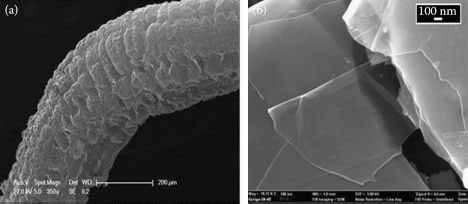
FIGURE 16.1 Micrographs of TEGO (a) and of ultrasonication (b). SEM analyses were performed at DICMA (a) and at SNN-Lab by Zeiss Auriga (b).
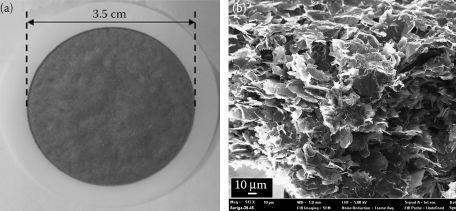
FIGURE 16.2 GNP film fabricated for dc electrical conductivity measurement (a) and a corresponding SEM image of a fracture section (b). (A.G. D’Aloia et al. Electromechanical modeling of GNP nanocomposites for stress sensor applications, IEEE NANO 2011, Portland, Oregon, USA, pp. 1648–1651, © (2011) IEEE. With permission.)
The typical route used to produce the thick film is as follows: 40 mg TEGO was dispersed in 125 mL acetone through an ultrasonic probe operating in pulse mode for 40 min. The resulting GNP suspension was then subjected to vacuum filtration to obtain a compact film with thickness around 200 μm. Figure 16.2a and b shows, respectively, a photograph of the film obtained after vacuum filtration and a SEM micrograph highlighting the layered structure.
The sheet electrical resistance Rs of the GNP film was obtained through the four-point probe method [39] at room temperature, using a Signatone S301 stand, collinear tungsten carbide tips, and a Keithley 6221 dc/ac current source connected to a Keithley 2182A nano-voltmeter.
Then the dc electrical conductivity value of 10.5 kS/m was calculated from the measured Rs considering the average thickness of the GNP film.
16.2.2 PRODUCTION AND CHARACTERIZATION OF NANOCOMPOSITES
Nanocomposites were prepared using a commercially available epoxy-based vinyl ester matrix, kindly provided by Reichhold (DION 9102). According to the preparation method described in Ref. [17], the filler was dispersed in acetone. The so-obtained suspension was mixed with the polymeric matrix and then poured into rectangular-shaped molds. Finally, the composite was cured in air for 24 h and postcured for a further 24 h at 70°C. Nanocomposites loaded with GNPs at four different weight fractions (0.25%, 0.5%, 1%, and 2%) were prepared accordingly.
Extensive SEM analyses were performed to assess the uniformity of filler dispersion. As an example, Figure 16.3a and b shows the HR-SEM images of the fracture surfaces of 0.5% wt. and 2% wt. GNP composites [17].
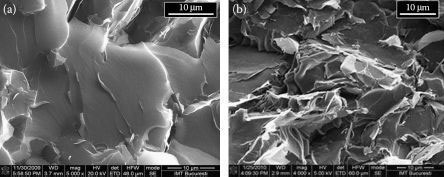
FIGURE 16.3 SEM micrographs showing the fracture surface of 0.5% wt. GNP (a) and 2% wt. GNP (b) nanocomposites. SEM analyses were performed at IMT Bucharest.
The dc electrical conductivity of nanocomposites with different concentrations of GNPs was measured applying the four-wire volt-amperometric method. The test samples have been prepared as follows. At first, the two opposite faces of each parallelepiped-shaped specimen have been coated with silver paint and dried at 60°C for 10 min. Afterward, tin-coated copper wires have been bonded to the aforementioned faces through a conductive silver-loaded epoxy adhesive. This step was followed by a curing phase at 120°C for 10 min.
The electrical measurements were performed in delta mode using a Keithley 6221 dc/ac current source connected to a Keithley 2182A nano-voltmeter, controlled by a PC for data acquisition and analysis. The dc electrical conductivity γ was evaluated from the measured resistance values. The results obtained for the different GNP-based nanocomposites are shown in Figure 16.4.
Finally, the fabricated GNP nanocomposites were subjected to tensile testing according to Ref. [40]. Three dog-bone-shaped flat composite specimens were tested for each weight percentage.
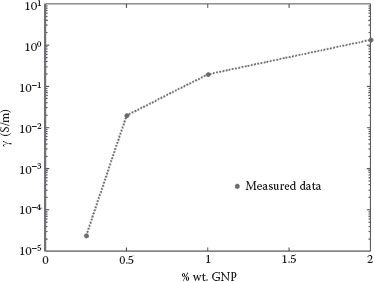
FIGURE 16.4 Measured dc effective conductivity of nanocomposites filled with different weight fractions of GNPs. (A.G. D’Aloia et al. Electromechanical modeling of GNP nanocomposites for stress sensor applications, IEEE NANO 2011, Portland, Oregon, USA, pp. 1648–1651, © (2011) IEEE. With permission.)
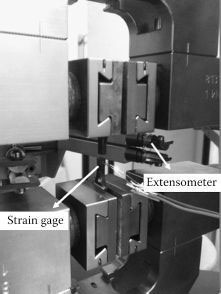
FIGURE 16.5 Experimental setup for tensile tests of nanocomposites.
A Zwick/Roell Z010 universal testing machine equipped with a 10 kN load cell was used to perform the mechanical tests. The tensile tests were performed at a cross-head speed of 0.5 mm/min. The specimens were gripped between flat mechanical wedge grips. The longitudinal strain was measured using an extensometer with a 10 mm gage length. Transverse strain was measured by a strain gage, as shown in Figure 16.5. This allowed us to measure the elastic constants of the composites, namely, Young’s modulus E and Poisson’s ratio υ, together with maximum strength and elongation at failure. Before mechanical property measurements, the specimen surfaces were mechanically polished to minimize the influence of the surface flaws. Figure 16.6 shows a specimen before and after the test.
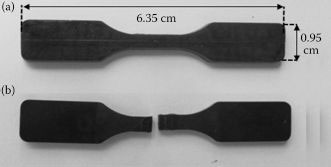
FIGURE 16.6 Dog-bone specimens before (a) and after (b) the tensile test.
The tensile properties of nanocomposites filled at 1% wt. and 2% wt. are summarized in Table 16.1, while Figure 16.7 shows the measured tensile stress σ versus strain ε.
TABLE 16.1
Nanocomposite Tensile Properties Obtained from Experimental Tests
GNP (% wt.) |
Young’s Modulus (GPa) |
Maximum Strength (MPa) |
Strain at Failure (%) |
Poisson’s Ratio |
1 |
3.19 ± 0.01 |
63.79 ± 2.50 |
2.62 ± 0.08 |
0.34 ± 0.01 |
2 |
3.16 ± 0.03 |
40.88 ± 2.81 |
1.76 ± 0.16 |
0.33 ± 0.02 |
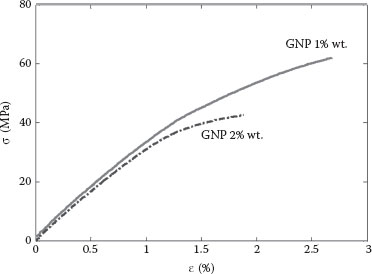
FIGURE 16.7 Measured tensile stress–strain characteristic of GNP-based nanocomposites at 1% wt. and 2% wt.
The stress sensor sketched in Figure 16.8a consists of a brick-shaped specimen of a GNP-based nanocomposite, having thickness t, and lateral dimensions Lx and Ly, with Lx ≥ Ly ≫ t, and it is supplied by an ideal current source Is, which is injected into the Ly-long side-face of the specimen uniformly, and extracted from the corresponding opposite side.
The current Is is assumed to flow in the (x, y)-plane of the sensor and to be uniformly distributed across the specimen thickness. Therefore, the distributions of the electric potential V(x, y) and of the current density components Jx(x, y) and Jy(x, y) over the sensor surface are obtained from the solution of the following 2D differential equations:
(16.1) |
(16.2) |
where γx and γy are the effective dc conductivities of the GNP-based composite realizing the sensor along the x- and y-axes, respectively. Without mechanical stress the application results in γx = γy = γ because GNPs are assumed to be distributed uniformly and randomly into the matrix. Otherwise, if there is an applied stress producing the deformations εx and εy along the x- and y-axes, it results in γx ≠ γy. The variations of γx and γy due to the deformations of the sensor are predicted applying the model reported in the next section. The deformations εx and εy corresponding to the applied stress are computed in Section 16.4 as well. Equations 16.1 and 16.2 are solved numerically by applying a leap-frog finite different scheme. For this purpose, it is set at x = iΔx and y = jΔy, with i ∈ [0,n], j ∈ [0,m], and Δx ≪ Lx, Δy ≪ Ly. Therefore, the brick-shaped specimen is discretized in (n × m) cells, each having a thickness t and lateral dimensions Δx and Δy, as shown in Figure 16.8b.
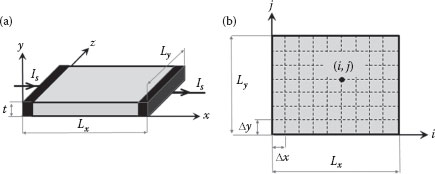
FIGURE 16.8 Stress sensor supplied by current Is (a) and a 2D-equivalent discrete model (b).
Equations 16.1 and 16.2 are expressed in the following discrete form:
(16.3) |
(16.4) |
where V(i,j),V(i+1,j), V(i,j+1), Jx (i+1/2,j), and Jy(i,j+1/2) are the discretized electric potential and the current density components in the (i,j), (i + 1,j), (i,j + 1), (i + 1/2,j), and (i,j + 1/2) nodes, respectively, as sketched in Figure 16.9a.
Referring to the sample cell of Figure 16.9b, the currents flowing in the x- and y-directions, Ix and Iy, are defined by the following zero-order approximated expression:
(16.5) |
(16.6) |
which are obtained in the hypothesis that the density current components assume the constant value Jx(i+1/2, j) and Jy(i,j+1/2) over the cell lateral surface Σx = Δxt and Σy = Δyt, respectively.
The voltage drop between the (i, j) and (i + 1, j) nodes can be expressed as a function of the current Ix(i+1/2, j) flowing through the effective conductance Gx of the cell along the x-direction:
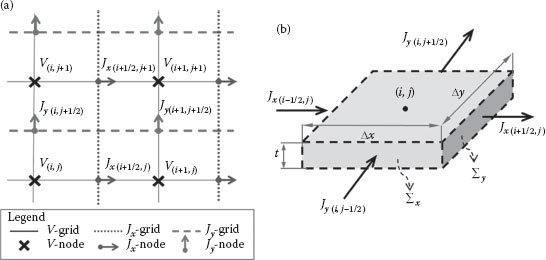
FIGURE 16.9 Discretized electric potential and current density components appearing in Equations 16.3 and 16.4 (a) and elementary cell centered in the (i,j)-node (b).
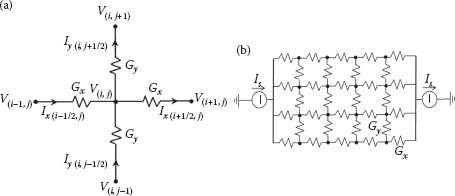
FIGURE 16.10 Circuit model of a single cell (a) and an equivalent network model of the stress sensor with current injection and extraction (b).
(16.7) |
A similar expression defines the voltage drop between the (i,j) and (i,j + 1) nodes:
(16.8) |
with Gy being the effective conductance of the cell along the y-direction.
The expressions of Gx and Gy are obtained comparing Equations 16.5, 16.7 with Equation 16.3, and Equations 16.6, 16.8 with Equation 16.4. It results in
(16.9) |
(16.10) |
The equivalent circuit representation of Equations 16.7 and 16.8 at the (i,j) node is shown in Figure 16.10a and the equivalent network model of the stress sensor is reported in Figure 16.10b, where the current injection and extraction are represented by the ideal generator Is.
16.4 NANOCOMPOSITE ELECTROMECHANICAL MODELING
The electrical transport in GNP-based nanocomposites is described applying the tunneling percolation model proposed in [34, 35, 36 and 37]. In the hypothesis that GNPs are distributed randomly and uniformly within the matrix, the effective electrical conductivity of the composite can be described by the following expression:
(16.11) |
where θ is the GNP weight concentration in the composite, δ(θ) is the average distance among the GNPs dispersed in the matrix at the weight concentration θ, ξ = 9.22 nm is the characteristic tunneling length [35], and γ0 is the limit value of the electrical conductivity in the hypothesis that δ approaches to zero.
It is assumed that γ0 is equal to the measured conductivity of the GNP film shown in Figure 16.4. The average distance δ(θ) among the GNPs in a nanocomposite with filler concentration θ is then evaluated solving Equation 16.11 for δ(θ), considering the corresponding measured value of the dc electrical conductivity γ(θ) reported in Figure 16.4. The results are shown in Figure 16.11.
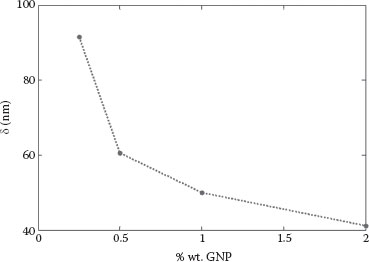
FIGURE 16.11 Average distance among the GNPs in the matrix as a function of the weight ratio. (A.G. D’Aloia et al. Electromechanical modeling of GNP nanocomposites for stress sensor applications, IEEE NANO 2011, Portland, Oregon, USA, pp. 1648–1651, © (2011) IEEE. With permissi.)
The deformations of the sensor along the x- and y-axes, εx and εy, are computed in the hypothesis that the stress is applied in the (x, y)-plane with components σx, σy, and that shear stress is not present. In the elastic range, it results in
(16.12) |
where E is the measured Young’s modulus of the nanocomposite and ν is the corresponding Poisson coefficient.
As a consequence, owing to the applied stress condition, the dimensions Lx and Ly of the strain sensor become Lx′ and Ly′:
(16.13) |
(16.14) |
This implies that, in the hypothesis that the GNPs are nondeformable particles, the average distances among the geometrical centers of the GNPs dispersed in the matrix along the x- and y-axes, that is, δx and δy, respectively, become δx′ and δy′:
(16.15) |
(16.16) |
Therefore, the effective electrical conductivity of the nanocomposite assumes different values γx and γy along the x- and y-axes, respectively, as it appears in Equations 16.9 and 16.10. These conductivities are obtained for a given GNP concentration θ replacing in Equation 16.11 γ with γx or γy, and δ with δx′ or δy′.
Moreover, combining the resulting expressions with Equations 16.15, 16.16, and 16.12, the result is that γx, γy can be formulated explicitly as functions of the applied stress components σx and σy:
(16.17) |
(16.18) |
It is noted that the previous expressions are valid in the hypothesis of linearity, that is, that E, and ν are not varying as a function of the applied stress. The electromechanical response of the strain sensor is finally obtained combining Equations 16.17, 16.18 with Equations 16.7 through 16.10, and solving the equivalent network of Figure 16.10b.
The proposed model is applied to the analysis of a stress sensor made of GNP nanocomposites at 1% or 2% wt. The thickness t is 0.5 mm and the lateral dimensions are Lx = 14.7 mm and Ly = 8.2 mm, which are typical of the TIM in an Intel® Dual Core/GT2 Ivy Bridge Die.
The curves reported in Figure 16.12a and b show, respectively, the relative deformations and the lateral dimensions of the strain sensor made of GNP nanocomposites at 1% wt. as a function of σx, in case of σy = 0. It is observed that the relative deformation εx increases with σx, whereas εy decreases. Moreover, the dimension of the sensor along the x-axis increases nearly 3 mm when σx varies from 0 up to 30 MPa (Figure 16.12b), whereas the length of the y-side decreases less than 2 mm.
The average distances among the particles is then estimated using Equations 16.15 and 16.16 for the two concentrations of 1% wt. and 2% wt. It is observed that as a stress σx is applied, δx′ increases exponentially, while δy′ decreases, as shown in Figure 16.13a and c. On the other hand, the electrical conductivity along the x-axis γx decreases, whereas γy increases, as shown in Figure 16.13b and d.
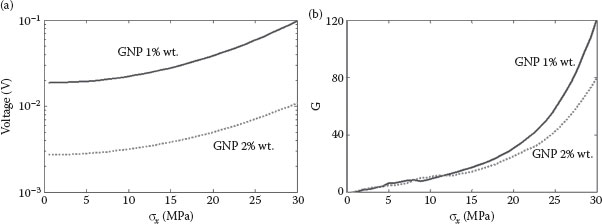
FIGURE 16.14 Voltage across a sensor made of GNP nanocomposites at 1% wt. or 2% wt. (a) of GNPs, and corresponding gage factor G (b) as a function of the applied stress σx.
(16.19) |
where ΔR and ΔL are the changes in electrical resistance and in the length, respectively, due to the applied stress; R0 and L0 are the initial electrical resistance and length of the stress sensor.
It is noted that the voltage is strongly dependent on the applied stress for both GNP concentrations. This means that the GNP-based nanocomposites developed in this study can be very sensitive even to small variations of the applied stress, and are also suitable to be used as a vibration sensor.
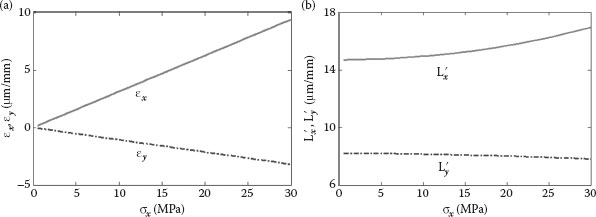
FIGURE 16.12 Relative deformations εx, εy, (a), and dimensions L′x and L′y (b) as a function of the stress σx, for a stress sensor made of GNP-nanocomposites at 1% wt.
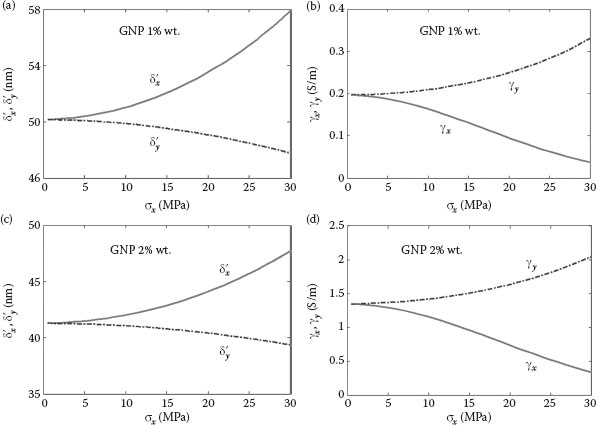
FIGURE 16.13 Average distance δx′ or δy′ among the GNPs in nanocomposites with different concentrations (a), (c), and corresponding electrical conductivities γx and γy (b), (d) as functions of the stress σx.
Figure 16.14a shows the voltage across the sensor supplied by the current Is = 1 μA. The corresponding gage factor, shown in Figure 16.14b, is given by
In this study, we propose a full electromechanical model of a TIM made of a GNP nanocomposite for integrated stress monitoring of electronic devices. The proposed simulation approach is based on the tunneling percolation model of the dc electrical conductivity of the nanocomposite. Moreover, it is assumed that GNPs are not deformable particles, so that the average distance among them in the composites can be directly correlated to the applied stress condition.
To calibrate the developed model for quantitative analysis, thick GNP films have been produced to measure the dc effective conductivity of the GNPs. Moreover, nanocomposite samples filled with different concentrations of GNPs have been fabricated to estimate the dc conductivity, Young’s module, and Poisson coefficient of the composite as functions of the filler concentration.
The obtained results demonstrate that strain sensors containing GNP at 1% wt. or 2% wt. are characterized by an electromechanical characteristic that is very sensitive to small variations of the applied stress. Quantitative experimental validations of the complete electromechanical model of the sensor are the objectives of a future study. Moreover, the combined optimization of the thermal and electromechanical performances of a smart TIM made of a GNP composite in a real device configuration will be carried out.
1. K.S. Novoselov, A.K. Geim, S.V. Morozov, D. Jiang, Y. Zhang, S.V. Dubonos, I.V. Grigorieva, A.A. Firsov, Electric field effect in atomically thin carbon films, Science, 306(5696), 666–669, 2004.
2. H.C. Schniepp, K.N. Kudin, J.L. Li, R.K. Prud’homme, R. Car, D.A. Saville, I.A. Aksay, Bending properties of single functionalized graphene sheets probed by atomic force microscopy, ACS Nano, 2(12), 2577–2584, 2008.
3. C. Lee, X. Wei, J.W. Kysar, J. Hone, Measurement of the elastic properties and intrinsic strength of monolayer graphene, Science, 321(5887), 385–388, 2008.
4. I.W. Frank, D.M. Tanenbaum, A.M. van der Zande, P.L. McEuen, Mechanical properties of suspended graphene sheets, J. Vac. Sci. Technol. B, 25(6), 2558–2561, 2007.
5. A.A. Balandin, S. Ghosh, W. Bao, I. Calizo, D. Teweldebrhan, F. Miao, Superior thermal conductivity of single-layer graphene, Nano Lett., 8(3), 902–907, 2008.
6. X. Du, I. Skachko, A. Barker, E.Y. Andrei, Approaching ballistic transport in suspended graphene, Nat. Nanotechnol., 3(491), 1–5, 2008.
7. Z. Liu, G. Bai, Y. Huang, Y. Ma, F. Du, F. Li, Reflection and absorption contributions to the electromagnetic interference shielding of single-walled carbon nanotube/polyurethane composites, Carbon, 45, 821–827, 2007.
8. S.H. Park, P. Thielemann, P. Asbeck, P.R. Bandaru, Enhanced dielectric constants and shielding effectiveness of, uniformly dispersed, functionalized carbon nanotube composites, Appl. Phys. Lett., 94(24), 243111-1-3 2009.
9. L.L. Wang, B.K. Tay, K.Y. See, Z. Sun, L.K. Tan, D. Lua, Electromagnetic interference shielding effectiveness of carbon-based materials prepared by screen printing, Carbon, 7(8), 1905–1910, 2009.
10. M.H. Al-Saleh, U. Sundararaj, Electromagnetic interference shielding mechanisms of CNT/polymer composites, Carbon, 47(7), 1738–1746, 2009.
11. J. Liang, Y. Wang, Y. Huang, M. Yanfeng, Z. Liu, J. Cai et al. Electromagnetic interference shielding of graphene/epoxy composites, Carbon, 47(3), 922–925, 2009.
12. Z. Mo, Y. Sun, H. Chen, P. Zhang, D. Zuo, Y. Liu et al. Preparation and characterization of a PMMA/Ce(OH)3, Pr2O3/graphite nanosheet composite, Polymer, 46(26), 12670–12676, 2005.
13. G. Chen, W. Wenig, D. Wu, C. Wu, PMMA/graphite nanosheets composite and its conducting properties Eur. Polym. J., 39(12), 2329–2335, 2003.
14. L.N. Song, M. Xiao, Y. Z. Meng, Electrically conductive nanocomposites of aromatic polydisulfide/expanded graphite, Comp. Sci. Tech., 66(13), 2156–2162, 2006.
15. B.F. He, S. Lau, H.L. Chan, J. Fan, High dielectric permittivity and low percolation threshold in nanocomposites based on poly(vinylidene fluoride) and exfoliated graphite nanoplates, Adv. Mater., 21(6), 710–715, 2009.
16. M.S. Sarto, A.G. D’Aloia, A. Tamburrano, G. De Bellis, Synthesis, modeling, and experimental characterization of graphite nanoplatelet-based composites for EMC applications, IEEE Trans. EMC, 54(1), 17–27, 2012.
17. G. De Bellis, A. Tamburrano, A. Dinescu, M.L. Santarelli, M.S. Sarto, Electromagnetic properties of composites containing graphite nanoplatelets at radio frequency, Carbon, 49(13), 4291–4300, 2011.
18. G. De Bellis, I.M. De Rosa, A. Dinescu, M.S. Sarto, A. Tamburrano, Electromagnetic properties of carbon-based nanocomposites: The effect of filler and resin characteristics, Int. Symp. IEEE NANO 2010, Seoul, Korea, 486–489, 2010.
19. I.M. De Rosa, F. Sarasini, M.S. Sarto, A. Tamburrano, EMC impact of advanced carbon fiber/carbon nanotube reinforced composites for next-generation aerospace applications, IEEE Trans. EMC, 50(3), 556–563, 2008.
20. I.M. De Rosa, A. Dinescu, F. Sarasini, M.S. Sarto, A. Tamburrano, Effect of short carbon fibers and CNTs on microwave absorbing properties of polyester composites containing nickel-coated carbon fibers, Composites Sci. Technol., 70(1), 102–109, 2010.
21. G. De Bellis, I.M. De Rosa, A. Dinescu, M.S. Sarto, A. Tamburrano, Electromagnetic absorbing nanocomposites including carbon fibers, nanotubes and graphene nanoplatelets, IEEE Int. Symp. EMC, Fort Lauderdale, USA, 202–207, 2010.
22. I. Kang, M.J. Schulz, J.H. Kim, V. Shanov, D. Shi. A carbon nanotube strain sensor for structural health monitoring, Composites Sci. Technol., 15(6), 737–748, 2006.
23. Z.M. Dang, M.J. Jiang, D. Xie, S.H. Yao, L.Q. Zhang, Supersensitive linear piezoresistive property in carbon nanotubes/silicon rubber nanocomposites, J. Appl. Phys., 104(2), 024114-1-6, 2008.
24. Y. -J. Kim, J.Y. Cha, H. Ham, H. Huh, D.-S. So, I. Kang, Preparation of piezoresistive nano smart hybrid material based on graphene, Curr. Appl. Phys., 11(1), S350–S352, 2011.
25. F.R. Al-solamy, A.A. Al-Ghamdi, W.E. Mahmoud, Piezoresistive behavior of graphite nanoplatelets based rubber nanocomposites, Polym. Adv. Technol., 23(3), 478–482, 2011.
26. A.G. D’Aloia, A. Tamburrano, G. De Bellis, M.S. Sarto, Electromechanical modeling of GNP nanocomposites for stress sensor applications, IEEE NANO 2011, Portland, Oregon, USA, pp. 1648–1651, 2011.
27. H. Huang, C. Liu, Y. Wu, Aligned carbon nanotube composite films for thermal management, Adv. Mater., 17(13), 1652–1656, 2002.
28. A.M. Marconnet, N. Yamamoto, M. Panzer, B. Wardle, K.E. Goodson, Thermal conduction in aligned carbon nanotube-polymer nanocomposites with high packing density, ACSNANO, 5(6), 4818–4825, 2011.
29. W. Lin, K.S. Moon, C.P. Wong, A combined process of in situ functionalization and microwave treatment to achieve ultrasmall thermal expansion of aligned carbon nanotube-polymer nanocomposites: Toward applications as thermal interface materials, Adv. Mater., 21(3), 2421–2424, 2009.
30. M.T. Hung, O. Choi, Y. S. Ju, T. Hahn, Heat conduction in graphite-nanoplatelet-reinforced polymer nanocomposites, Appl. Phys. Lett., 89(2), 023117-1-6, 2006.
31. A. Yu, P. Ramesh, X. Su, E. Bekyarova, M.E. Itkis, R.C. Haddon, Graphite nanoplatelet-epoxy composites thermal interface materials, J. Phys. Chem. C, 111(21), 7565–7569, 2007.
32. A. Yu, P. Ramesh, X. Su, E. Bekyarova, M.E. Itkis, R.C. Haddon, Enhanced thermal conductivity in hybrid graphite nanoplatelet-carbon nanotube filler for epoxy composites, Adv. Mater., 20(24), 4740–4744, 2008.
33. K.M.F. Shahil, A.A. Baladin, Graphene-multilayer graphene nanocomposites as highly efficient thermal interface materials, Nano Lett., 12(2), 861–867, 2012.
34. J. Hicks, A. Behnam, A. Ural, A computational study of tunneling-percolation electrical transport in graphene-based nanocomposites, Appl. Phys. Lett., 95(21), 213103-1-3, 2009.
35. G. Ambrosetti, C. Grimaldi, I. Balberg, T. Maeder, A. Danani, P. Ryse, Solution of the tunneling-percolation problem in the nanocomposite regime, Phys. Rev. B, 81(15), 155434-1-12, 2010.
36. J.R. Macdonald, On the mean separation of particles of finite size in one to three dimensions, Mol. Phys., 44(5), 1043–1049, 1981.
37. G. Ambrosetti, N. Johner, C. Grimaldi, A. Danani, P. Ryse, Percolative properties of hard oblate ellipsoids of revolution with a soft shell, Phys. Rev. E, 78(6), 061126-1-11, 2008.
38. G. De Bellis, F. Ruggeri, A. Broggi, A. Tamburrano, M.L. Santarelli, M.S. Sarto, Effect of the synthesis parameters on the dc resistance of graphite nanoplatelets thick films, GraphITA, L’Aquila, Italy, 2011.
39. ASTM F390-98, Standard test method for sheet resistance of thin metallic films with collinear four-probe array.
40. ASTM D638-10, Standard test method for tensile properties of plastics.