
When we want a thread-centric view of our application, the Threads window is the place to start. We can use the Threads window to see the location of all of our threads, see the thread call stack, and more. We can use the Call Stack window to view the stack frames of our application, or the function, or procedure calls that are currently on the stack.
In this recipe, we are going to see how to use the Threads and Call Stack windows in Visual Studio 2012 to view the call stack information for the threads in our application.
Before we start looking at the debugging features of Visual Studio 2012, we need an application to debug. Let's create a Console application that spins up a few tasks so we can take a look at their call stack information.
- Start a new project using the C# Console Application project template and assign
LockExampleas the Solution name. - Add the following
usingdirectives to the top of yourProgramclass.using System; using System.Diagnostics; using System.Threading; using System.Threading.Tasks;
- Let's start by creating a few
staticmethods on theProgramclass. Add a method namedMethod1that loops three times, creating tasks. The tasks just need to callMethod2with anintegerparameter.static void Method1() { Console.WriteLine("In Method1."); for (int i = 0; i < 3; i++) { Task.Factory.StartNew(index => Method2((int)index), i); } } - Now create a method named
Method2.Method2just adds a random number to the parameter, writes the parameter toConsole, and callsMethod4.static void Method2(int number) { Random rnd = new Random(); var sum = number + rnd.Next(1,10); Console.WriteLine("In Method2. Value:{0}", sum); Method4(sum); } - Next create
Method3, which just starts a third task that callsMethod2.static void Method3() { Console.WriteLine("In Method3."); for (int i = 0; i < 3; i++) { Task.Factory.StartNew(() => { Task.Factory.StartNew(index => Method2((int)index), i); }); Thread.Sleep(10); } } - Lastly, create
Method4which contains our breakpoint.static void Method4(int number) { Console.WriteLine("In Method4.", number); Debugger.Break(); } - In the
Mainmethod, create a task that callsMethod1andTaskthat callsMethod3. Wait for the user input before exiting.static void Main() { var task1 = Task.Factory.StartNew(() => Method1()); var task2 = Task.Factory.StartNew(() => Method3()); Console.ReadLine(); }
Let's start a debugging session and take a look at the window.
- In Visual Studio 2012, press F5 to run the project.
- When the debugger hits the
Debug.Breakstatement, go to the Debug menu of Visual Studio 2012, and click on Windows, and click on Call Stack to view the Threads window. - The active thread is the thread that is currently selected in the Threads window, indicated by the arrow icon. By default, the active thread is the one that hits the breakpoint. Switch the active thread via the Threads window by double-clicking on a different thread in the view.

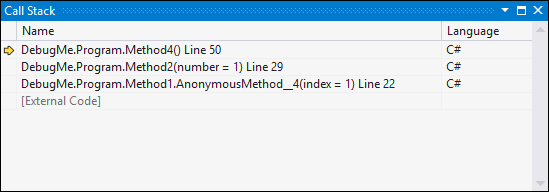
- Go back to the Debug menu, click on Windows, and click on Threads to show the Call Stack window.
- The Call Stack window indicates the top of stack of the active thread with a arrow icon. This is known as the active stack frame. When switching threads, the active stack frame changes. When execution resumes, the execution continues from the active stack frame onwards.
- The current stack frame is the stack frame that drives the rest of the debugger tools and windows. Change the current stack frame by double-clicking on a different entry in the Call Stack window. When changing the current stack frame to be something other than the active stack frame, it shows a tapered arrow.

- You can navigate to the source code for any entry in stack frame. In the Call Stack window, right-click on the function whose source code you want to see and click on Go To Source Code from the shortcut menu.
