
As the degree of parallelism in our applications continues to grow, we need the ability to view and navigate multiple threads call stacks from a single view. A developer debugging a multi-threaded application needs the ability to view call stacks of multiple threads at the same time, in order to see an overall picture of the application's status.
In this recipe, we will see how to use the Parallel Stacks window in Visual Studio 2012 to get a graphical view of the call stacks of all tasks in our application.
Now, let's go back to Visual Studio 2012 and take a look at the Parallel Stacks window.
- In Visual Studio 2012, press F5 to run the project.
- When the debugger hits the
Debug.Breakstatement, go to the Debug menu, click on Windows, and click on Parallel Stacks to display the Parallel Stacks window.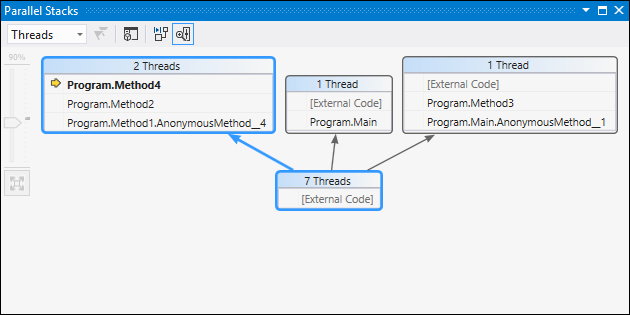
- Your Parallel Stacks view may differ slightly from the image, but you can see the call stacks of all of our tasks in a single graph view. The Parallel Stacks window in the preceding screenshot shows that we have one thread that went from an anonymous method in
MaintoMethod3, as was called out to External Code. One thread is inMain, and had gone out to the External Code. Two other threads started, have gone through an anonymous method inMethod1, throughMethod2, toMethod4. This is also the active stack frame and this is the current thread, as indicated by the flag on the active thread. Visual Studio 2012 groups threads that have the same call stack information together into the same box. - Hover your mouse over the boxes and notice the tool tips that show the stack frame information, including method name and parameter values for each thread grouped into the box.

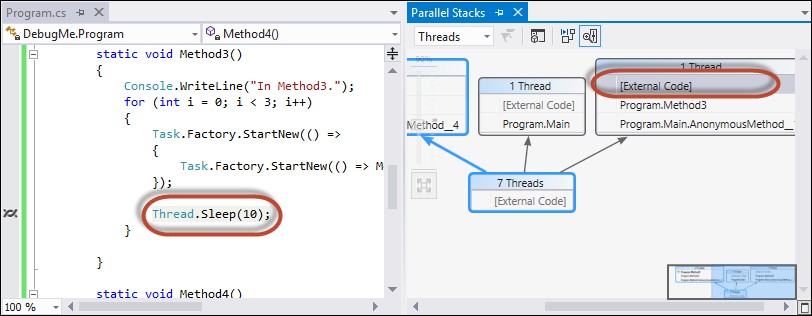
- You can double-click on any item in the stack frame of the thread to navigate to the code.
- To switch to another thread, right-click on the stack frame of the desired thread and click on Switch To Frame. Notice that highlight has changed to the selected stack frame, and there is a green arrow in the box indicating that this is the current stack frame that the debugger is focusing on, as opposed to the active stack frame which is indicated by an arrow.

- You can switch back to the active stack frame by double-clicking on it in the Parallel Stacks windows. Notice that it has a thread icon rather than an arrow while the different stack frame has the focus of the debugger. Once you double-click on it, the arrow returns, indicating that this is the active and current thread.

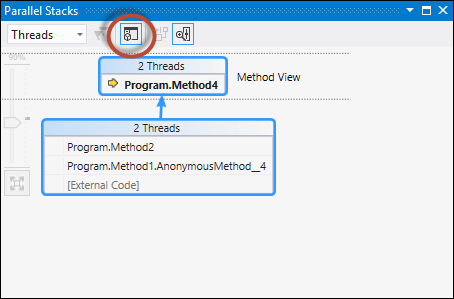
- You can see the Threads that have called a method by clicking on the current stack frame, and then click on the Method View button on the Parallel Stacks window menu. After clicking on the button, the view will change to show which methods the threads are calling.
..................Content has been hidden....................
You can't read the all page of ebook, please click here login for view all page.