Chapter 17
Graphing
A graph is a visual representation of mathematical data. Graphs make it easy to see how a set of values relate to each other. In this chapter, you hone your graph-reading skills. You also get some practice working with the most ubiquitous graph in mathematics, the xy-graph.
The Problems You’ll Work On
Here’s a preview of the types of problems you’ll solve in this chapter:
![]() Working with graphs that display data: bar graphs, pie charts, line graphs, pictographs
Working with graphs that display data: bar graphs, pie charts, line graphs, pictographs
![]() Plotting points, calculating slope, and finding the distance between two points on the xy-graph
Plotting points, calculating slope, and finding the distance between two points on the xy-graph
What to Watch Out For
The problems in this chapter provide practice in working with a variety of types of graphs. Here are descriptions of each type of graph, with some additional pointers for answering questions about the xy-graph.
![]() A bar graph allows you to compare values that are independent from each other.
A bar graph allows you to compare values that are independent from each other.
![]() A pie chart provides a picture of how an amount is divided into percentages.
A pie chart provides a picture of how an amount is divided into percentages.
![]() A line graph shows you how a value changes over time.
A line graph shows you how a value changes over time.
![]() A pictograph, similar to a bar graph, allows you to compare values that are independent from each other.
A pictograph, similar to a bar graph, allows you to compare values that are independent from each other.
![]() An xy graph (also called a Cartesian graph) allows you to plot points as pairs of values (x, y).
An xy graph (also called a Cartesian graph) allows you to plot points as pairs of values (x, y).
![]() Find the slope of a line that passes between two points on the xy-graph by starting with the point on the left and proceeding toward the point on the right. First count the number of points up or down and then count the number of points over (that is, from left to right), and make a fraction from these two numbers.
Find the slope of a line that passes between two points on the xy-graph by starting with the point on the left and proceeding toward the point on the right. First count the number of points up or down and then count the number of points over (that is, from left to right), and make a fraction from these two numbers.
![]() Find the distance between two points on the xy-graph by drawing a right triangle using the distance between these two points as the hypotenuse. Calculate the length of this hypotenuse using the Pythagorean theorem:
Find the distance between two points on the xy-graph by drawing a right triangle using the distance between these two points as the hypotenuse. Calculate the length of this hypotenuse using the Pythagorean theorem: ![]() .
.
Bar Graph
731-736 The bar graph shows the number of dollars that each of six people collected for charity during their office walk-a-thon.

731. Which person collected exactly $200 more than Brian?
732. How much money did the three women (Arianna, Eva, and Stella) collect altogether?
733. What fraction of the total amount did Stella collect?
734. What is the ratio of Stella’s total to Tyrone’s?
735. If Eva had collected $300 less, which other person would have collected the same amount of money as she did?
736. To the nearest whole percentage point, what percentage of the total did Arianna and Tyrone contribute together?
Pie Chart
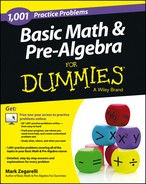
737-742 The pie chart shows the percentages of time that Kaitlin devotes to studying for her five college classes.
737. Which two classes combined take up exactly half of Kaitlin’s time?
738. Which three classes combined take up exactly 55% of Kaitlin’s time?
739. If Kaitlin spent 20 hours last week studying, how much time did she spend studying for her Spanish class?
740. If Kaitlin spent 1.5 hours more studying for her Calculus class than her Economics class, how much time did she spend studying altogether?
741. If Kaitlin spent three hours last week studying for her Physics class, how many hours did she spend studying altogether?
742. If Kaitlin spent two hours last week studying for her Economics class, how much time did she spend studying for her Biochemistry class?
Line Graph
743–747 The line graph shows the monthly net profit statement for Amy’s Antiques from January to December.

743. In which month was the net profit the same as the net profit in February?
744. What is the total net profit for the first quarter of the year (that is, January, February, and March combined)?
745. Which month shows the same increase in net profit, when compared with the previous month, as was shown in April when compared with March?
746. Which pair of consecutive months shows a combined net profit of exactly $8,800?
747. Which month accounts for approximately 5% of the total yearly net profit?
Population Pictograph
748–752 The pictograph below shows the population of the six towns in Alabaster County.

748. What is the population of the largest town in Alabaster County?
749. Which town contains slightly more than ![]() of the population of the county?
of the population of the county?
750. To the nearest whole percentage, what percent of the county lives in Morrissey Station?
751. Which pair of towns has a combined population that’s 1,000 greater than Plattfield?
752. Imagine that the population of Talkingham increased by the equivalent of one stick figure in the graph and the other five towns remained constant in their populations. In that case, to the nearest whole percent, what percentage of Alabaster county would reside in Talkingham?
Pie Chart
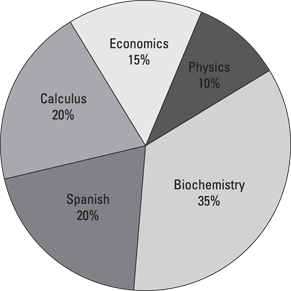
753–757 The pie chart below shows the election turnout for the mayor of Branchport.
753. Together, the two top candidates received what percentage of the vote?
754. Which pair of candidates received 35% of the vote together?
755. If 100,000 votes were cast, how many more votes did Faralese receive than Williamson?
756. If Jordan received 34,000 votes, how many votes were cast altogether?
757. If Bratlaski received 53,200 more votes than Pardee, how many votes did McCullers get?
Trees Pictograph
758–762 The pictograph shows the number of trees planted in six counties.

758. How many trees were planted altogether in Edinburgh and Manchester Counties?
759. How many trees were planted altogether in the six counties?
760. Which two counties together account for 50% of the trees planted among the six counties?
761. Which county accounts for 18.75% of the trees planted among the six counties?
762. Imagine that 1,000 more trees had been planted in Calais County and all the other counties remained the same. In that case, what fraction of the total number of trees would have been planted in Calais County?
Cartesian Graph
763–770 Use the xy graph to answer the questions.

763. Name the point at each of the following coordinates:
i. (1, 6)
ii. (–3, –1)
iii. (–2, 5)
iv. (3, 4)
v. (5, –3)
764. What is the slope of the line that passes through both the origin (0, 0) and Q?
765. What is the slope of the line that passes through both the origin (0, 0) and S?
766. What is the slope of the line that passes through both P and Q?
767. What is the slope of the line that passes through both R and T?
768. What is the slope of the line that passes through both S and T?
769. What is the distance between the origin (0, 0) and P?
770. What is the distance between R and S?