
STEP FOUR
Analyzing the Collected Data
OVERVIEW
Coding and sorting data
Analyzing data
Identifying key findings, conclusions, and recommendations
Validating your findings
Reporting findings and gaining commitment
Data analysis is the examination of information to arrive at a finding or discovery. Two primary methods are used to analyze data when developing a strategic plan: thematic analysis and quantitative analysis.
In thematic analysis, data are grouped or classified by specific content areas related to the strategic plan. This method helps you identify trends and validate similarities across the data. Data gathered through interviews and background research are typically analyzed using thematic analysis.
In quantitative analysis, data are assigned numbers and viewed statistically. Percentages, counts, comparisons, and mathematical calculations are performed and compiled to create findings. Although this type of analysis is most often used with surveys, it also can be used with data gleaned from interviews, focus groups, and other forms of data gathering.
In this step we'll cover the framework and tools you'll use to analyze the information you collected in Step 3. The text and the tools here will help you identify trends in your data that indicate the tactics that should be included in the strategic plan. They also will help you control bias as much as possible and keep data distortion resulting from subjective information to a minimum. Specifically, this step covers the following topics:
![]() coding and sorting your collected data
coding and sorting your collected data
![]() organizing data for coding
organizing data for coding
![]() completing calculations
completing calculations
![]() analyzing data
analyzing data
![]() examining data to identify key findings, conclusions, and recommendations
examining data to identify key findings, conclusions, and recommendations
![]() validating the findings
validating the findings
![]() reporting findings and gaining commitment.
reporting findings and gaining commitment.
As in our discussions of the first three steps, let's look first at a couple of case examples.
Case Examples: Analyzing Data
These two case examples demonstrate how data analysis is used as the basis for a strategic plan.
Learning from the Data
Tarlow Technologies is a three-year-old organization that develops software. The HR group is new to the organization, and to align itself more strategically with management, the group decided to develop an HR strategic plan. Because all of the group members were new to the company, they knew little about Tarlow's customer base, products, or services. The strategy development process was a good opportunity for the group to learn more about the organization and to define how HR would operate during the next 18 months.
Because the company is small, the HR charter was to educate both employees and customers. HR worked with marketing to gather preexisting market research data about the customer base, the company's learning needs, and other relevant information. HR also conducted interviews with management and did background research to identify how best-in-class companies provided learning product development and delivery to both customers and employees.
The group used thematic analysis to identify the major customer, business, learning, and finance trends in the information it gathered, and was able to determine which of those trends the strategic plan should address. The group identified how the trends aligned with the information gathered during the business scan conducted in Step 2.
POINTER
Data analysis is an examination of the elements of, and relationships among, pieces of information to arrive at a finding or discovery.
By organizing and presenting the underlying facts logically, the HR group not only gained buy-in to the next step in developing the strategic plan, but also generated a brainstorming session that resulted in the HR group being seen as a strategic partner in delivering customer products and generating revenue for the company.
Bubbles Bursts into Data Analysis—And Its Strategy Pops Up
Bubbles is a retail store aimed at the children and teens market. It's enjoyed substantial growth through numerous bricks-and-mortar outlets across the country and now is positioning itself to expand internationally and through the Internet. To ensure that this expansion is re-addressed in its mission and that the strategy is on track, the strategy planning group has amassed a great deal of information. These data include financial information, industry comparisons, global and country analyses, and feedback from customers and suppliers. Early on in the data collection process, planners realized that the data from various sources would have to be cross-compared. A system for data coding was established and the files were entered in the database so that customer and supplier feedback could be compared. A pivot table (see the glossary for a definition) also was used to compare the children's wear cycles and growth in various countries. As a result of all this analysis, Bubbles discerned customer and supplier levels of satisfaction and identified the countries into which they would expand first.
Coding and Sorting Data
Your first step in data analysis is to identify how the data relate to the strategic plan and its corresponding outcomes, goals, and objectives. If you use the outcomes expected from the strategic plan and code the data components by outcome, your analysis will go more quickly. Coding your data as you do your interviews or research lets you build a data audit trail so that, as findings, conclusions, and recommendations are developed, you can trace them back to the original data on which you based them.
Coding can be completed in two ways: by strategy-related out-come or by the specific topic to which the data apply in the strategic plan. As you gather or review the data from your research, record the category code for each component in the margin or data file; for example, each data component related to risk and risk mitigation would be coded “RM.”
Survey responses and notes from interviews, focus groups, and background research all can be coded (see Step 3). The sample interview guide (example 3.2) indicates how coding can be done by identifying the purpose of or the rationale for each question. The common categories for this type of research are
![]() mission: the organization's fundamental purpose or reason for existence
mission: the organization's fundamental purpose or reason for existence
![]() key challenges and business drivers: the significant trials and barriers (key challenges) to meeting the internal and external forces (business drivers) that affect the organization as a whole (for example, the economy, public perception, international situation, and competition)
key challenges and business drivers: the significant trials and barriers (key challenges) to meeting the internal and external forces (business drivers) that affect the organization as a whole (for example, the economy, public perception, international situation, and competition)
![]() strategic outcome: what you hope will happen as a result
strategic outcome: what you hope will happen as a result
![]() risk and risk mitigation: the potential undesired consequences of implementing the strategy's tactics, programs, and services, and how best to avoid those consequences
risk and risk mitigation: the potential undesired consequences of implementing the strategy's tactics, programs, and services, and how best to avoid those consequences
![]() tactics: the detailed information on tasks, timeframe, resource requirements, and budget requirements for the methods and approaches used to achieve the mission
tactics: the detailed information on tasks, timeframe, resource requirements, and budget requirements for the methods and approaches used to achieve the mission
![]() metrics: measurements that gauge the strategy's performance and track progress on its goals, objectives, and mission
metrics: measurements that gauge the strategy's performance and track progress on its goals, objectives, and mission
![]() resources: the human, financial, and other assets needed to support the tactics and meet (or exceed) the desired outcomes.
resources: the human, financial, and other assets needed to support the tactics and meet (or exceed) the desired outcomes.
Worksheet 4.1 demonstrates the use of coding to expedite the data analysis process for research findings.
Example 4.1 illustrates coding by objective. The first column identifies the objectives of the research. The middle column lists the code used for each objective. Column 3 lists the findings of the pertinent data, both qualitative and quantitative. Common data codes other than those indicating a theme are defined in example 4.2.
Organizing Data for Coding
It's helpful if you can be methodical in organizing your data for coding, as illustrated in examples 4.1 and 4.2. Having a system for organizing your data helps identify categories, patterns, themes, and logical relationships among the various data groups. It also creates an opportunity to ask additional questions about your data.
If you're working with a group, it's helpful to set up a three-column system on flipchart paper to organize the data. The three columns are
1. preexisting categories, such as outcomes, business drivers, mission, and so forth
2. data codes, as described in example 4.2
3. parking lot, where anything that doesn't fit in the first column can be placed temporarily.
When you've organized the data into the categories you identified earlier, reexamine the data and identify new themes or categories for the parking lot data. As you categorize that “new data,” create another three-column chart, making notes about your hypothesis and the reasoning behind the new theme(s).
WORKSHEET 4.1
Thematic Analysis for Examining Data and Identifying Findings
Instructions: Topics typically included in a strategic plan are listed in column 1. In column 2, write the source of relevant data you have collected. If the source is an interview or survey question, note the question number. In column 3, record the data gathered. In column 4, describe what you have learned from the data—your key findings. The first topic has been completed as an example.


EXAMPLE 4.1
Data Coding by Objective
| Objective | Code | Data Related to Code |
| To discover our organization's customer issues that our products, programs, and services should address | Customer issues |
|
|
||
|
||
| To identify how we compare to our competition | Competition | We do not understand who our competition is. |
| To determine how to align with technology to improve employee performance within the organization | Technology |
|
|
||
| To identify critical gaps in employee performance | Lack of internatl ability |
|
This type of organization helps you identify various relationships that exist among the data and, ultimately, will lead you to your findings, conclusions, and recommendations. A word of caution, however: Because bias makes it easy to see themes and relationships where they really don't exist, have others who are not as involved in the data analysis play the devil's advocate.
If a group is coding data, share the coding and data with a peer or group of peers to see the data similarities. If agreed to, this provides a degree of reliability in your coding process. If the data coding is a group event, beware of how agreement was reached. Did a dominant player with seniority or strong feelings/opinions about the data or the ultimate outcome influence the ultimate agreement? This is called the falsification principle. In other words, the finding is untrue and not based on facts—it's the result of opinions or influence.
EXAMPLE 4.2
Nonthematic Data Codes
| Code | Meaning | Explanation |
| I | Impression | The analyzer's impression; implied but not necessarily stated directly in the data or interview |
| Q | Quote | Directly stated in the data or a quote from the interview |
| F | Frequent | Repeatedly found in the data |
| S | Sporadic | Found in the data once or twice |
| Q# | Number of the question to which data are related | If the data were found in a response to another question, note the question number it relates to next to the data. For example, if information related to Mission (Q1) is found in Other (Q19), note the question number (Q1) beside the information you document in Q19. |
| P# | Letter of the probe related to a specific question | Note the probe letter if the information was provided as a response to a particular probe. |
There are various resources available to assist you in your research and in coding the data you collect. These resources are listed with a brief description in tool 4.1.
Completing Calculations
Survey feedback usually is reported using descriptive statistics—numbers that summarize how items were answered on the questionnaire. Here are typical descriptive statistics for surveys:
![]() Frequency, or how many responses were provided for each item (for example, 6 of 20 for response a, four of 20 for b, 10 of 20 for c)
Frequency, or how many responses were provided for each item (for example, 6 of 20 for response a, four of 20 for b, 10 of 20 for c)
![]() Percentage, which converts frequency to a proportion by dividing the number of specific responses by the total number of responses, and then multiplying by 100 (for example, 30 percent for response a, 20 percent for b, 50 percent for c)
Percentage, which converts frequency to a proportion by dividing the number of specific responses by the total number of responses, and then multiplying by 100 (for example, 30 percent for response a, 20 percent for b, 50 percent for c)
![]() Cumulative frequency, which identifies how many respondents selected a specific number on a Likert scale (for example, 20 of 100 gave a ranking of 3, on a scale of 1 to 5, for the level of technical sophistication of our product support courseware)
Cumulative frequency, which identifies how many respondents selected a specific number on a Likert scale (for example, 20 of 100 gave a ranking of 3, on a scale of 1 to 5, for the level of technical sophistication of our product support courseware)
![]() Cumulative percentage, which simply converts cumulative frequency to a proportion (for example, 20 percent gave a ranking of 3, on a scale of 1 to 5, for the level of technical sophistication of our product support courseware)
Cumulative percentage, which simply converts cumulative frequency to a proportion (for example, 20 percent gave a ranking of 3, on a scale of 1 to 5, for the level of technical sophistication of our product support courseware)
![]() Averages by which data are represented as a “typical value”:
Averages by which data are represented as a “typical value”:
![]() Mean is most commonly thought of as an average, and it represents all the data values added together and divided by the number of items (for example, 12 + 10 + 10 + 12 = 44, and 44 divided by 4 = 11, so 11 is the average of the four numbers. (The mean is not the same as the median.)
Mean is most commonly thought of as an average, and it represents all the data values added together and divided by the number of items (for example, 12 + 10 + 10 + 12 = 44, and 44 divided by 4 = 11, so 11 is the average of the four numbers. (The mean is not the same as the median.)
![]() Median, the middle or midpoint of a group of numbers put in order. For example, in the nine-number group 2, 4, 5, 8, 9, 19, 20, 21, 22, the fifth number (9) is the median. If the group of numbers is even, take the two numbers that are in the middle and average them to produce the median—that is, the median of the even-numbered group 2, 4, 5, 8, 9, 19, 20, 21 would be 8.5.
Median, the middle or midpoint of a group of numbers put in order. For example, in the nine-number group 2, 4, 5, 8, 9, 19, 20, 21, 22, the fifth number (9) is the median. If the group of numbers is even, take the two numbers that are in the middle and average them to produce the median—that is, the median of the even-numbered group 2, 4, 5, 8, 9, 19, 20, 21 would be 8.5.
![]() Mode, which is typically the least used of the averages, is the most repeated number in the group. For example, in a group of leadership scores there were the following results: 70, 82, 90, 90, 86, 82, 82, 90, 85, 82, 70, 61, 82, 93, 96. The mode is 82.
Mode, which is typically the least used of the averages, is the most repeated number in the group. For example, in a group of leadership scores there were the following results: 70, 82, 90, 90, 86, 82, 82, 90, 85, 82, 70, 61, 82, 93, 96. The mode is 82.
![]() Ranges of variation, which let you know how reliable your data are. The most common way a variation in data is described is through the standard deviation—the square root of the variance. The variance is found by subtracting the average from each data item. In most cases, there will be as many negative (items below the average) as positive (items above the average) numbers. Generally 68.3 percent of the data will be within 1 standard deviation of the mean.
Ranges of variation, which let you know how reliable your data are. The most common way a variation in data is described is through the standard deviation—the square root of the variance. The variance is found by subtracting the average from each data item. In most cases, there will be as many negative (items below the average) as positive (items above the average) numbers. Generally 68.3 percent of the data will be within 1 standard deviation of the mean.
POINTER
Consistent data analysis used by all members responsible for the analysis ensures that the results will be complete and accurate.
TOOL 4.1
Data and Coding Resources
| Resource | Description |
| Action Research Resources (www.scu.edu.au/schools/gcm/ar/arp/grounded.html) | Presents discussions of and processes for coding, sorting, and notetaking |
| Knowledgestorm (www.knowledgestorm.com) | Offers data sites for specific research needs |
| Blue Claw Database Design (www.blueclaw-db.com) | Offers examples of Microsoft Access studies |
| Kerlins.net (www.kerlins.net) | Provides specific information for qualitative research as well as an in-depth bibliography |
| Ask.com search engine (www.ask.com) | Provides several search tools that enable you to determine what sites are most beneficial before you access them |
| University of Pennsylvania (www.wharton.upenn.edu) | Includes information on new theories and research methods |
Analyzing Data
When all people responsible for analyzing the data collected are using consistent analysis methods, the results will be complete and accurate. Consistency also identifies the data tests that will be performed and how findings will be addressed and tested. Tool 4.2 lists and describes the steps to completing the data analysis process.
Examining Data to Identify Key Findings, Conclusions, and Recommendations
Deciding what your findings are basically is a matter of interpreting the data. But you must go beyond the descriptive data or interview notes and the categories and themes that you developed in creating the data-gathering tools to determine the significance of what you found, to offer explanations, to draw conclusions, to extrapolate ideas, to make inferences, or to create linkages—in short, to attach meaning to the data. We've exemplified how to complete a finding in the first item on worksheet 4.1, Mission.
To arrive at a finding, first confirm that what you say is a “finding” truly is one by validating it against other data. For example, let's say that in interviews you conducted with customers, most indicated that they use some form of Web support to identify product features and benefits. You can validate this as a finding by comparing it with your best-practices research to determine if this is a growing consumer trend.
TOOL 4.2
Steps in the Data Analysis Process
| Process Step | Step Description |
1. Identify the scope of the analysis |
Using the objectives and goals for the strategic plan, identify how these data are relevant to the plan itself. |
2. Ensure the reliability of the raw data |
Review the data and the collection process to ensure it was carried out in a way that it is pure, and that there is no bias or manipulation of the data. |
3. Extract the data |
Extract the data and verify its integrity, completeness, and relevancy. |
4. Import or input data to a data analysis tool or worksheets |
Put the data into some sort of database reporting tool (or a manual worksheet), and ensure that the data have been input/imported correctly. The data fields should match the data that has been imported in them (for example, Age: 35, not ABCD). |
5. Profile the data |
Run an initial database report to ensure that no data have been omitted and that the data are relevant (for example, an employee's name is incorrectly listed as John instead of Joan, or the department to which an employee is assigned is wrong). |
6. Analyze the data from the database |
Analyze the data to identify evidence, conclusions, and first-level findings. |
7. Report the data |
Identify the type of report you will use to report the data and the findings associated with them. |
8. Document the findings |
Document the findings and provide evidence for those findings in the form of reports, spreadsheets, flowcharts, results of observations, and so forth. |
When you've identified all of your findings, choose those you consider key. You identify key findings by isolating specific variables that you think are important for the development of the strategy, and then determining if there are any interdependencies. In other words, if we [something], then [something else] will occur—and it's the “something else” that we want. Here's an example: If we develop a strong management program that emphasizes leadership, then we will create a pool of senior-level managers within our organization. When you've identified your key findings, add them to column 4 of worksheet 4.1.
Conclusions in this context are your interpretations of key findings—what the findings mean relative to the strategic plan. You may decide that before you interpret the meaning of a key finding, you need to sort the data differently. You may need to sort them by various demographic groups and determine if the finding is true across those groups or if it pertains to just one or two groups. Let's say a key finding is that employee turnover is very high. As a result of this finding, the HR manager wants to know what role HR can play in decreasing turnover or increasing retention. The manager re-sorts the turnover information, and the re-sorting reveals that the majority of turnover is in the information systems department. If the department's employees are leaving for higher-paying jobs and shorter hours, HR may not be a key player in this turnover. On the other hand, if employee dissatisfaction or managerial problems are prompting the departures, HR may play a critical role and the conclusion may be that further investigation is needed about what that role should be.
Recommendations are derived from the findings and the conclusions, and they form the basis for the tactical plan in the strategic plan. Using the turnover example above, the recommendation for the strategic plan may be to work with other HR business partners to identify the products and services HR can provide to information systems managers to help reduce turnover in that department.
Example 4.3 illustrates how you track the conclusions and recommendations with the findings that support them. It is possible that in some future time, there will be questions about why you chose to implement specific tactics. The examples in this table were created from the data in example 4.1.
Validating the Findings
Validating the findings means determining if they are accurate, stable, and repeatable. Can you trust the numbers? Is the information being used as it was intended in the instrumentation, or have you altered the numerical findings so they lead you to a mistaken conclusion? For example, if 90 percent of those responding to a survey indicated they prefer taking computer training for “some subjects,” you can't claim the finding that respondents prefer computer training for all subjects.
Here's an example of findings that validate each other: If the organizational findings indicate that sales are falling and the organization is losing customers, and the survey data indicate that your respondents feel they're unable to compete for sales effectively because they don't have accurate competitor information, then you can begin to build a cause-and-effect scenario. The organizational findings (reduced sales, customer flight) validate the survey findings (competitive inequity, lack of information), and vice versa.
There are several testing methods you can use to ensure that the findings are supportable and relevant to the data. Tool 4.3 provides examples and descriptions of the four most common methods for testing data findings.
It's also helpful to validate relationships between the data and the strategic outcomes. You can validate these relationships by asking yourself or the planning team the following five questions:
1. How does (or doesn't) this finding relate to the current strategic outcomes?
2. What more do I need to know about this finding and its relationship to the outcomes?
3. Why is more information needed to validate this finding's relationship to the strategic outcomes?
4. How will I use this finding in relation to the strategic plan?
5. Is there another reason that this finding is related to the outcomes?
EXAMPLE 4.3
Relating Conclusions and Recommendations to Key Findings
| Conclusion | Supporting Key Findings |
1. As a result of deregulation, our product line and competition changed. We are now in an environment where our customers have more knowledge about us than we have about them and about how we can be of assistance to them. |
|
|
|
|
|
2. We do not have information readily available about our competition and therefore do not understand how we differ or what we do that is similar. |
|
3. Performance problems are compounded by the lack of technology to support our infrastructure, processes, and procedures. |
|
| Recommendation | Supporting Key Findings |
1. The organization needs to provide course-ware and job aids that assist employees in understanding the customer, our product line, and how to assess customer needs and match products to them. |
|
|
|
|
|
2. The organization needs to partner with marketing or another group and work on a competitive study so job aids and information about our competition can be built into our training products and services. |
|
3. The organization needs to partner with information services to create an electronic performance support system that will provide necessary information, processes, and procedures to employees on their desktops. |
|
TOOL 4.3
Methods for Testing the Validity of Your Findings
| Test Method | Descriptions |
| Initial thesis | In data analysis you sometimes see an initial explanation that has never been considered before. It's possible this thesis will result in an emerging opportunity to change or tweak the outcomes, goals, and objectives of the strategic plan and so will vastly affect your organization as a whole over the long term. It is probable that you'll find that more research is needed to prove or disprove that this thesis is the right path to travel. |
| Cause and effect | In data analysis, you often can identify what the core or original problem is, but you are unsure what might be the ultimate source of that problem. For example, cost of inventory is rising in the organization. There could be many “causes”—perhaps storage cost is rising because of higher rental or lease rates, the inventory product itself is rising, product cost is lowering but is offset by the rising storage cost. It's important to look at all the variables that may affect the rise in the cost of inventory before changing a factor. Perhaps you are increasing inventory because you know in the next season the product will no longer be available or will be more costly. This is why looking closely at causes and effects in data analysis can ensure you don't jump to the wrong conclusions or make poor decisions. |
| Triangulation | When a variety of data sources all have the same results, it can lead to a strong finding. For example, if your customers are saying that the salespeople are ill-trained on the product and cannot speak to the benefits and disadvantages, and the business partners say that product training for your organization is poor, and the salesforce says product training is either poor or nonexistent, then product training most likely is something your organization needs to work on. If different data methods—perhaps a literature search, interviews, and a survey—resulted in the same findings, this is triangulation. |
| Multiple factors | In this test you are looking at the same effect in multiple factors—for example, a rise in price, falling customer satisfaction with the product, lower organizational revenue, decreased competitive advantage, and less ability to market actively to new prospects. In other words, the evidence shows that one factor (price increase) influenced multiple other factors in the organization; it did not affect only one component. |
TOOL 4.4
Additional Questions for Validating Findings
| Question | Rationale |
| Do you have any questions about the findings? Are the findings understandable? | To reveal resistance to or problems with the findings early on so that they can be resolved |
| Is there any finding here that you think we need to know more about before proceeding? | To uncover any missing information about new programs or factors that might influence the findings |
| Did any of the findings surprise you? | To validate the information (normally the findings won't surprise anyone, but if they do, the audit trail of source and response may enable others to see why the findings are what they are) |
After validating the findings against the strategy, ask yourself or the team some additional questions. You'll find these questions and the rationale behind asking them in tool 4.4.
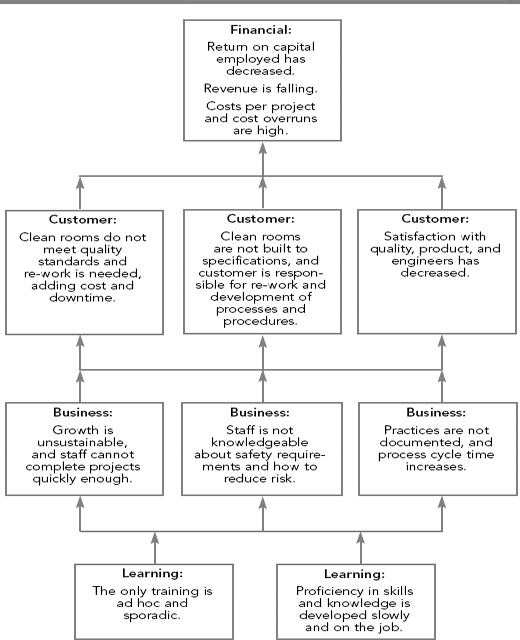
Finally, if your organization uses a “balanced scorecard” (as in Norton/Kaplan's Balanced Scorecard) for strategic planning or for performance measurement, then it may be helpful to use this scorecard to validate your findings by identifying the cause and effect through the four levels. Figure 4.1 identifies the cause and effect of the findings in learning, business, customer, and financial aspects, and how they relate to each other. By using this cause-and-effect process to relate your findings, you'll shorten the process to develop a balanced scorecard for your strategic plan. This cause-and-effect diagram supports strategic plan scorecard development and helps managers see that not all business issues would be affected by one change. For example, growth is unsustainable, but senior management would need to assign other resources to resolve this larger problem.
FIGURE 4.1
Cause-and-Effect Findings Diagram for a Balanced Scorecard Strategic Plan
When you've tested and validated your findings, you're ready to document them for others to see and debate.
Reporting Findings and Gaining Commitment
The report on the findings should be concise and to the point. Aim for a three- to five-page report at most, although more people are likely to read your report if it is only two pages long. With this in mind, an outline for a findings report is provided in Tool 4.5. The content areas of the report are listed and described in columns 1 and 2, and there is space in the final column for your notes as you prepare the outline for your report.
The report should be distributed to stakeholders, business partners, sponsors, members of the strategic planning group, and, if appropriate, to participating customers. You probably will want to have a much shorter version with just the key findings and conclusions for those who participated in the information gathering. This could be housed on a Website and referred to when you ask for their assistance in gaining commitment. It's important that all parties who see any portion of this report understand that it's the data analysis report and not the strategic plan!
As part of the process of gaining commitment, you should solicit specific information from your stakeholders, business partners, sponsors, and others who will assist you in implementing the strategy. An effective method to solicit this information and encourage commitment is to ask them questions about the reported findings and conclusions. Tool 4.6 lists some questions to use in this process and the rationale for asking these questions to gain commitment.
TOOL 4.5
Components of a Data Analysis Findings Report
| Section of Report | Description | Your Notes |
| Executive summary | Brief (and interesting) summary of the report's highlights | |
| Purpose of report | How this report supports the strategic plan development, or how the data in this report will be used | |
| Data collection process | Steps (and description) of the data collection and analysis process used | |
| Summarized data | Data summarized for report | |
| Significant or key findings | List of key findings | |
| Recommendations for consideration | Recommendations for tactics for consideration, organized by strategic outcome | |
| Acknowledgments | Recognition of those people involved in the data collection process and those who participated | |
| Listing of data sources | List of the data sources and methods used to gather the data |
It's important to use influence when gaining commitment and agreement to the recommendations made for the strategic plan. Although influencing tends to be a complex and often subtle process, there are some specific tactics you can use. First, be logical rather than emotional in your approach. Use facts and evidence to build a persuasive case. Ask questions to get input on how this type of data will be used in the future. Remember, the ultimate result is to build a strategic plan that inspires others to make a move in the strategic direction. Other questions to ask yourself as you begin to build your case include
1. What are the major areas of agreement in the data findings?
2. What are the main differences in people's perceptions of the data findings, conclusions, and recommendations?
3. What aspects of the findings clearly relate to the out-comes as we have defined them?
4. What aspects of the findings, conclusions, and recommendations have potential for exciting others to participate in the strategic direction of the organization?
TOOL 4.6
Questions for Gaining Commitment
| Question | Rationale |
| Are there other groups with whom we should share these findings? | To build outreach for the strategy and get others involved in how the organization plans to progress; it's also an important beginning in building additional partnerships if needed. |
| Does anyone have questions about the conclusions and recommendations? | To reveal any resistance and gain commitment to going forward with the strategic plan. |
| If the organization begins to move forward with these recommendations, do you feel we would be acting in the best interests of our company, customers, and employees? | To gauge support for the recommendations and uncover any further resistance to the organization's moving forward. |
| Are there others we should include in our planning sessions as we move forward? | To open an opportunity for others to get involved and partner with you; if you have a specific resource need, the question can be changed to: Is [a certain employee] available to work with us as we move forward? |
| Are there any objections to our moving forward in the development of the strategic plan at this point? | To bring closure to the validation meeting and announce that the organization is moving forward. There usually are questions about when you expect the plan to be finished and if there will be another review. (Typically, you are about two to three weeks from wrapping up the plan, and normally you will want an additional meeting with your stakeholders and business partners to gain their final commitment to go ahead with the tactics and resource allocation.) |
When you meet with various groups, you can enlist their help to gain commitment across the organization. During advocate interviews you might ask the questions outlined in tool 4.6.
![]()
Much of the tedious work of planning is behind you now. The findings, conclusions, and recommendations that have resulted from your data collection will be the foundation for the remainder of the work. Your next step is to develop your mission statement, and that will be discussed in Step 5.
