Tools
THE SURVEY CONTAINED QUESTIONS IN THE FORM OF “do you use this tool in your current role on a regular basis (about every week)?” for more than 100 tools. Not all tools were specific to design—the list included programming languages, work organization tools, and operating systems—and it wasn’t meant to be exhaustive, with “other” answers available.
Mac OS X appears to be the clear choice for those in the design space, with 88% of the sample using Macs, far more than the 38% who use Windows and the 12% who use Linux. Windows users earned less than Mac users: among those who used one (but not both) of these operating systems, Mac users had a median salary of $95K and Windows users had a salary of $78K, while those who used both had a median salary of $88K.
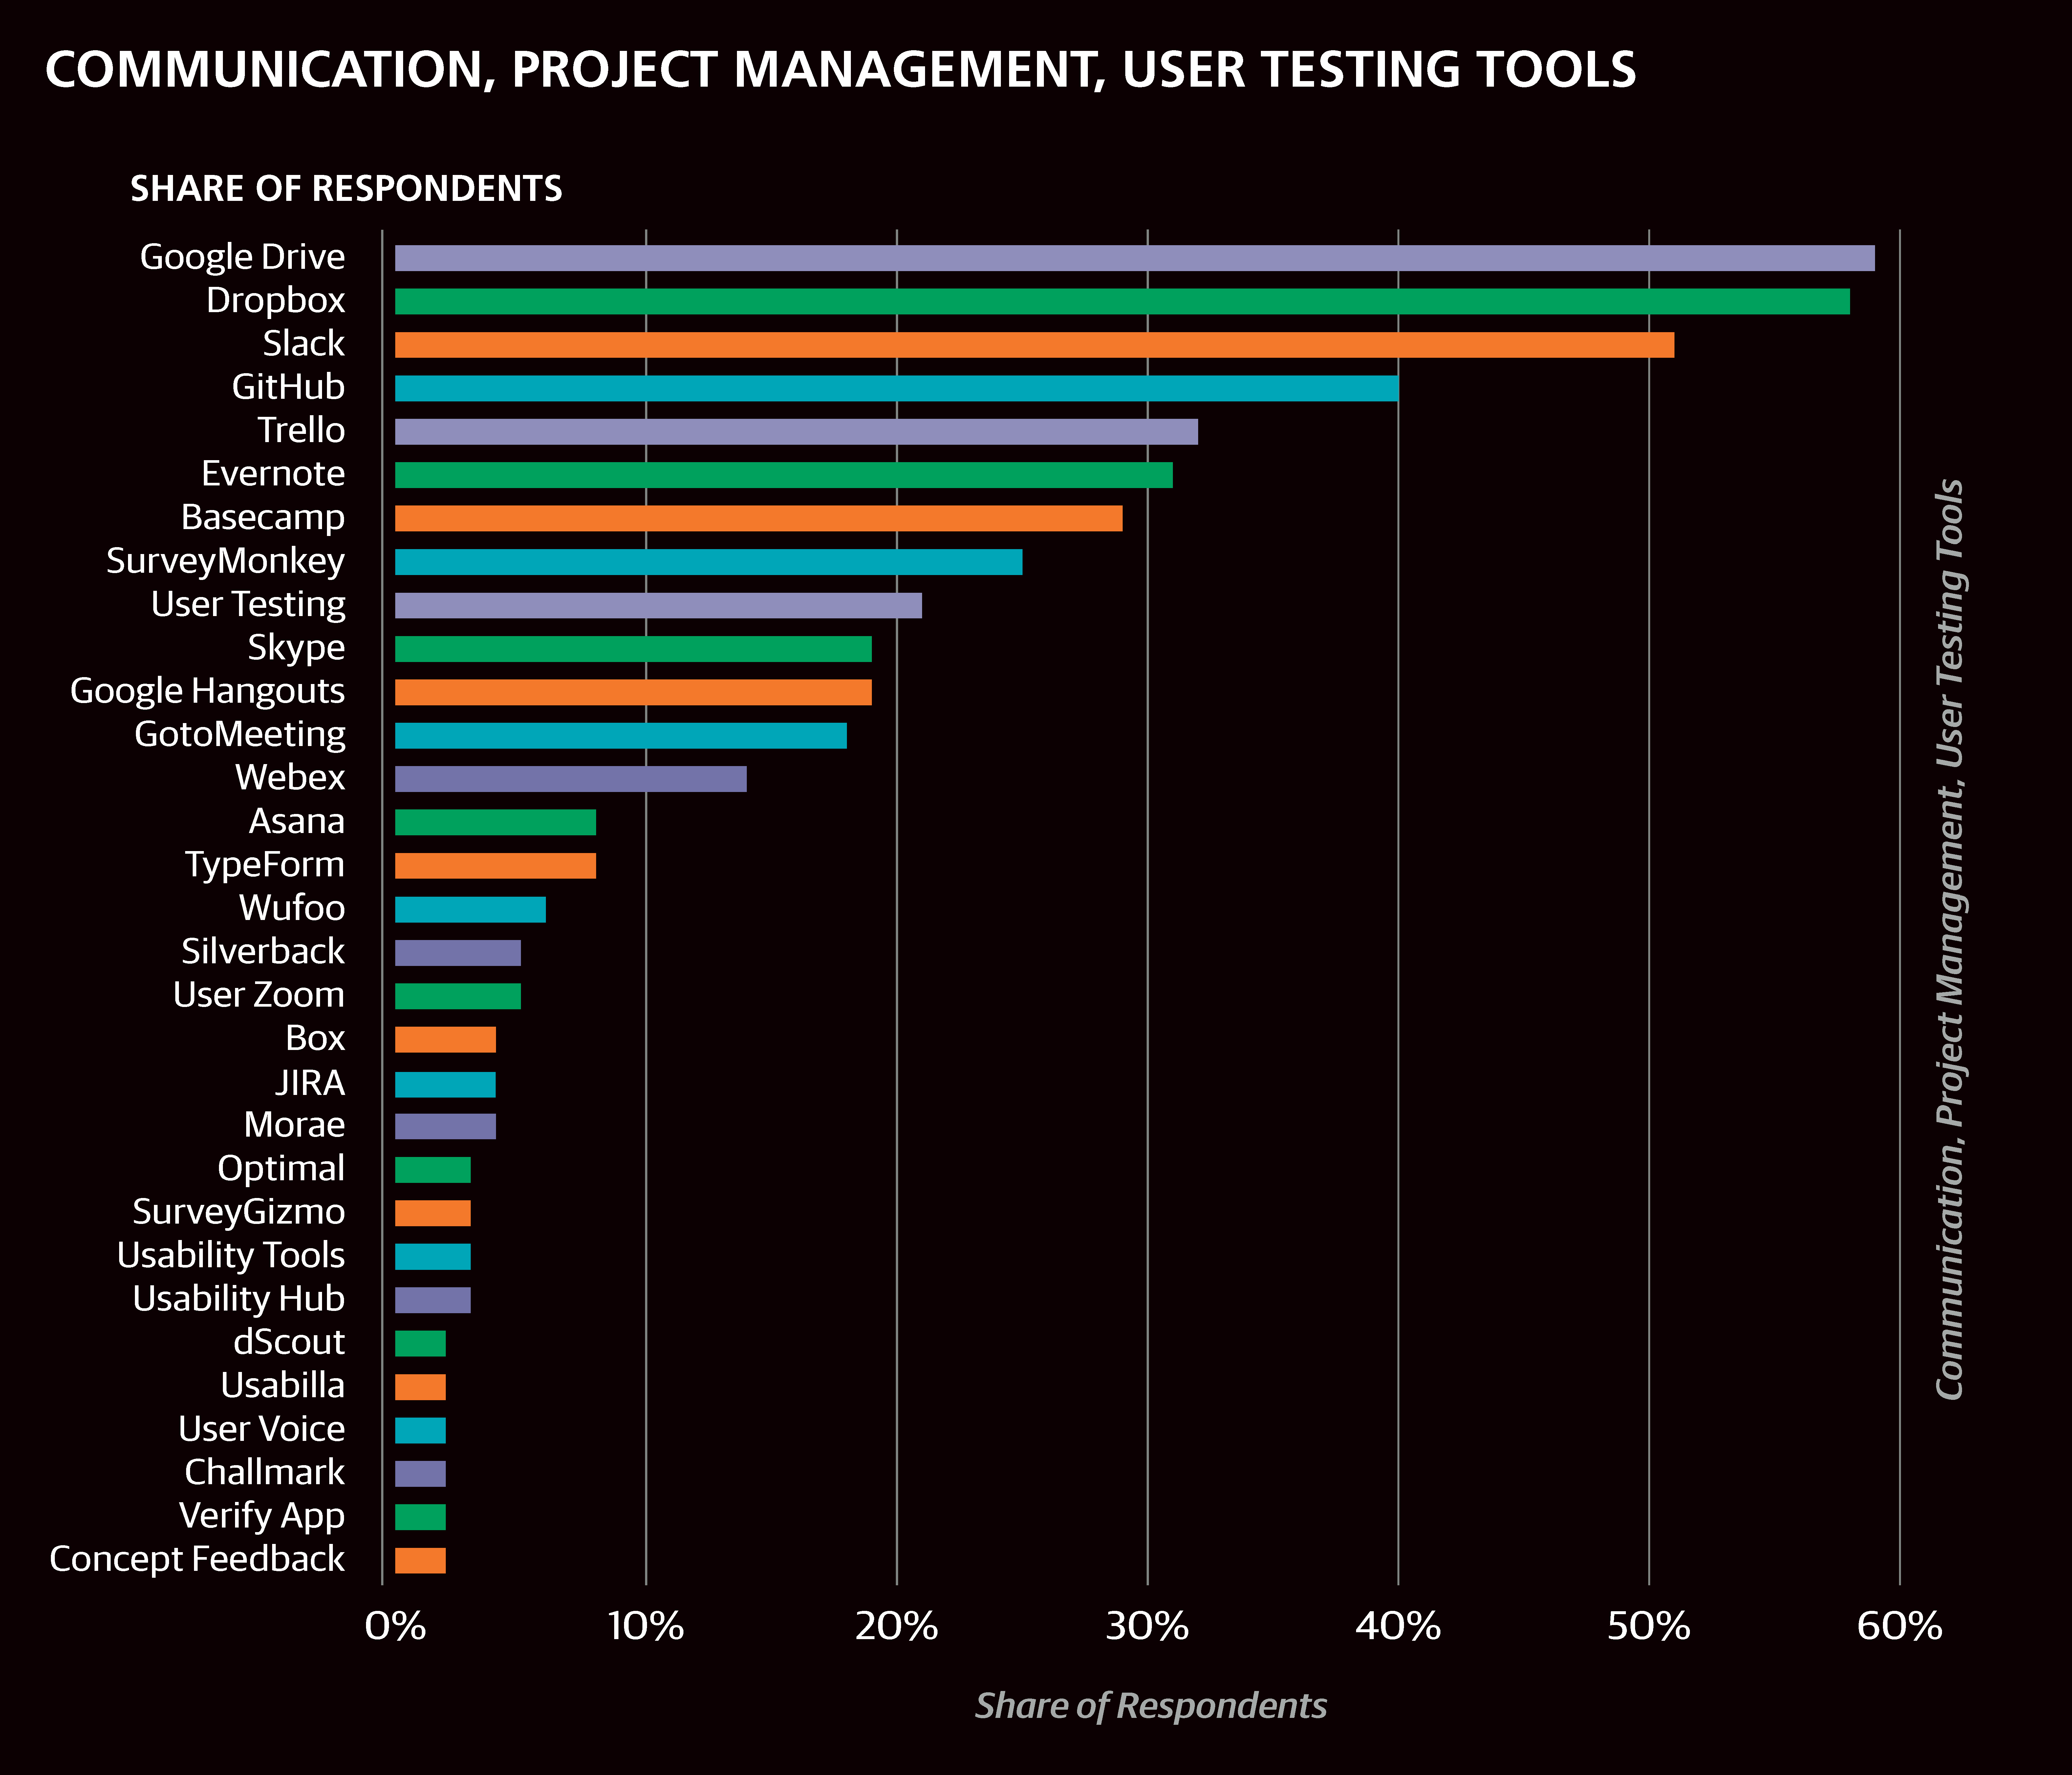
Many of the tools we asked about are for communications, file sharing, or project management. Among the most common are Google Drive (59%), Dropbox (58%), Slack (51%), GitHub (40%), Trello (32%), Evernote (32%), and Basecamp (29%). Of these tools, Slack, GitHub, and Evernote were notable for the higher salaries of their users: the median salary of respondents who used at least one of these tools (69% of the sample) was $100K, $108K for those who used all three (12%), and only $76K for those who did not use any (32%).
Aside from operating systems and communications tools, the most commonly used tool in the sample was pen and paper (with 61% of the sample), followed by Google Analytics (57%) and HTML/CSS (53%). It is perhaps a little surprising that the top non-OS software used among designers is for analytics— remember that analytics was the task with fewest respondents reporting major involvement—but this might be because there is less in-depth attention to or focus on analytics that would lead to greater tool specialization or experimentation. Or else, Google Analytics just works very well for designers.
We found respondents using three dominant tools: Adobe Illustrator (43%), Bohemian Coding’s Sketch (40%), and InVision (38%). Most Sketch users, 63%, also use InVision. The latter two positively correlated: 63% of respondents who used Sketch also used InVision, while only 24% of respondents who did not use Sketch did use InVision. There was no significant correlation between either of these two and Illustrator: someone who used one was no more or less likely to use the other. However, if we consider only those with “UX,” “UI,” “UI/UX,” “Designer,” or “Graphic Designer” job titles, Sketch and Illustrator negatively correlate; that is, most UX designers tend to use one but not both (the change is caused by the large share of non-UX designers who use neither). The same is true for InVision and Illustrator. An even clearer division emerges when we start to look at how these three correlate with other tools.
Aside from InVision, design/analytics tools that correlated with Sketch—more precisely, tools that were used by a significantly greater share of respondents who used Sketch than those who did not—included Google Analytics, Keynote, Optimizely, Mixpanel/Kissmetrics, Pixate, Marvel, Framer, Flinto, Proto.io, and Tableau (among others). Most of these tools also correlated with InVision (but not quite as strongly as with Sketch), and the few that also correlated with Illustrator— Keynote, Flinto, and Proto.io—did so to a much lesser degree. In fact, in the network of usage correlation between all tools, Sketch becomes the most dominant “hub”: many tools correlate with it (chief among them InVision), and for many tools, it is the best-correlated (or most well-connected) neighbor. Among tools outside of the design/analytics category, Slack correlated highly with Sketch (as well as with InVision and other associated tools listed above).
In contrast, the only design tools that gravitated to Illustrator are two other Adobe products, InDesign and After Effects: this is a vendor-based stack silo. More generally, respondents in this stack tended to use fewer tools: the average number of tools (of any type) used by respondents who use Illustrator (but not Sketch) was 12, while for those who use Sketch (but not Illustrator), the average number of tools used was 16. When we identify tool stack silos like this, there is always a degree of uncertainty in the interpretation of why it arose without further study: for example, it could arise because there are compatibility issues, or because those who use this stack don’t need other tools (all their use cases are satisfied since the tools are effectively generalized). As usual, we should note that there is a difference in salaries between the two groups: users of Illustrator had a median salary of $87K; users of Sketch had a median salary of $101K; and users of InVision had a median salary of $96K.
The final group of tools on the survey were programming languages. JavaScript was by far the most popular language (35%, median salary $95K), followed by Python (8%, $90K), Ruby (6%, $98K), Java (6%, $88K), and Swift (4%, $85K). There were no major correlations between particular programming languages and design tools; if we include programming languages in the clustering schema above, they would just form their own cluster. Swift has a stronger connection with iOS, as we would expect, but with Android as well, indicating that the extent to which these two major mobile platforms require specialization among mobile designers is limited.