Useful Formula and the Productivity Dashboard
Days Worked—Formula 10 Prime Working Days Formula PWD
In nearly all calculations about work, you will need this calculation sooner or later (Figure 9.1). How many days do people work in your organization? Standard reply 365, but it is not true. How many days do your HR work? The calculation will vary from company to company; an acknowledged average is 226 days a year. When you use the following formula, you will need to adjust the figures for an exact fit for your company.
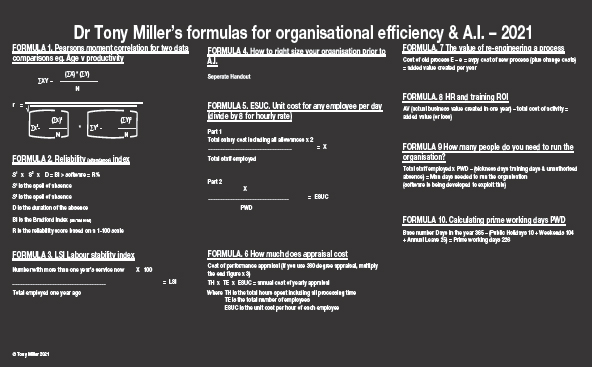
Figure 9.1 Formula
Days in the year 365 − (Holidays 25 + Public Holidays 10 + Weekends 104) = 226 PWD
The figure of 226 becomes the number of days for productivity calculations, business expansion, or contraction calculations and the basis for calculating the employee standard unit cost (ESUC).
You will use this for rightsizing mainly before doing any implementation of AI.
What Is the ESUC for Days Worked? Formula 5
The ESUC is the basis of all calculations for efficiency, production costs, and efficiency savings. This is one very emotive figure; once you understand how it is calculated, then run it past the finance director to get the figure approved—remember, this is a rough unit cost, it is an average—not an exact figure. It is good enough for us to do a range of calculations and predictions.
A Worked Example of Formula 5
There is a company that employs 3,000 people with a total salary bill that includes pay, overtime, car allowance, housing allowance, and all allowances, including medical and any tax contributions. In this example, it amounts to £125,280,000.00.
You will see on the calculation that the total salary costs are multiplied by 2. With the advent of homeworking this may drop to 1.5. Two is the real expenses we can attribute to every employee training, electricity, facilities, IT, floor space, company vehicles, and so on.
If you have lots of spare time, you can work this out by looking at the annual accounts (private sector only), but for simplicity, we use 2 as the factor. There are a few companies where the factor would be higher, such as in Google, Apple, Facebook, and so on.
Remember, you are not the company’s mathematics department—you need working standard figures.
We then divide the top-line total by the number of employees, which gives us X.
X is then divided by 226 (PWD) to give you the ESUC per day, which is the actual cost of each employee in the organization.
Understanding these two formulas 5 and 12 enables you to take a hard look at what people do in the time they are available for work.
I have heard few comments on calculating the PWD, but the ESUC always seems very controversial. Often the comment from CFOs is that it is not the way we do it—my reply is always the same to this statement—“Well please show me the formula you use”—of course, there is not one. In any organization with big change programs and AI is no exception, cost–benefit and market advantage will be to of the agenda. I suspect with AI it will be so fierce that just surviving might be a strategy.
How Much Does Appraisal Cost—Formula 6
Performance appraisal is one of the most costly, time-intensive, and disliked processes inflicted upon by employees by HR. Ask HR how much this process costs—don’t hold your breath while waiting for the reply. The fact is that a properly run performance appraisal is essential particularly for workforce planners. It gives us two of our three critical pieces of management information—competency scores and performance scores. So, like it or hate it, we need it.
The cost of a performance appraisal for a regular (not 360) appraisal is
TH × TE × ESUC = annual cost of the yearly appraisal,
where TH is the total hours spent including all processing time and TE is the total number of employees.
ESUC is the unit cost per hour of each employee.
So, let’s examine the cost of an appraisal for a company employing 5,000 people with an average employee unit cost of £46 per hour.
For each appraisal: |
|
Appraiser’s time preparing 0.5 hour × £46 |
£23.00 |
Appraisee’s time preparing 0.5 hour × £46 |
£23.00 |
£46.00 |
|
Appraisal time of appraisee 1 hour × £46 |
£46.00 |
After the appraisal—completing documentation appraiser 0.5 hour × £46 |
£23.00 |
After the appraisal—talking and reflecting on the process 0.5 hour × £46 |
£23.00 |
HR processing time for each appraisal 0.5 hour × £46 |
£23.00 |
Subtotal |
£207.00 |
3,000 employees × £207 |
£621,000.00 |
Also, it would be fair to add the cost of misdirected training identified from appraisal. This could be as high as 70 percent of the training budget, the cost of which would need to be added to the calculation. In our example, we have a cost to the business of £621,000.00—to get just a simple return on investment, we need to get every year £621,000.00 of measurable bottom-line benefits. Can your appraisal system deliver this type of performance?
If you go beyond return on investment to seek added value, then it would be reasonable to expect to see a 20-percent added value every year. In other words, every year the system is in place we should expect to see minimum measurable benefits of £745,200.00. Can your system deliver this type of business performance?
Performance appraisal is a pivotal platform for our AI activities, providing you are not using the 360-degree appraisal. Then, the transition should be relatively smooth.
HR and Training ROI Formula 8
Added value (actual business value created in 1 year) − total cost of activity = Added value (or loss).
This is a straightforward formula used to measure added value. It is particularly relevant to workforce planners in the New Workforce planning arena as the value created is so high that it would be the basis for making the department a profit center in its own right.
A very recent example would be the BMW.
Value created 7 percent improvement in productivity + reduction in sickness − the process costs €50,000 = ROI added value
How Many People Do You Need to Run the Organization? Formula 9
The question most often asked by CEOs and CFOs is how many people do we need to run the organization?
The question then that needs to be asked is “Is all of the planned work being completed?” The answer most of the time is a somewhat reluctant one—but it is yes in most cases. If that is so, then certain assumptions can be made and the following formula can be deployed to get a gauge of the right size needed for the organization.
Total staff employed × PWD − (training days and Reliability total days) = Man days needed to run the organization
The result is one of fact—that is, how many person-days were needed. There is no suggestion that people cannot be genuinely off from work when they are authorized as sick or that all training should stop, but the figure gives you a baseline to work from.
In the Western world, during 2011 and 2012, in many organizations, right-sized reductions of 20 percent have had little, if any detrimental, effect on the functioning of organizations.
A full-worked end-to-end example is shown in Chapter 3 (see Section How to Calculate the Rightsize of Any Organization).
There are lots of missing formulas—most don’t work, many others have just been replaced with appropriate software packages. One of my favorite tools as a consultant is the one devised by the late Dr Michael Hammer—FACE.
Is the tool Fast, is it Accurate, is it Cheap to use, is it Easy to use? This FACE is an advantageous concept to keep in mind when being part of the New Workforce Planning. Focus on matters that will make a difference to organizational efficiency—get the big picture—keep focus at the strategic level—that is where the significant gains are made.
Background to the Dashboard Concept
The productivity dashboard is a significant leap for HR and is far more in tune with what is done to produce real organizational results. The first move in this measurement many years ago was the key performance indicators. They were a good start—but just like competencies, the process rapidly got overcomplicated as various consultancy companies sought to sell the system—warts and all. Key performance indicators can, if one is not careful, work against the total benefit to the organization.
The Three Productivity Indicators
In the previous chapters, we have discussed Competency, Performance, and Reliability and know that we can measure all three (Figure 9.2). One of the great strengths of the performance dashboard is that it is put on display in each department, so you can see at a glance how you are performing throughout the year against the target scores or presets.
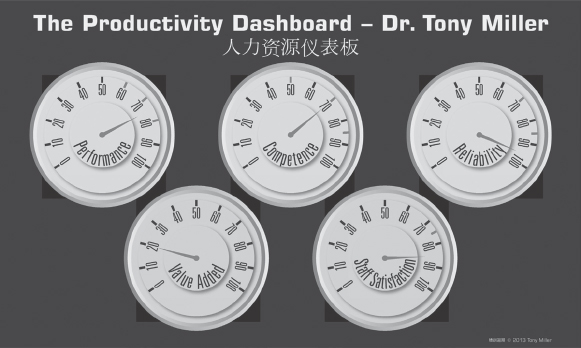
Figure 9.2 Productivity dashboard
Staff Satisfaction
To recap:
Competency gives the organization quality, safety, and conformance to standards.
Performance gives volume, speed, output, low processing cost, and agility.
Reliability gives attendance, value, minimum headcount, and dependability through stability.
These three measures give us that all-important productivity.
There is much evidence that shows that high levels of staff satisfaction reflect in low turnover, and often but not always, higher productivity. Measuring staff satisfaction is, therefore, a critical factor in our dashboard.
A word of caution here—be careful not to be overzealous and overdo things; Doing a survey once a year should be ample, less, if you are in a period of rapid change as with AI. Most organizations prefer to design their own surveys, so make sure you are satisfied that they will give you the evidence that you need and that the results are available on a 1-to-100 score as previously discussed. If you want to buy a ready-made solution, you could use one of the more generic products such as the SHL companies product “corporate culture lite”.
Once the survey has been completed over some years, you could start doing correlations with its results and see how they relate to the three productivity drivers, Competency, Performance, and Reliability. It is unlikely that Workforce Planning will be involved in doing the surveys, but the scored results are a critical part of our data collection needed for various correlation exercises.
Added Value—Formula 8
What is added value? It is the value you can demonstrate above the total cost. We use Formula 8 HR and training ROI.
AV (actual business value created in 1 year) − total cost of activity = added value (or loss).
Workforce Planning is the most ideal department for adding value to an organization, thereby turning it into a profit center; this department should be closely followed, we hope, by the HR department.
The value is measured in 1 year so that it is directly linked to most organizations’ budgetary cycle.
The role of HR has to change because of two major developments, the changing quality of people and a growing need to measure human capital and to develop that capital into a measurable strategic business advantage. People are continually improving; we now have higher education standards, greater literacy levels, and a high level of competence with work-related IT. All this makes today’s employee vastly superior to an employee at any other time in history. Today’s employee, therefore, needs less management control and less process control to work effectively. Given this backdrop, it is essential that the role of HR changes in all its facets to reflect the modern-day environment.
Businesses now want an HR department that can add value, rather than adding substantial costs. The department, in other words, must be a profit center. Logically, if AI HR is a major player in all things related to our most significant cost and asset—people—how could it possibly be a cost center?
The Dashboard chart shown Figure 9.2 sets out to fix the standard for the current financial year. In the example on the chart, we have the added value target preset at 20 percent. If this preset was for the entire HR function, then the added value it would need to show would be a contribution in one financial year that was 20 percent over total cost. It is up to you to decide at what level you set the bar, start off at a manageable figure, say 5 percent, and move upward as you gain confidence and success.
In HR functions, workforce planning would be an excellent first choice to be moved to added value results. If you had involved yourself intimately with the AI plan, your ROI should be massive.
Process Maps—Business Processes
At some point of time when you are looking at AI, it will be necessary to do some business process mapping. AI gives us the unique opportunity to do things completely different. So, it is not about tinkering with what we have got, it is a rethink of the complete process or even the abolishing of the process.
Looking at business processes from a re-engineering point of view gives us the opportunity to go back to a clean sheet of paper with no preconceived ideas or limitations. Hammer described this process as a dramatic and radical redesign approach to a process. To do a business process map is not difficult. Organizations have spent millions with consultants getting them to do a job that they could quickly do themselves. As this will be one of the tools you will need to use at some point of time, it is included in this book, not in any great detail, but enough for you to grasp the concepts and do it yourself (Miller 2017c).
A business process map of an existing process is merely a snapshot in time. It is a visual representation of how the process works, not how you would like it to be. This process is usually mapped out onto paper; you can use Microsoft Visio software which is straightforward to use and may be better for AI; my advice is it is always better to work on paper, nearly all the professionals do as its much easier to correct and adjust. Also, you can see the complete picture of the process. This is particularly important when you are going to use AI as you need to be very clear about what the inputs are and what outputs you desire. The symbols and map are drawn onto a swimlane chart (Figure 9.3), each lane representing a function, not a person. This is the perfect time to make sure you have your processes mapped and where you can take advantage of improvements before making the switch to AI (Bandey 2018). However, don’t believe that a half way house is the end of the road, the aim needs to be full AI.
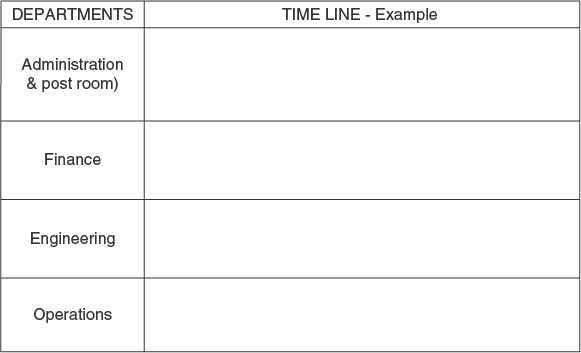
Figure 9.3 Swimlane
Remember, once you have your process map, what you are looking for AI to do is to radically redesign or scrap the process. Don’t start looking for small incremental improvements that are not what AI has to offer. I mention this because only too often I see organizations producing process maps and trying to impress upon management by saying we have achieved a 5 or 10 percent improvement in the process, where if they had redesigned, they would have got 30 or 40 percent.
In this brief illustration, the key points are symbols that represent stages in the process (Figure 9.4). Moreover, once the process is understood, it is mapped onto a chart so you can see the entire process as it has happened.
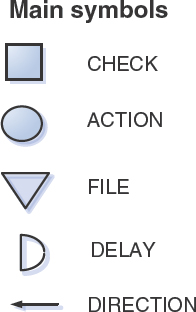
Figure 9.4 The symbols
In the example, we follow a simple job of distributing post in a large office. This process is viewed once or twice, timings and numbers are taken, and then the process of mapping it starts, so we have a process map which we have created. When doing this, you need to be careful that workers do not start working at a superfast rate or missing lunch or tea breaks to impress you. What you are trying to capture is the truth as it happens. So, if you have employees who generally stop for a cigarette break, official or unofficial, it needs to be recorded. We are looking to capture elapsed time. So, if the process does not finish at the end of the day, then the elapsed time would be from the end of one day until its finalization on another day. Once you have practiced this a few times, you will find it very straightforward to do.
The symbols we use are as follows:
The example we are using is a real company, the details of which are shown herewith:
Postal delivery process—M. Co. America
Post received 7.30 am in the post room

Figure 9.5 The completed process map
Post opened approximately 250 items per day.
Two people are involved in this operation which takes 30 minutes.
All incoming items are recorded in a book—the book records the person who sent the correspondence, the company, the topic, and to whom it has been assigned. One person does this task, and it takes 1½ hours to complete.
Items that are difficult to handle are sent to a senior manager in Administration who will do the allocation. This can take some time. But if there is undue delay, the item is usually put back into the system the next day for recording and then delivery.
When the post delivery clerk arrives, he sorts the mails, loads the post trolley, and commences the delivery of the mail. Sorting and loading takes ½ hour.
Delivery of the mail by the Post Delivery Clerk to the Four offices as shown on the swimlane diagram figure 9.3. The time taken for pushing the trolley from one department to the other is normally 12 minutes. Each item received is signed for 5 seconds taken per item. When the post clerk returns to the post room, someone later in the day checks the book to ensure that all items of post have been signed and accounted for. If there are items for which the recipient has not signed, then the item is written in the book for delivery the next day. The postal clerk also prepares a handwritten note explaining when the item was received and when it was attempted to be delivered.
Don’t forget—the post room staff work 8 hours a day. They will have a 1-hour lunch break and tea/coffee breaks (15 minutes) (Figure 9.5). This process has been in operation for 10 years, with everyone expressing satisfaction.