Appendix B. Tools for debugging Ajax applications
This appendix gives you a tour of some of the tools most frequently used by Ajax developers. It explains how to install web tools like Firebug and Web Development Helper and provides an overview of their main features. A section is also dedicated to Fiddler, a tool for debugging HTTP traffic. Finally, the last section explains how to debug script files using the Visual Studio debugger and the Script Explorer window.
B.1. Using Firebug for Firefox
Firebug is a web tool shipped as an add-on to the Firefox browser. It can monitor HTTP traffic, inspect the DOM of a page, and debug JavaScript code. When run in the browser, Firebug lets you change the look and behavior of a web page in real time.
You can install Firebug from the official website at http://www.getfirebug.com, which also contains an online guide to the features provided by this web tool. Figure B.1 shows the Firebug homepage. Let’s examine the installation procedure for Firebug before diving into a tour of its features.
Figure B.1. The homepage of the Firebug add-on for Firefox

B.1.1. Installing Firebug
Installing Firebug is straightforward. On the homepage, click the Install icon located at upper right. Firefox prompts you for the permissions to perform the installation and then restarts the browser, as shown in figure B.2.
Figure B.2. Firefox prompts you before installing the Firebug add-on.

Once the browser has restarted, you access Firebug by clicking the little green icon on the status bar at the bottom of the browser. You can also open and close the tool by pressing the F12 key and selecting View > Firebug in the Firefox menu bar. Doing so opens the Firebug’s console shown in figure B.3.
Figure B.3. The Firebug tool up and running in Firefox

Let’s do a general overview of the features available in Firebug, starting from the logging console.
B.1.2. Quick Overview of Firebug
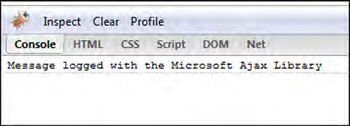
Clicking the Console tab switches to the console window, where messages are logged. As we explained in chapter 2, the Microsoft Ajax Library lets you send messages to the browser’s console by calling the Sys.Debug.trace method anywhere in the application’s code, passing a string with the message to display as an argument. Figure B.4 shows a message logged in Firebug’s console using Sys.Debug.trace.
Figure B.4. The Console window displays the messages logged to the browser’s console
Selecting the HTML tab switches to a tree-view of the HTML elements of the browsed page, as shown in figure B.5.
Figure B.5. Firebug lets you inspect the entire DOM tree of a web page.
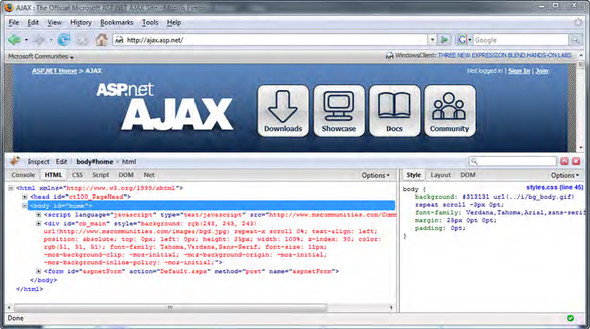
In the left window, you can expand or collapse each node of the DOM tree, relative to a particular HTML tag in the page, and inspect the entire markup code of the page. For each node, the right window lets you inspect the element’s style, the layout properties (displayed using with the box-model view shown in figure B.5), and all the properties of the corresponding DOM object.
The CSS view lets you explore the style-sheets loaded by the browser. You can choose one from the drop-down list located above the CSS tab, as shown in figure B.6.
Figure B.6. The CSS tab lets you inspect the CSS files loaded by the browser.

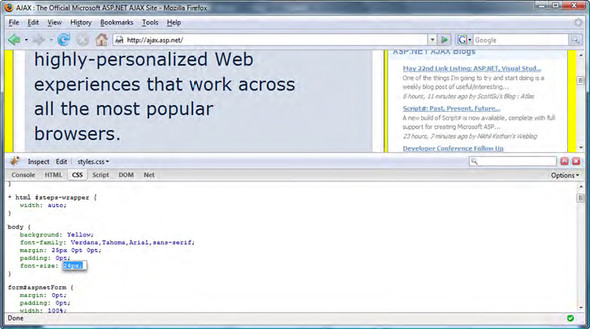
Interestingly, you can modify the style of a page in real time. If you click a CSS selector in the CSS view, you can edit its properties and add new ones. As soon as you modify a selector, the changes are reflected on the page. For example, in figure B.7, we’ve modified the background color of the page and changed the font size of the body element by adding a font-size property.
Figure B.7. With Firebug, you can modify the CSS of a web page and see the results in real time.
The Script tab opens one of the most interesting windows. In the Script window, you can inspect the script files loaded by the browser and debug them by setting breakpoints. Figure B.8 shows the Script view, which is split into two windows.
Figure B.8. The Script window lets you inspect and debug script files.

The left window shows the code for one of the JavaScript files requested by the browser during the page load. The right window is the Watch window, which lets you monitor client variables.
You can select script files from the drop-down list located above the Script tab. To debug a JavaScript file, you set a breakpoint by clicking the left zone near the line numbers. You can use the Watch window on the right to examine the values of all the variables and references in the current statement. In addition, you can step into the code, add new watch expressions, and examine all the breakpoints by clicking the Breakpoints tab.
Next, in the DOM tab, you can inspect the page’s entire DOM tree. In the same way that the HTML window offers a tree view of the markup code, the DOM window offers a tree view of the DOM objects. This means you can access every element in the page as well as all the JavaScript objects created by your client code. Just as you did in the CSS window, you can change the values of client objects’ properties at runtime and immediately see the results. Figure B.9 shows the DOM window.
Figure B.9. The DOM window lets you inspect client objects and modify their properties in real time.

Finally, you can select the Net window to debug HTTP traffic. The window reports all the requests made to the web server—either synchronous or asynchronous—with the corresponding round-trip time. By expanding the node relative to a particular request, you can inspect the HTTP request and response and their headers and payload, as shown in figure B.10. HTTP requests can also be filtered based on categories. The top toolbar lists all the available categories: HTML, CSS, JS, XHR, Images, and Flash.
Figure B.10. You can use the Net window to debug HTTP traffic.

Firebug is a premium tool for debugging applications from the Firefox browser. Next, let’s examine a similar tool for Internet Explorer: Web Development Helper.
B.2. Using Web Development Helper
In this section, we’ll examine a powerful tool called Web Development Helper. Provided as a browser extension (also referred to as a browser helper object) for IE, Web Development Helper is useful in JavaScript, Ajax, and ASP.NET development. Features of the tool include HTTP tracing capabilities; an in-process script debugger; and the ability to view items like ViewState, trace messages, and cache information, all from within the browser. Web Development Helper also gives you the ability to view HTTP traffic between the browser and server, get a live snapshot of the DOM, and inspect script errors from an immediate window.
The richness of this tool and its awareness of ASP.NET AJAX make it a must-have for ASP.NET developers. Let’s get started by looking at how you can download and install this valuable tool.
B.2.1. Installing Web Development Helper
Web Development Helper was created by Nikhil Kothari, an architect on the Web Platform and Tools team at Microsoft. You can find releases, documentation, links, and other relevant information about the tool at http://projects.nikhilk.net/Projects/WebDevHelper.aspx. Requirements include the Microsoft .NET 2.0 framework and Internet Explorer 6 and above.
Installation is clear-cut and simple. After downloading and uncompressing the zip file, launch the utility by running the WebDevHelper.msi application. You’ll be prompted with a license agreement and a few quick steps through a wizard, and then the tool is installed and ready for use.
B.2.2. Launching Web Developer Helper
You can activate Web Development Helper several ways. A common approach is to select it from the Tools menu in the IE menu bar. You can also invoke it from the command bar in IE by clicking its dedicated icon or selecting it from the Tools menu. Once launched, it appears as an explorer bar at the bottom of the browser (see figure B.11).
Figure B.11. Web Development Helper appears as an explorer bar at the bottom of the browser.
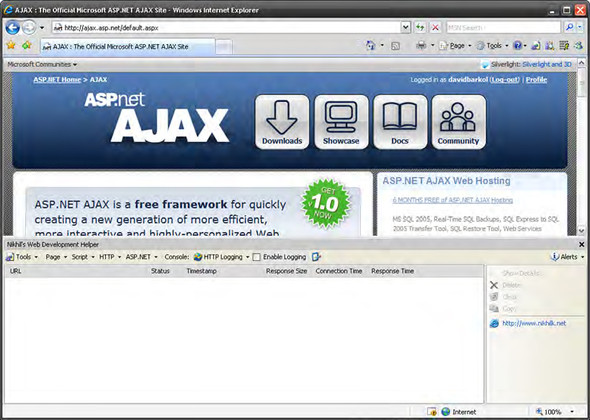
For clarity, commands in the tool are separated according to their logical feature areas: Page, Script, HTTP, and ASP.NET. For instance, commands for HTTP include the ability to enable HTTP logging for inspection of traffic. Some of the ASP.NET features include examining the ViewState, trace information, and cache.
B.2.3. Inspecting HTTP traffic
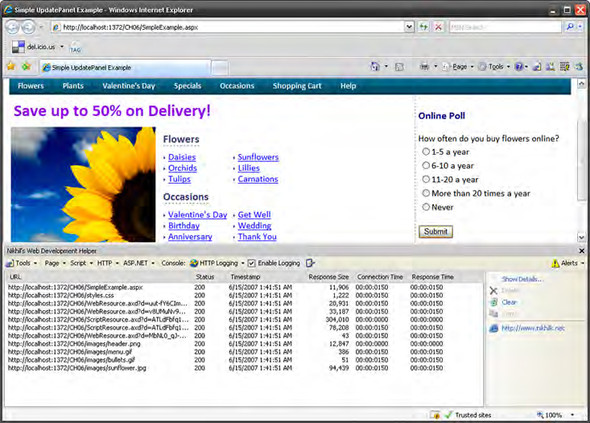
You configure Web Development Helper for HTTP logging by selecting HTTP Logging from the drop-down list in the command bar and selecting the Enable Logging check box. The next time an HTTP request is executed, information about the request and its response from the server are appended into a log window. Figure B.12 shows the initial captured requests from a sample application in chapter 5.
Figure B.12. Captured HTTP requests made from the browser to the server when the page is initially loaded
You can view additional details about a single request by double-clicking an item in the list. Figure B.13 shows the details of a request made after the Submit button on the form has been clicked.
Figure B.13. The HTTP Log Viewer splits information about an HTTP transaction into two windows: request information and response information.
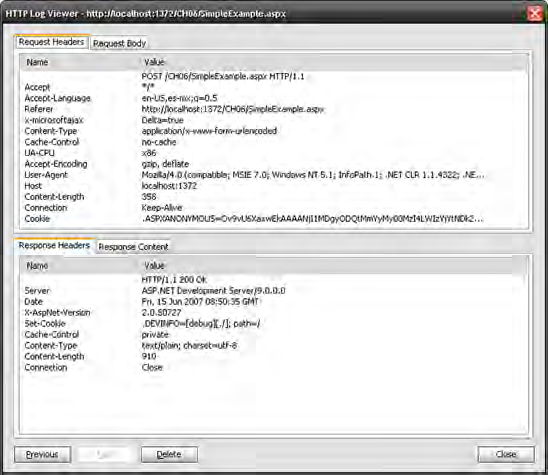
Details about a request are divided into two sections. The top section displays the request header and body information from the transaction. The bottom section details the response payload from the server by providing header and content data, respectively. Selecting the Response Content tab provides UpdatePanel-related information about the response from the server. Figure B.14 shows some of the ASP.NET AJAX postback-aware data.
Figure B.14. Web Development Helper offers UpdatePanel-sensitive data on the Response Content tab.

B.2.4. Script debugging and tracing
To date, the best debugging experience for JavaScript is available in Visual Studio, which we’ll cover later in this appendix. Web Development Helper offers some in-place debugging support that can be helpful as well. To enable script debugging select Script Console from the command bar, and select the Enable Debugging check box. (You don’t need to select the check box if all you want to do is view trace messages.)
When you select the Script Console option, the bottom portion of the tool divides into three windows, shown in figure B.15.
Figure B.15. The Script Console divides Web Development Helper into three useful windows: output messages (messages log), immediate window, and commands.

The first window in the console is dedicated to displaying output information such as trace and debug messages. The middle window acts as an immediate window that you can use to execute client script on the fly; with this feature, you can manipulate client-side variables and execute logic at runtime. The last window contains links to shortcuts and commands in the tool, such as clearing the messages log or executing code from the immediate window. To output a trace message, call the trace function in the Sys.Debug object:
Sys.Debug.trace("This is a trace message.");
Another feature of the script console is rich error reporting. By default, when an error is detected, you see a dialog containing helpful information that includes the location and callstack of the exception, as shown in figure B.16.
Figure B.16. Web Development Helper offers rich error reporting that includes location and callstack information.
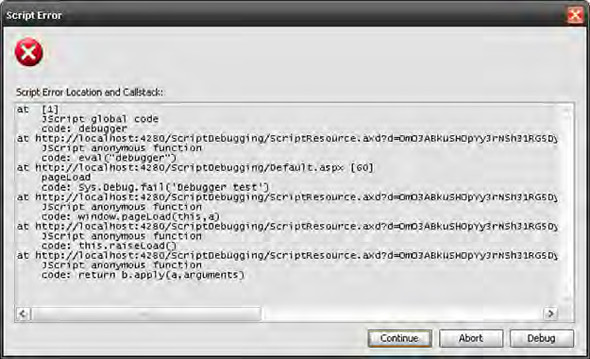
In the Script Error dialog box, you can examine the steps that led to the exception and try to determine its cause. Settings for the error dialog and other features in the tool are available on the Tools menu or by clicking the Console Options button in the command bar. (The Console Options button is the last button on the command bar and has no text associated with it.)
B.2.5. Page and ASP.NET diagnostics
Selecting Page > DOM Inspector brings up a window in which you can view the current DOM on the page. Figure B.17 shows the DOM Inspector in use.
Figure B.17. The DOM Inspector lets you navigate the page’s DOM heirarchy.
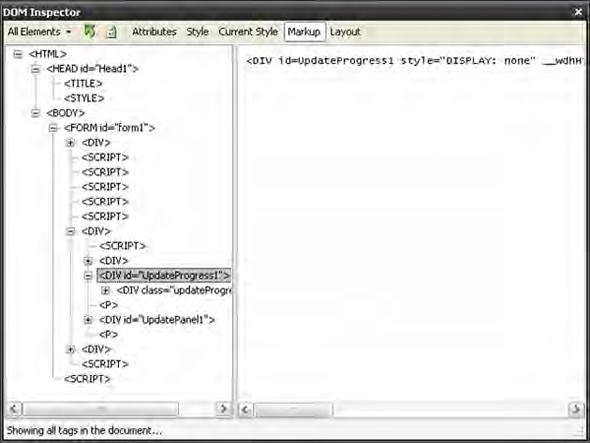
With the DOM Inspector, you can observe the attributes, styles, markup (currently selected), and layout of the page. This tool can be a useful alternative to viewing the source generated by the browser.
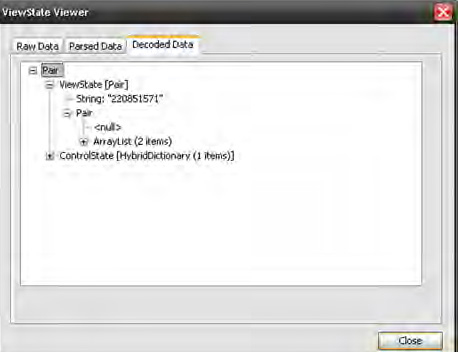
Next up is the ASP.NET menu, which offers options for viewing the ViewState, trace information, and cache used by the current application. When ViewState is selected, the ViewState Viewer window appears. You can use the viewer to navigate between different versions of the data, as shown in figure B.18.
Figure B.18. The ViewState Viewer grants us a number of different options for viewing the ViewState on the page.
Web Development Helper is rich and easy to use. Because of its integration with ASP.NET AJAX and its many features, we highly recommend that you make it part of your toolbox for Ajax and ASP.NET development. Additional documentation is available from the tool’s home page.
B.3. Debugging HTTP with Fiddler
Fiddler is a tool for debugging the HTTP traffic between the browser and the Internet. Unlike Firebug and Web Development Helper, Fiddler is a stand-alone program that can monitor all HTTP traffic. You can download it from the Fiddler homepage, located at http://www.fiddlertool.com. Figure B.19 shows the Fiddler logo that appears as soon as you run the program.
Figure B.19. Logo of the Fiddler tool for HTTP debugging.

Once you launch the executable file, Fiddler begins capturing network packets with HTTP requests and responses. The main window is split into two parts: The left side lists all the captured HTTP requests and responses, and the right side contains the details of the HTTP transaction selected from the list on the left.
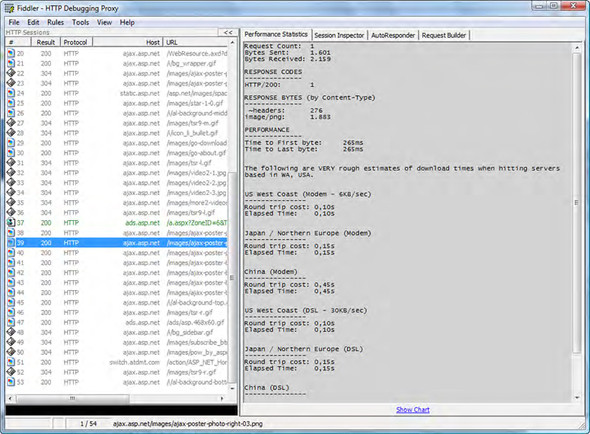
You obtain information and statistics about the captured HTTP traffic by selecting one of the tabs on the toolbar at the top right of the main window. As shown in figure B.20, the first tab reports various statistics about the network-time performance of the selected HTTP request and the associated response.
Figure B.20. The Performance Statistics window provides statistics about network times of the HTTP request selected in the left window.
The Session Inspector tab switches to the details of the selected HTTP request and the associated response. In this window, you can examine the headers as well as the contents of the HTTP messages in various formats. Figure B.21 shows the Session Inspector window.
Figure B.21. In the Session Inspector window, you can examine the contents of the HTTP messages in various formats.

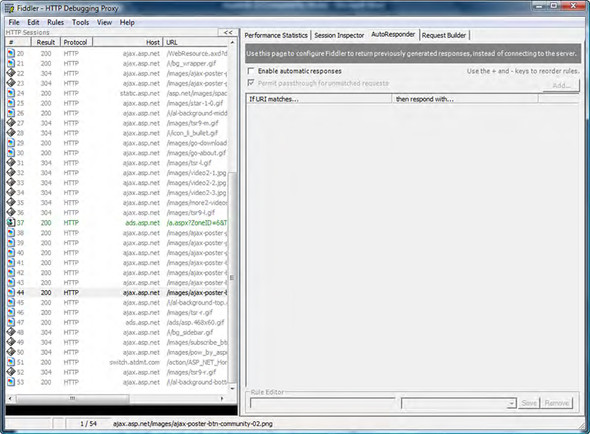
The third tab from the left opens the AutoResponder window, shown in figure B.22, which lets you use a previously received response to respond to requests made to a particular URI. This way, you use a predefined response instead of making a connection to the web server.
Figure B.22. The AutoResponder window lets you configure a predefined response for HTTP requests directed to a specific URL.
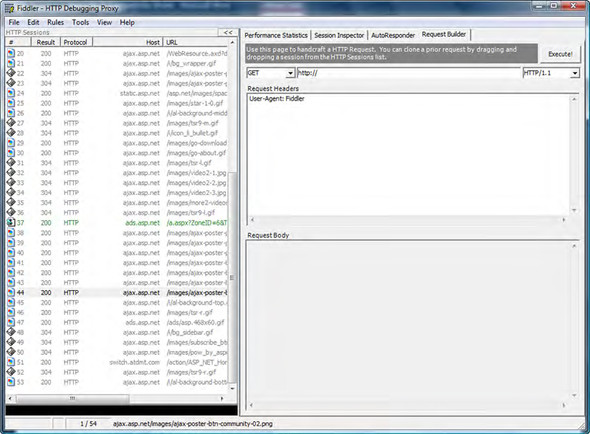
One of the nice features of Fiddler is that it lets you test a network connection by building and sending custom HTTP requests. Figure B.23 shows the Request Builder window, where you can use an editor to build the headers and the payload of a HTTP request and send it to the specified URL. Then, you can monitor the results using the other windows as you do with normal traffic.
Figure B.23. With Fiddler, you can build custom HTTP requests and send them to the specified URL. The editor lets you specify the headers as well as the payload of the custom HTTP request.
The next section will explain how to set up IE and Visual Studio 2005 for debugging JavaScript files.
B.4. Debugging JavaScript in Visual Studio 2005
With Visual Studio 2005, you can debug ASP.NET applications using the integrated debugger. To take advantage of the Visual Studio debugger, ASP.NET applications must run in debug mode. The compilation mode can be set by modifying the web.config file of the website accordingly.
Visual Studio also lets you debug script files loaded by the browser at runtime. First, let’s see how to configure IE for web-page debugging. Then, we’ll explain how to set breakpoints in JavaScript files through the Script Explorer window.
B.4.1. Enabling script debugging in Internet Explorer
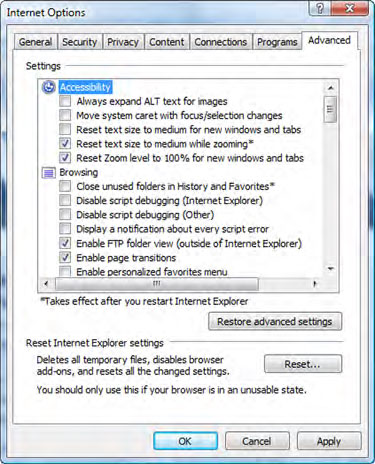
To enable script debugging in IE, open the Internet Options dialog and ensure that the following items are deselected:
Figure B.24 shows the Internet Options dialog in IE 7, but the same settings apply to IE 6.
Figure B.24. To enable debugging with Visual Studio, you have to configure some options in IE.
Once script debugging is enabled in IE, you can set up the Visual Studio environment. Let’s see how this is done.
B.4.2. Setting breakpoints
Normally, the client code loaded in a web page is contained both in script tags in the page as well as in separate files loaded by the browser. Visual Studio 2005 doesn’t permit you to set breakpoints in the JavaScript code contained in an ASPX page. But setting breakpoints in separate script files (for example, JavaScript files with the .js extension) sometimes result in errors being raised by the Visual Studio debugger. Let’s see what you can do to work around these limitations.
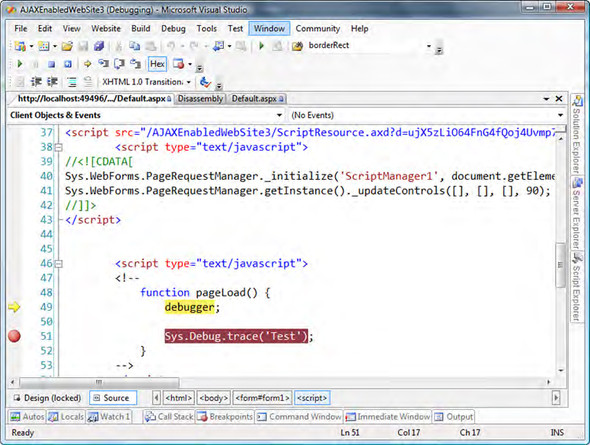
To set breakpoints in the JavaScript code contained in an ASPX page, you must break into the debugger at a specific location in the code. You can do this by adding a statement with the debugger keyword at the specific location:
debugger;
The debugger keyword stops the execution of the program and enters the Visual Studio debugger. In the debugger, a new tab opens with the source code of the page you’re currently browsing. Now, you can set breakpoints in the source code tab. Once you’ve set breakpoints, you need to reload the page in the browser in order to debug it.
Figure B.25 shows the source code tab with the debugger statement added to the pageLoad function. Note that you’re setting breakpoints in the source code tab and not in the original ASPX page, which is the inactive tab in the figure.
Figure B.25. In Visual Studio 2005, you can set breakpoints in an ASP.NET page after invoking the debugger.
Sometimes, when you set breakpoints in JavaScript files, the debugger complains at runtime, saying that “There’s no source code available for this location” and displaying a warning dialog. This happens because script files are loaded dynamically in the page. In such cases, you have to rely on the Script Explorer window to set breakpoints in JavaScript files.
To open the Script Explorer window, choose Debug > Windows > Script Explorer. If you don’t see the Script Explorer menu item, choose Tools > Customize. In the new window, select Debug > Script Explorer. You can also drag the Script Explorer icon to a Visual Studio toolbar to add it automatically. The Script Explorer window lists all the script files loaded in the page you’re debugging. If you double-click a file, the file opens in a new tab, and you can set breakpoints; see figure B.26. Once you set breakpoints, you have to reload the web page in order to debug the code.
Figure B.26. The Script Explorer window lets you set breakpoints in script files loaded in the page.

In addition to using the debugger keyword, there are a couple other ways to break into the Visual Studio debugger.
B.4.3. Other ways to break into the debugger
Another way to enter the Visual Studio debugger is to raise a client exception. You can do this, for example, with the Sys.Debug.fail method provided by the Microsoft Ajax Library, as shown in the following code:
function pageLoad() {
    Sys.Debug.fail('Debugger test');

    Sys.Debug.trace('Test');
}
An alternate approach is Sys.Debug.assert, which takes a condition and a string with a message as arguments:
Sys.Debug.assert(0 > 1, 'Testing Visual Studio Debugger'),
Because the condition is evaluated to false, IE prompts you, asking if you want to enter the debugger, as shown in figure B.27. Clicking OK stops the execution of the client code and enters the Visual Studio debugger.
Figure B.27. Entering the Visual Studio debugger using the Sys.Debug.assert method

Once the Visual Studio debugger is running, you can debug the client code in the same manner that you debug the C# or VB.NET code and take advantage of all the features provided by the Visual Studio debugger.
Note
If you want to know more about the Visual Studio debugger, check the MSDN documentation at http://msdn2.microsoft.com/en-us/library/sc65sadd.aspx.
