
A key performance indicator (KPI) is a performance measurement used in most organizations to evaluate the organization’s success or the success of a particular activity within the organization. Often, KPIs are used to measure the effects of a change project—for instance, implementing a good ALM process—or to evaluate the progress of a development project.
You can use the score from an ALM online assessment as a KPI and compare the assessment scores before and after the implementation of an ALM process improvement. This way, you get an indication of whether you have improved due to implementing a new process.
During projects, you should also be able to use the reports from your ALM toolset to determine whether you’re constantly improving your work. Continuous improvement, in my opinion, is something to strive for. When it comes to project management, you can, for instance, look at the team’s velocity (how fast the team is able to work) and see if it’s growing or decreasing. By using reports and metrics from your ALM tools, you can choose the KPIs you want and learn how to evaluate them.
This chapter looks at metrics for five topics that cover most aspects of software development. Keep in mind that they are not only for agile projects but can be used in many other projects as well:
Project management
Architecture, analysis, and design
Developer practices
Software testing
Release management
Project-Management Metrics
To get good metrics about the status of your projects, it’s important to measure your progress. You can do this in several ways. If you’re using agile as a methodology, many of these metrics and reports should be familiar. To others, they may be new.
Agile Metrics
Let’s look at some important reports that are commonly used in agile practices:
Backlog overview
Sprint burndown
Velocity report
Release burndown
Remaining work
Unplanned work
The backlog overview report lists all user stories, filtered by tags and iteration and in order of importance. Basically this is a list of user stories filtered by the criteria you need. Many people use Excel (or an another spreadsheet application) to create this report, but many ALM tools have built-in support for producing it. Figure 7-1 shows what it will look like in VSTS.
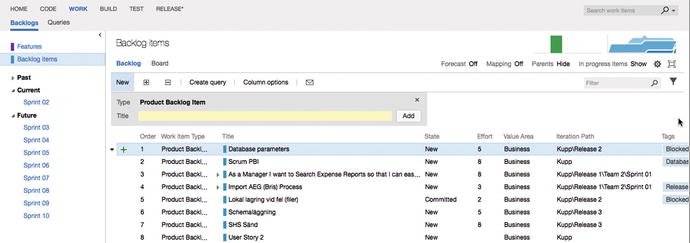
Figure 7-1. The backlog overview in VSTS
I’ve mentioned the sprintburndown chart before (see Figure 7-2). This report shows how much work there is left to do in a sprint. Using it, you can predict when the team will be finished with the work assigned to this sprint, either in the sprint or after the sprint is finished. Based on this information, the team and the product owner (PO) can take actions to make sure they deliver what they have committed to.
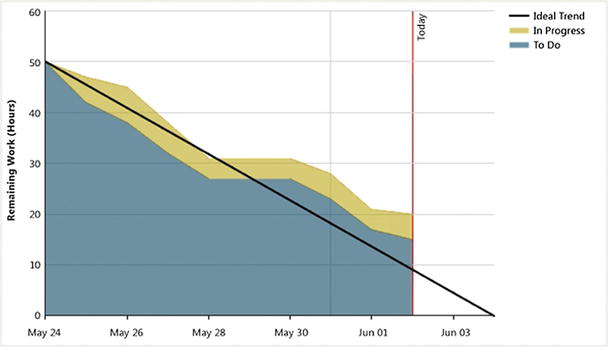
Figure 7-2. Sprint burndown report
The release burndown chart(Figure 7-3) shows the same thing as the sprint burndown, but for the work included in a release.

Figure 7-3. Release burndown report
A burndown and burn rate chart (Figure 7-4) is another way to show a project’s burndown. No surprises here: This is the same information shown in Figure 7-1. The burn rate summarizes the completed and required rate of work for a specified time period. In some tools, you can also see the information for team members. You can sometimes choose to see the report based on hours worked or number of work items.

Figure 7-4. Burndown and burn rate report
Velocity (how much work a team can take on in a sprint) is important, especially for a product owner (PO) planning who is how much work can be accomplished in coming sprints. Velocity is usually a measure of the effect per story point that the team can accomplish.
Before any work is started, the PO calculates a theoretical velocity in order to begin planning. As time goes by, it’s updated with the team’s real velocity based on how much work they deliver in each sprint. This helps the PO estimate how much work the team can take on in coming sprints. The velocity chart(Figure 7-5) can help you easily retrieve this figure. Here you see how much effort the team has delivered for each sprint.
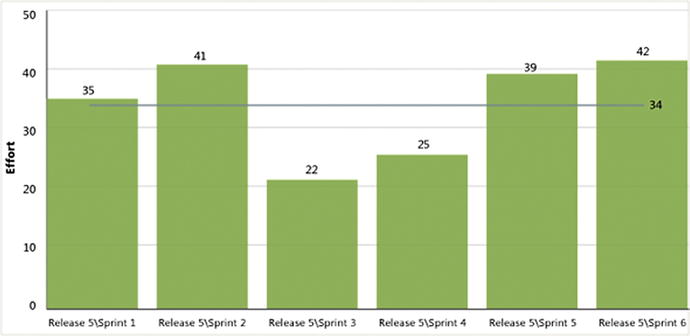
Figure 7-5. Velocity report
Remaining work (Figure 7-6) is another great report. You can use it to track the team’s progress and identify any problems in the flow of work. In some tools, you can view this report in an Hours of Work view or a Number of Work Items view.

Figure 7-6. Remaining work report
The unplanned work report (Figure 7-7) is useful when the team plans an iteration by identifying all work items that they intend to resolve or close during the course of the iteration. Work items assigned to the iteration by the plan completion date of the report are considered planned work. All work items that are added to the iteration after that date are identified as unplanned work.

Figure 7-7. Unplanned work report
Metrics for Architecture, Analysis and Design
ALM tools don’t include many metrics you can use for KPI assessment for architecture, but you can use some taken from the development area. Using the code metrics, you can get information about how your architecture and design are working, including the following:
Lines of code: This is an approximate number based on Intermediate Language (IL) code. A high count may indicate that a type or method is doing too much work and should be split up. This may also be a warning that code will be hard to maintain.
Class coupling: Measures the coupling to unique classes through parameters, local variables, return types, method calls, generic or template instantiations, base classes, interface implementations, fields defined on external types, and attribute decoration. Strive for low coupling; high coupling indicates a design that is difficult to reuse and maintain because of its many interdependencies on other types.
Depth of inheritance: Indicates the number of class definitions that extend to the root of the class hierarchy. The deeper the hierarchy, the more difficult it may be to understand where particular methods and fields are defined and/or redefined.
Cyclomatic complexity: Determined by calculating the number of different code paths in the flow of the program. It indicates the code’s complexity. A high complexity makes maintainability suffer, and it can also be hard to get good code coverage.
Maintainability index: An index value between 0 and 100 that represents the relative ease of maintaining the code. The higher the better: a rating above 60 is good. Below that, maintainability suffers.
Some ALM tools can generate dependency graphs. These graphs are used to visualize code and its relationships. Running analyzers on these graphs can give you useful information as well:
Circular references are nodes that have circular dependencies on one another.
Hubs are nodes that are in the top 25% of highly connected nodes.
Unreferenced nodes have no references from any other nodes.
Using these analyzers, you can see if you have loops or circular dependencies so that you can simplify them or break the cycles. You also can see if you have too many dependencies, which could be a sign that they’re performing too many functions. To make the code easier to maintain, test, change, and perhaps reuse, you need to look into whether you should refactor these code areas to make them more defined. You may also be able to find code that performs similar functionality and merge with it. If the code has no dependencies, you should reconsider keeping it.
Metrics for Developer Practices
Metrics for developer practices are KPIs that can help you understand if you’re successfully working to improve your code. These are useful from both the architectural and design viewpoints as well as from a developer viewpoint. Using them will help you improve how you design your application or system.
Several important metrics are available automatically in many tools and can help you get a good understanding of the quality of your development work:
Code coverage
Code metrics
Compiler warnings
Code analysis warnings
Code Coverage
Code coverage shows you how much of the code has been covered by automated unit tests. You get the value as a percentage of the entire codebase. The difficulty often is deciding what percentage is enough. Should you always strive for 100%, or is 80% enough? This is something the team has to discuss with the PO in Scrum or a similar decision-maker in other processes. This value is input for the Definition of Done (DoD).
Code Metrics
You can look at several different code metrics :
Lines of code is an approximate number based on IL code. A high count may indicate that a type or method is doing too much work and should be split up. This may also be a warning that code will be difficult to maintain.
Class coupling measures coupling to unique classes through parameters, local variables, return types, method calls, generic or template instantiations, base classes, interface implementations, fields defined on external types, and attribute decoration. You should strive for low coupling because high coupling indicates a design that is difficult to reuse and maintain due to of its many interdependencies on other types.
Depth of inheritance indicates the number of class definitions that extend to the root of the class hierarchy. The deeper the hierarchy, the more difficult it may be to understand where particular methods and fields are defined and/or redefined.
Cyclomatic complexity is determined by calculating the number of different code paths in the flow of the program; it shows the complexity of the code. High complexity makes maintainability suffer and can also make it difficult to achieve good code coverage.
The maintainability indexis an index value between 0 and 100 that represents the relative ease of maintaining the code. The higher the better. A rating above 60 is good. Below that, maintainability suffers.
Compiler Warnings
Errors and warnings should be avoided in a project. Allowing more than zero errors or warnings tends to result in the team accepting lower quality in the codebase, which over time causes the code to lose maintainability (commonly known as the broken windows theory 1).
Track this metric to make sure the number of errors is zero. This should ideally be enforced by automatic build policies.
Code Analysis Warnings
Code analysis in development tools performs static analysis on code, which helps developers identify potential design, globalization, interoperability, performance, security, and many other categories of potential problems. Much of this is so far only available for .NET development; if you’re using Java, things may be different.
Code analysis tools provide warnings that indicate rule violations in managed code libraries. The warnings are organized into rule areas such as design, localization, performance, and security. Each warning signifies a violation of a code analysis rule.
Code analysis can be used to enforce company policies on the code developers write. Many ALM tools offer good support for code analysis, usually including a set of rules. Often you can even extend them by writing your own rule set or suppress the rules you don’t want. Definitely discuss this with your development team and the PO, because the warnings have an impact on the effort required before the DoD is fulfilled.
Metrics for Software Testing
Software testing is an important area. Testing should be a constant part of any development effort and not only a phase at the end of the project. There are good metrics you can use during your projects to make sure you have high-quality testing in place.
Following are a number of metrics you can use as KPIs for software testing:
Number of bugs per state: How many bugs are active, resolved, or closed? Is the number of active bugs increasing and the number of resolved and closed bugs constant? If so, you need to look into how you perform your testing.
Number of bugs sent back from testers for more information (AKA, reactivated bugs): A large number may indicate that communication between developers and testers must improve.
Code coverage: This shows how much of the code has been covered by automated unit tests. You get the value as a percentage of the entire codebase.
Tests run results: How are your tests performing? Do you have many failed tests? If so, what can you do to improve this?
Percent requirements covered by test cases: Do you write test cases for all your requirements? If not, what is the reason?
Percent requirements covered by testing: Do you actually run the tests for which you have test cases? If this figure is low and the figure for percent requirements covered by test cases is high, you may have an issue you need to deal with.
Example Reports
The metrics you get in your reports concerning testing can be very helpful in your projects. The reports described here are found in many tools:
Bug status
Reactivations
Bug trend
Bug Status Report
The bug status report gives you information about the cumulative bug count based on bug state, priority, who it’s assigned to, and, of course, bug severity. It shows you the number of bugs and the number of resolved bugs (see Figures 7-8 and 7-9).

Figure 7-8. Bug status report
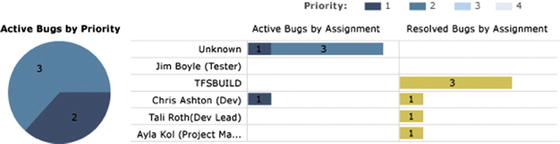
Figure 7-9. Bug status report
Figure 7-8 shows the number of bugs over time. You can see how the numbers of active, closed, and resolved bugs have changed. In this case, the number of active bugs is decreasing and the number of closed and resolved bugs is increasing, leading to a point where the number of active bugs is zero.
Figure 7-9 shows a report that displays how many bugs are assigned to an individual user. You can also see the priority of each bug as well as how many bugs have been resolved by the users.
Reactivations Report
The reactivations report (see Figure 7-10) is used to see how many bugs have been resolved or closed too early. If a bug needs to be opened again, it’s called a reactivation. A high number indicates that the developers need to improve their bug-fixing process and not close or resolve the bugs unless they really are ready to be closed. It can also be an indication that you have bad communication between testers and developers. For instance, incomplete test reports and poorly written test cases can cause this.

Figure 7-10. Reactivations report
Bug Trend Report
Next is the bug trend report(see Figure 7-11). This report helps you track the rate at which your team is finding, resolving, and closing bugs.

Figure 7-11. Bug trend report
Metrics for Release Management
A quick look at the Information Technology Infrastructure Library (ITIL) ( www.itilnews.com/ITIL_v3_Suggested_Release_and_Deployment_KPIs.html ) will give you some other KPIs you can use. If you want to use them, you may need to create your own reports to automate the retrieval of this information. ITIL mentions these KPIs, among others:
Number of software defects in production, which is the number of bugs or software defects of applications (versions) that are in production
Percentage of successful software upgrades, which excludes full installations
Number of untested releases (not tested and signed off)
Number of urgent releases
Average costs of release, where costs most likely are based on man-hours spent
Note
The ITIL is a set of practices for IT service management (ITSM) that focuses on aligning IT services with the needs of business. ITIL describes procedures, tasks, and checklists that aren’t organization specific, and are used by organizations to establish a minimum level of competency. It allows an organization to establish a baseline from which it can plan, implement, and measure. It’s used to demonstrate compliance and to measure improvement.
Sample Reports
Following the progress of your builds is essential in order to keep track of quality. These reports differ from ALM platform to platform, but let’s look at some examples from Microsoft Team Foundation Server 2012. Use them as inspirations for what you can look for in your platform:
Build quality indicators
Build success over time
Build summary report
The build quality indicators report (see Figure 7-12) shows a summary of some important values for your builds. Using this data, you can see whether you’re close to releasing the build. Some of the information this report shows includes the following:
Active bugs: How many active bugs existed at the time of the build.
Code churn: The number of lines of code that have been added, removed, and changed in the check-ins before the build.
Code coverage: Percentage of code covered by tests.
Inconclusive tests: The number of tests that didn’t succeed or were paused. If the build didn’t succeed, the tests are either not counted or counted as inconclusive.
Failed tests: How many tests failed during the build.
Passed tests: How many tests were passed during the build.
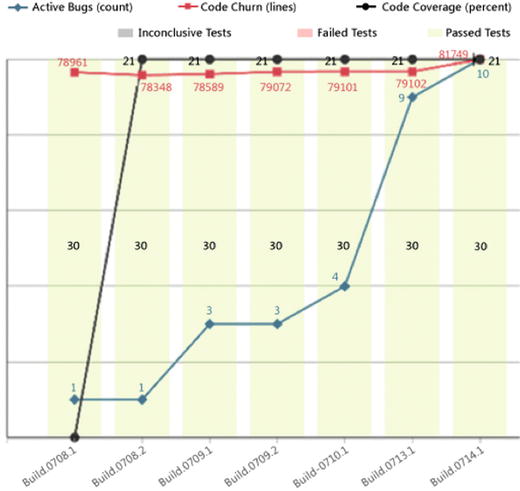
Figure 7-12. Quality indicators report
The build success over time report (see Figure 7-13) shows you the status of the last build for each build category (a combination of build definition, platform, and configuration) that runs each day. You can use this report to help you keep track of the quality of the code that you check in. Furthermore, for any day on which a build ran, you can view the build summary for that specific day.
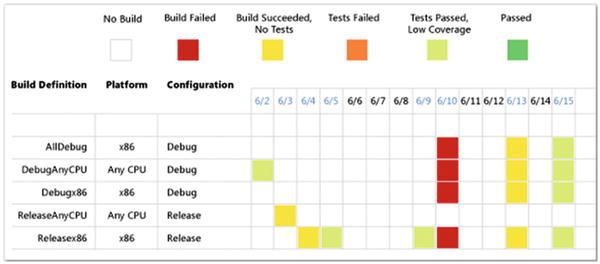
Figure 7-13. Build success over time report
The build summary report (see Figure 7-14) shows you information about test results, test coverage, and code churn, as well as quality notes for each build.

Figure 7-14. Build summary report
These metrics are suggestions that you can use as a base for following up on progress and quality in your projects. Different ALM tools offer different possibilities for reporting and collecting information. Thus it’s important that you think through what you want for your organization when choosing an ALM platform.
Using Charts to Monitor Metrics
In TFS you can also add charts to monitor information about your projects. In Figure 7-15, you can see that the charts can be created if you navigate to Queries and then select charts. You can create charts from many queries that you create using the query editor.
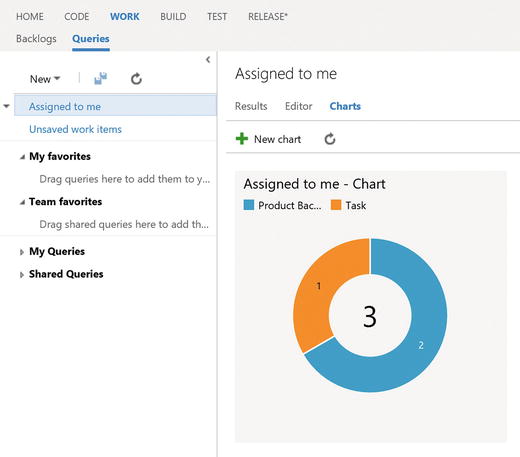
Figure 7-15. Accessing charts editing
You can choose to create many types of charts (Figure 7-16) including pie, bar, column, stacked bar, and so on, so that you can display the results as you want. If you create a chart that will be useful to the whole team, you can add that chart to the project home page so that it will always show up when you open the web portal. For this to work,you must create the query as a shared query.
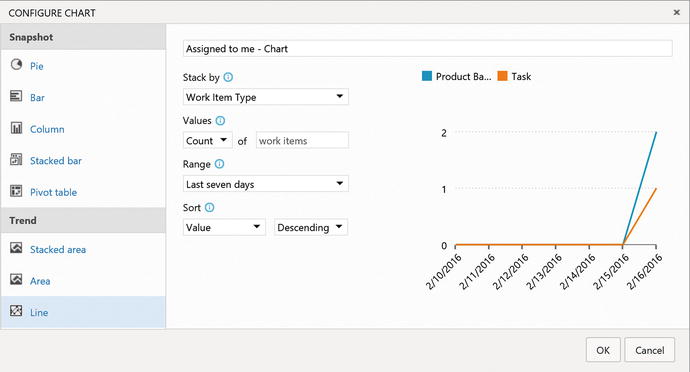
Figure 7-16. Charts can be displayed in various ways
With TFS 2015 Update 2, you can add charts for work item queries to the dashboard from the widget catalog. These charts are configurable. You can choose a query and a chart type, as well as visualization options while staying in the dashboard context. Chart types include pie, bar, column, stacked bar, line, area, and stacked area. You can also display data in a pivot table. And, you can still add charts from the Charts tab in the Work hub and configure them just like you’ve always done.
Summary
Metrics and KPIs are valuable for any organization if you want to evaluate progress and quality. This chapter has shown some examples of metrics you can use for your agile projects, but they are not limited to these projects. They can help you run your projects more efficiently and with higher application quality as an end result.
Keep in mind that different organizations find different metrics valuable. This chapter has given examples of metrics that are commonly used, but there may be others that are better suited for you.
The next chapter walks you through a scenario that implements agile processes on different levels in a software development project.