
Let's make our application crash to see how to read a crash dump:
- Simulate a fatal bug in
jni/com_packtpub_store_Store.cpp:#include "com_packtpub_store_Store.h" JNIEXPORT jint JNICALL Java_com_packtpub_store_Store_getCount (JNIEnv* pEnv, jobject pObject) { pEnv = 0; return pEnv->CallIntMethod(0, 0); } - Open the LogCat view in Eclipse, select the All Messages (no filter) option, and then run the application. A crash dump appears in the logs. This is not pretty! If you look carefully through it, you should find a
backtracesection with a snapshot of the call-stack at the moment the application crashed. However, it does not give the line of code involved: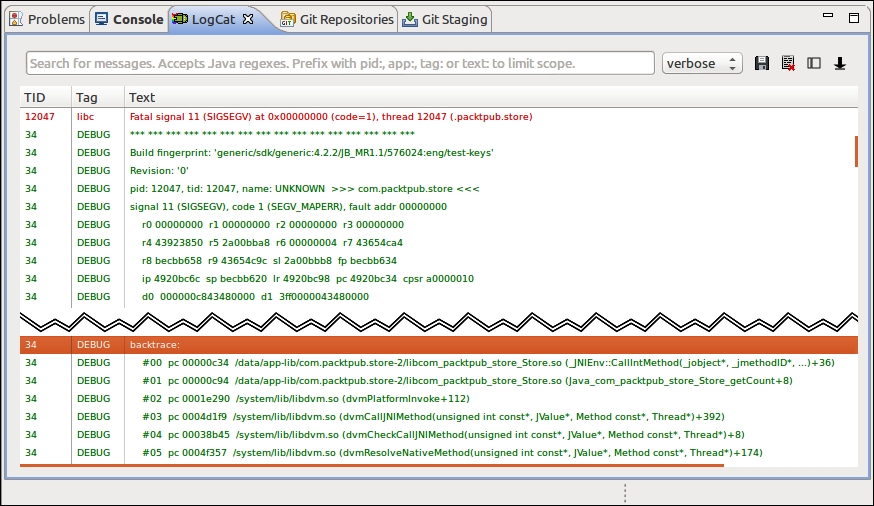
- From a command-line prompt, go to the project directory. Find the line of code implied in the crash by running NDK-Stack with
logcatas the input. NDK-Stack needs theobjfiles corresponding to the device ABI on which the application crashed, for example:cd <projet directory> adb logcat | ndk-stack -sym obj/local/armeabi-v7a
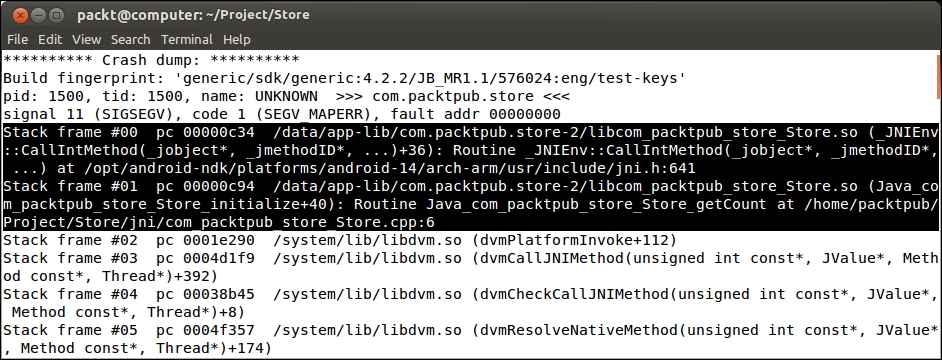
NDK-Stack utility provided with the Android NDK can help you locate the source of an application crash. This tool is an inestimable help and should be considered as your first-aid kit when a bad crash happens. However, if it can point you toward the where, it is another kettle of fish to find out the why.
Stack-trace is only a small part of a crash dump. Deciphering the rest of a dump is rarely necessary but understanding its meaning is good for general culture.
Crash dumps are not only dedicated to overly talented developers seeing a red-dressed girl in binary code, but also to those who have a minimum knowledge of assemblers and the way processors work. The goal of this trace is to give as much information as possible on the current state of the program at the time it crashed. It contains:
- 1st line: Build Fingerprint is a kind of identifier indicating the device/Android release currently running. This information is interesting when analyzing dumps from various origins.
- 3rd line: The PID or process identifier uniquely identifies an application on the Unix system, and the TID, which is the thread identifier. The thread identifier can be the same as the process identifier when a crash occurs on the main thread.
- 4th line: The crash origin represented as a Signal is a classic segmentation fault (SIGSEGV).
- Processor Register values. A register holds values or pointers on which the processor can work immediately.
- Backtrace (that is the stack-trace) with the method calls that lead to the crash.
- Raw stack is similar to the backtrace but with stack parameters and variables.
- Some Memory Words around the main register (provided for ARM processors only). The first column indicates memory-line locations, while others columns indicate memory values represented in hexadecimal.
Processor registers are different between processor architectures and versions. ARM processors provide:
|
rX |
Integer Registers where a program puts values it works on. |
|
dX |
Floating Point Registers where a program puts values it works on. |
|
fp (or r11) |
Frame Pointer holds the current stack frame location during a routine call (in conjunction with the Stack Pointer). |
|
ip (or r12) |
Intra Procedure Call Scratch Register may be used with some sub-routine calls; for example, when the linker needs a veneer (a small piece of code) to aim at a different memory area when branching. Indeed, a branch instruction to jump somewhere else in memory requires an offset argument relative to the current location, allowing a branching range of a few MB only, not the full memory. |
|
sp (or r13) |
Stack Pointer holds the location of the top of the stack. |
|
lr (or r14) |
Link Register saves a program counter value temporarily so that it can restore it later. A typical example of its use is as a function call, which jumps somewhere in the code and then goes back to its previous location. Of course, several chained sub-routine calls require the Link Register to be stacked. |
|
pc (or r15) |
Program Counter holds the address of the next instruction to be executed. The program counter is just incremented when executing a sequential code to fetch the next instruction but it is altered by branching instructions (if/else, a C/C++ function calls, and so on). |
|
cpsr |
Current Program Status Register contains a few flags about the current processor working mode and some additional bit flags for condition codes (such as N for an operation that resulted in a negative value, Z for a 0 or equality result, and so on), interrupts, and instruction sets (Thumb or ARM). |
On the other hand, X86 processors provide:
|
eax |
Accumulator Register is used, for example, for arithmetic or I/O operations. |
|
ebx |
Base Register is a data pointer for memory access. |
|
ecx |
Counter Register is used for iterative operations such as loop counter. |
|
edx |
Data Register is a secondary Accumulator Register used in conjunction with |
|
esi |
Source Index Register is used for memory array copying in conjunction with |
|
edi |
Destination Index Register is used for memory array copying in conjunction with |
|
eip |
Instruction Pointer holds offset of the next instruction. |
|
ebp |
Base Pointer holds the current stack frame location during a routine call (in conjunction with the Stack Pointer). |
|
esp |
Stack Pointer holds the location of the top of the stack. |
|
xcs |
Code Segment helps in addressing the memory segment in which the program runs. |
|
xds |
Data Segment helps addressing a data memory segment. |
|
xes |
Extra Segment is an additional register to address a memory segment. |
|
xfs |
Additional Segment which is a general purpose data segment. |
|
xss |
Stack segment holds the Stack memory segment. |
Deciphering stack-traces is not an easy task and requires time and expertise. Don't bother too much if you do not understand every part of it yet. This is necessary as a last resort only.