You now have seen how to secure your Azure SQL deployment. Another aspect to ensure you have the best possible database for your application is understanding how to monitor and tune performance. If you know SQL Server, here is some good news. The engine that powers Azure SQL is the same one for SQL Server! This means that just about any performance capability you need exists for Azure SQL. It also means that many of the same tasks and skills you use for SQL Server apply to Azure SQL. In this chapter, we will explore all the capabilities and tasks you normally use to monitor and tune performance for a SQL Server and compare it with Azure SQL.
An Azure subscription.
A minimum of Contributor role access to the Azure subscription. You can read more about Azure built-in roles at https://docs.microsoft.com/en-us/azure/role-based-access-control/built-in-roles.
Access to the Azure Portal (web or Windows application).
A deployment of an Azure SQL Managed Instance and/or an Azure SQL Database as I did in Chapter 4. The Azure SQL Database I deployed uses the AdventureWorks sample which will be required to use some of the examples.
To connect to Managed Instance, you will need a jumpbox or virtual machine in Azure to connect. I showed you how to do this in Chapter 4 of the book. One simple way to do this is to create a new Azure Virtual Machine and deploy it to the same virtual network as the Managed Instance (you will use a different subnet than the Managed Instance).
To connect to Azure SQL Database, I’m going to use the Azure VM I deployed in Chapter 3, called bwsql2019, and configured for a private endpoint in Chapter 6 (you could use another method as long as you can connect to the Azure SQL Database).
Installation of the az CLI (see https://docs.microsoft.com/en-us/cli/azure/install-azure-cli?view=azure-cli-latest for more details). You can also use the Azure Cloud Shell instead since az is already installed. You can read more about the Azure Cloud Shell at https://azure.microsoft.com/en-us/features/cloud-shell/.
You will run some T-SQL in this chapter, so install a tool like SQL Server Management Studio (SSMS) at https://docs.microsoft.com/en-us/sql/ssms/download-sql-server-management-studio-ssms?view=sql-server-ver15. You can also use Azure Data Studio at https://docs.microsoft.com/en-us/sql/azure-data-studio/download-azure-data-studio?view=sql-server-ver15. I installed both SSMS and ADS in the bwsql2019 Azure Virtual Machine.
For this chapter, I have script files you can use for several of the examples. You can find these scripts in the ch7_performance folder for the source files included for the book. I will also use the very popular tool ostress.exe for exercises in this chapter which comes with the RML Utilities. You can download RML from www.microsoft.com/en-us/download/details.aspx?id=4511. Make sure to put the folder where RML gets installed in your system path (which is by default C:Program FilesMicrosoft CorporationRMLUtils).
Performance Capabilities
Since the engine that powers Azure SQL is the same as SQL Server, just about any performance capability is available to you. Having said that, I feel it is important to cover a few important areas that are similar and different that can affect your ability to ensure maximum performance for your Azure SQL deployment. This includes maximum capacities, indexes, In-Memory OLTP, Partitions, SQL Server 2019 performance enhancements, and new Azure SQL Intelligent performance capabilities.
Max Capacities
When you choose a platform to install SQL Server, you typically size the resources you need. In many cases, you plot out the maximum capacities you will need for resources such as CPU, memory, and disk space. You may also ensure you have the correct performance capabilities for I/O with regard to IOPS and latency.
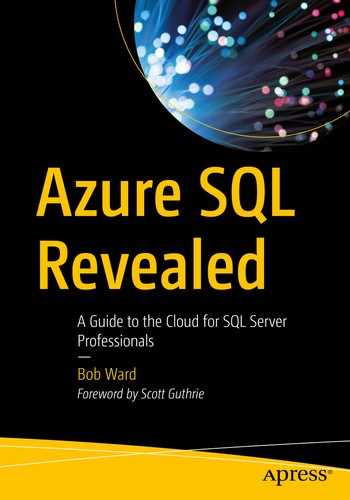
Azure SQL Managed Instance can support up to 80 vCores, ~400Gb of memory, and a maximum storage of 8TB. The Business Critical tier is limited to 4TB because that is the current maximum size we can store on the local SSD drives of the nodes that host Managed Instance.
Azure SQL Database can support up to 128 vCores, ~4TB Memory, and a 4TB database using the M-Series.
The Hyperscale deployment option for Azure SQL Database can support up to 100TB database and unlimited transaction log space.
Your decision on deployment options such as number of vCores greatly affects other resource capacities whether it is a Managed Instance or Database deployment. For example, the number of vCores for a General Purpose Azure SQL Database affects the maximum memory, maximum database size, maximum transaction log size, and maximum log rate, among others.
Let’s stop here to help you get oriented. How can you see a chart or table to figure out the limits for all these choices?
For a Managed Instance, go to this documentation page: https://docs.microsoft.com/en-us/azure/azure-sql/managed-instance/resource-limits#service-tier-characteristics.
Resource capacities and limits for Azure SQL Managed Instance
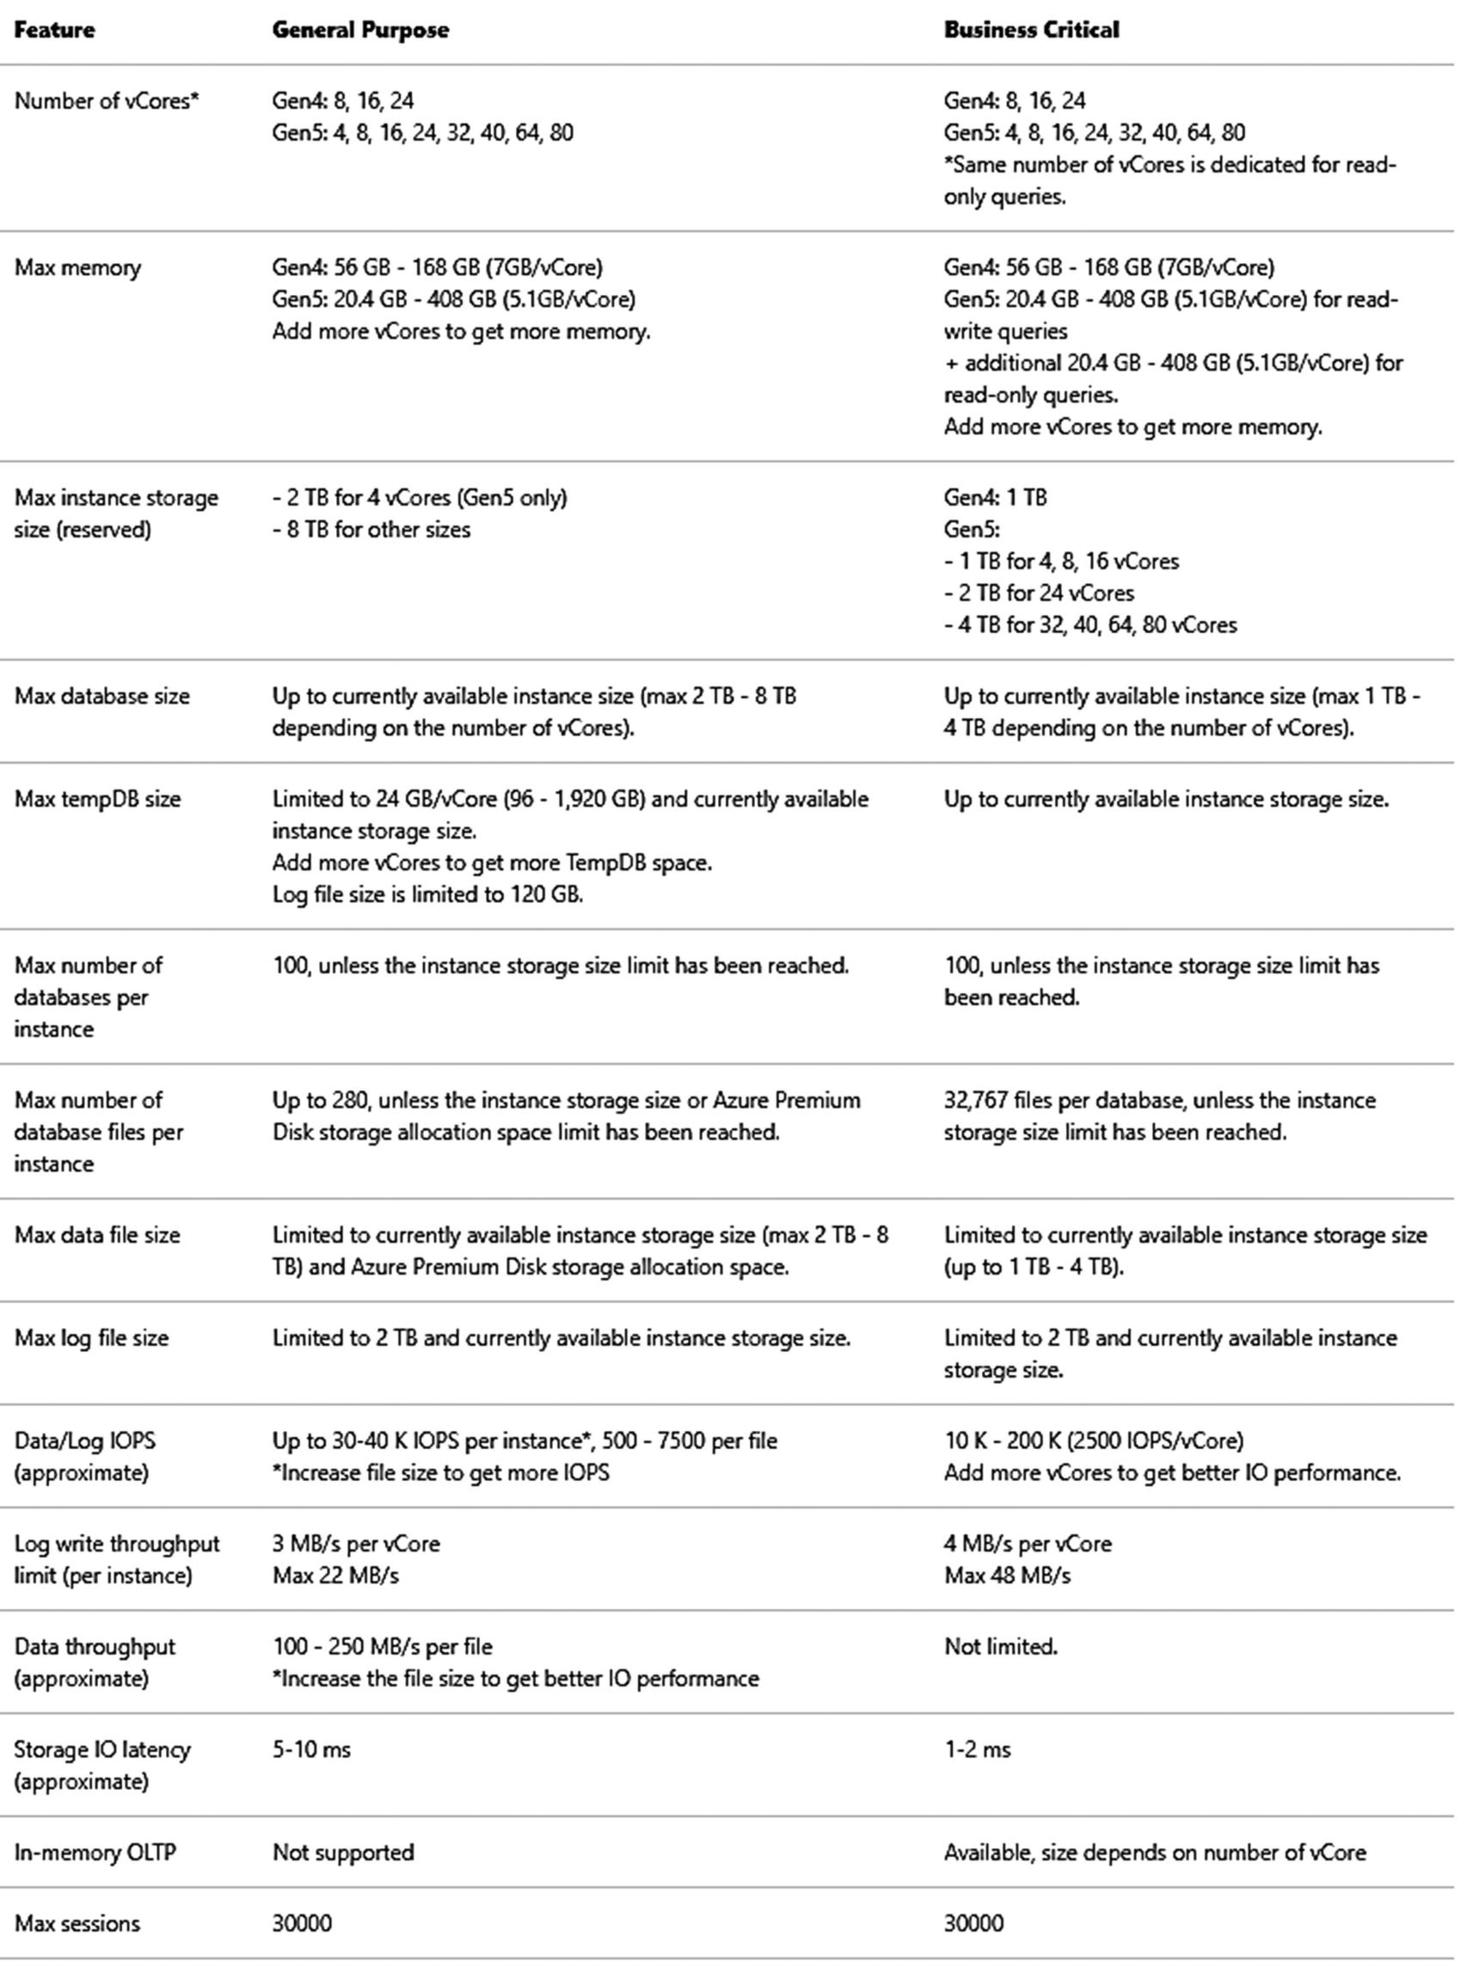
Resource capacities and limits for Azure SQL Database
The default table is the first choice which is a Serverless compute tier. You can see on the right-hand side of this figure you can choose different deployment options to see what the capacity and limits for different options. Bookmark these documentation links. I use them all the time. It is possible these limits will change over time as we evolve the capabilities of Azure SQL services.
Keep in mind that some limits like memory are enforced by Windows Job Objects. I mentioned this implementation in Chapter 4 of the book. Use the DMV sys.dm_os_job_object to see the true limits for memory and other resources for your deployment.
I’m a developer at heart, so I wanted a way to find out these capacities and limits without looking at a table. The best method I could find is REST APIs. An example is in our documentation at https://docs.microsoft.com/en-us/rest/api/sql/capabilities/listbylocation. Once you deploy, you get to see your resource limits with DMVs like sys.dm_user_db_resource_governance.
What if you make the wrong choice and need more capacity? The good news is that you can make changes for Azure SQL Managed Instance and Database to get more (or less) without any database migration required. You will see an example of this later in this chapter. Just remember that a change for Managed Instance can take a significant amount of time.
There are two exceptions to this statement about migration. First, you cannot switch between Azure SQL Database and Azure SQL Managed Instance. Second, if you deploy or switch to the Hyperscale service tier, you cannot switch back.
Indexes
Anyone who works with SQL Server knows that without proper indexes, it is difficult to obtain the query performance you need.
Every type of index option you can use in SQL Server is available to you with Azure SQL, including clustered, non-clustered, online, and resumable indexes. You can read an index primer at https://docs.microsoft.com/en-us/sql/relational-databases/indexes/clustered-and-nonclustered-indexes-described?view=sql-server-ver15 and details on online indexes at https://docs.microsoft.com/en-us/sql/relational-databases/indexes/perform-index-operations-online. Resumable online indexes are a recent capability. You can read more at https://azure.microsoft.com/en-us/blog/modernize-index-maintenance-with-resumable-online-index-rebuild/.
Columnstore indexes are nothing short of amazing. I continue to see customers who just don’t take advantage of this capability. Columnstore index can accelerate read query performance by 100x for the right workload. Columnstore indexes are supported in every deployment option you choose with Azure SQL. One myth about columnstore is that it is only an in-memory technology. The truth is that columnstore indexes perform best when they fit in memory and use compression so more will fit in your memory limits. However, a columnstore index does not have to all fit in memory. To get a start on columnstore indexes, see the documentation at https://docs.microsoft.com/en-us/sql/relational-databases/indexes/columnstore-indexes-overview.
In-Memory OLTP
In SQL Server 2014 (and greatly enhanced in SQL Server 2016), we introduced a revolutionary capability for high-speed transactions called In-Memory OLTP (code name Hekaton). In-Memory OLTP is available for Azure SQL Managed Instance and Databases if you choose the Business Critical service tier.
Memory-optimized tables are the mechanism to use In-Memory OLTP. Memory-optimized tables are truly in-memory as they must completely fit in memory. The memory available for store memory-optimized tables is a subset of the memory limits of your Business Critical service tier. The number of vCores for your deployment determines what percentage of memory is available for memory-optimized tables.
Memory-optimized tables require a memory-optimized filegroup. Azure SQL creates this filegroup for any databases even if it is not a Business Critical (BC) service tier. This way, if you move to BC, the filegroup is set up for memory-optimized tables.
New to In-Memory OLTP? Start with our documentation at https://docs.microsoft.com/en-us/sql/relational-databases/in-memory-oltp/overview-and-usage-scenarios.
Partitions
Partitions are supported for Azure SQL Database and Managed Instance.
You can only use filegroups with partitions with Azure SQL Managed Instance (remember, Azure SQL Database only has a primary partition, while Managed Instance supported user-defined filegroups).
Need a primer for partitions? Start with this documentation page: https://docs.microsoft.com/en-us/sql/relational-databases/partitions/partitioned-tables-and-indexes?view=sql-server-ver15.
There are some interesting partitioning techniques with Azure SQL Database not associated with SQL partitions you may want to look at as a developer. Read more at https://docs.microsoft.com/en-us/azure/architecture/best-practices/data-partitioning-strategies#partitioning-azure-sql-database.
SQL Server 2019 Enhancements
SQL Server 2019 was a monumental release including several new capabilities. Performance was an area of major investment for SQL Server 2019. Because Azure SQL is versionless, almost all the performance enhancements for SQL Server 2019 are part of Azure SQL including built-in engine features like Intelligent Query Processing . The one exception is Tempdb Metadata Optimization. We first built this feature in SQL Server 2019 and have yet to integrate this into Azure SQL. But rest assured, we are working on either baking this into Azure SQL as a default or providing an option to enable it.
It is important to know that some “hidden gem” capabilities like merry-go-round scans and buffer pool ramp-up are all used behind the scenes for all editions of Azure SQL.
Intelligent Performance
Over the past few releases of SQL Server, we have been striving to provide built-in capabilities to enhance performance without you making application changes. Our goal is to use data and automation to make smart decision to make your queries run faster. We call this Intelligent Performance. These capabilities exist in Azure SQL, but we go further in the cloud. We use the power of the cloud to offer even more. You learn more details about Intelligent Performance for Azure SQL in the final section of this chapter.
Configuring and Maintaining for Performance
In Chapter 5 of this book, I described many of the options to configure an Azure SQL Managed Instance and Database. There are some configuration options that can affect performance worth diving deeper into. This includes the Tempdb database, configuring database options, files and filegroups, max degree of parallelism, and Resource Governor. In addition, it is worth reviewing the various tasks you would go through to maintain indexes and statistics for database for Azure SQL as compared to SQL Server.
Tempdb
The Tempdb database is an important shared resource used by applications. Ensuring the right configuration of tempdb can affect your ability to deliver consistent performance. Tempdb is used the same with Azure SQL like SQL Server, but your ability to configure tempdb is different, including placement of files, the number and size of files, tempdb size, and tempdb configuration options.
In Azure SQL, Tempdb files are always automatically stored on local SSD drives, so I/O performance shouldn’t be an issue.
SQL Server professionals often use more than one database file to partition allocations for tempdb tables. For Azure SQL Database, the number of files is scaled with the number of vCores (e.g., 2 vCores = 4 files, etc.) with a max of 16. The number of files is not configurable through T-SQL against tempdb but by changing the deployment option. The maximum size of the tempdb database is scaled per number of vCores.
You get 12 files with Azure SQL Managed Instance independent of vCores, and you cannot change this number. We are looking in the future to allow configuration of the number of files for Azure SQL Managed Instance.
Tempdb database option MIXED_PAGE_ALLOCATION is set to OFF and AUTOGROW_ALL_FILES is set to ON. This cannot be configured, but they are the recommended defaults as with SQL Server.
Currently, the Tempdb Metadata Optimization feature in SQL Server 2019, which can alleviate heavy latch contention, is not available in Azure SQL but is planned for the future.
Database Configuration
As I described in Chapter 5, just about every database configuration option is available to you with Azure SQL as it is with SQL Server through ALTER DATABASE and ALTER DATABASE SCOPED configuration. Consult the documentation at https://docs.microsoft.com/en-us/sql/t-sql/statements/alter-database-transact-sql and https://docs.microsoft.com/en-us/sql/t-sql/statements/alter-database-scoped-configuration-transact-sql. You will see later in this chapter there are new options specific to Azure SQL from ALTER DATABASE.
For performance, one database option that is not available to change is the recovery model of the database. The default is full recovery and cannot be modified. This ensures your database can meet Azure service-level agreements (SLAs). Therefore, minimal logging for bulk operations is not supported. Minimal logging for bulk operations is supported for tempdb.
Files and Filegroups
SQL Server professionals often use files and filegroups to improve I/O performance through physical file placement. Azure SQL does not allow users to place files on specific disk systems. However, Azure SQL has resource commitments for I/O performance with regard to rates, IOPS, and latencies, so abstracting the user from physical file placement can be a benefit.
Azure SQL Database only has one database file (Hyperscale may have several), and the size is configured through Azure interfaces. There is no functionality to create additional files, but again you don’t need to worry about this given IOPS and I/O latency commitments.
Hyperscale has a unique architecture and may create one or more files upon initial deployment depending on your vCore choice. For example, for an 8 vCore deployment, I’ve seen Hyperscale create multiple files totaling 40Gb. This implementation may change, and you shouldn’t rely on it. Hyperscale simply creates the files and size it needs to meet your requirements.
Azure SQL Managed Instance supports adding database files and configuring sizes but not physical placement of files. The number of files and file sizes for Azure SQL Managed Instance can be used to improve I/O performance. I will discuss more of the details on how this works later in this chapter. In addition, user-defined filegroups are supported for Azure SQL Managed Instance for manageability purposes such as use with partitions and using commands like DBCC CHECKFILEGROUP.
Max Degree of Parallelism
ALTER DATABASE SCOPED CONFIGURATION to configure MAXDOP is supported for Azure SQL.
sp_configure for “max degree of parallelism” is supported for Managed Instance.
MAXDOP query hints are fully supported.
Configuring MAXDOP with Resource Governor is supported for Managed Instance.
Read more about MAXDOP at https://docs.microsoft.com/en-us/sql/database-engine/configure-windows/configure-the-max-degree-of-parallelism-server-configuration-option?view=sql-server-ver15.
Resource Governor
Resource Governor is a feature in SQL Server that can be used to control resource usage for workloads through I/O, CPU, and memory. While Resource Governor is used behind the scenes for Azure SQL Database, it is only supported for Azure SQL Managed Instance for user-defined workload groups and pools. If you would like to use Resource Governor in Azure SQL Managed Instance, consult our documentation at https://docs.microsoft.com/en-us/sql/relational-databases/resource-governor/resource-governor.
Maintaining Indexes
Unfortunately, indexes for SQL don’t just maintain themselves, and they do occasionally need maintenance. In fairness, index maintenance (specifically rebuild or reorganization) does not have a single answer. I’ve seen many customers perform too often a rebuild or reorganization when it is not necessary. Likewise, there can be many times where these operations can help performance. You might consider looking at our documentation on index fragmentation as one reason why index maintenance can make sense: https://docs.microsoft.com/en-us/sql/relational-databases/indexes/reorganize-and-rebuild-indexes.
I’m not telling the complete truth. For Azure SQL, there is a solution here that can help with decisions on building or dropping indexes. But I won’t get too far ahead. The tale of that story is at the end of the chapter.
Indexes for SQL Server occasionally need to be reorganized and sometimes rebuilt. Azure SQL supports all the options you have for SQL Server to reorganize and rebuild indexes including online and resumable indexes.
Online and resumable index operations can be extremely important to maintain maximum application availability. Read all about these capabilities at https://docs.microsoft.com/en-us/sql/relational-databases/indexes/guidelines-for-online-index-operations.
Maintaining Statistics
Correct statistics can be the lifeblood for query performance. SQL Server offers options to automatically keep statistics up to date based on database modification, and Azure SQL supports all those options. Our documentation has a very detailed explanation on how statistics are used for query performance at https://docs.microsoft.com/en-us/sql/relational-databases/statistics/statistics.
One interesting aspect to automatic statistics updates is a database scoped configuration we specifically introduced for Azure SQL to help improve application availability. You can read about this in great detail from a blog post by my colleague Dimitri Furman at https://techcommunity.microsoft.com/t5/azure-sql-database/improving-concurrency-of-asynchronous-statistics-update/ba-p/1441687.
Monitoring and Troubleshooting Performance
If you want to ensure you have the best performance for a SQL application, you need to learn how to monitor and troubleshoot performance scenarios. Azure SQL comes with the performance tools and capabilities of SQL Server to help you with this task. This includes tools from the Azure ecosystem as well as capabilities built into the SQL Server engine that powers Azure SQL.
In this part of the chapter of the book, you will learn not just monitoring capabilities but how to apply them to performance scenarios for Azure SQL including examples.
Monitoring Tools and Capabilities
Are you used to using Dynamic Management Views (DMV) and Extended Events? Azure SQL has what you need. Do you need to debug query plans? Azure SQL has all the capabilities of SQL Server including Lightweight Query Profiling and showplan details.
Query Store has become the bedrock for performance tuning, and it is on by default in Azure SQL. The Azure portal includes visualizations, such as Query Performance Insight, to view Query Store data without needing tools like SSMS.
All this lines up to be a formidable set of tools and capabilities to help you monitor and troubleshoot performance for Azure SQL.
We want to invest more to make Azure SQL monitoring the best experience as possible. According to Alain Dormehl, Senior Program Manager for Azure SQL, “Our continued investment into infrastructure and new features on the platform will continue to drive the expectations from our customers for deep insights. On a daily basis we gather a huge amount of telemetry data and our teams will continue to innovate in how we present this data to customers, so that it adds value, but also to build smarter, more innovative features for monitoring, alerting, and automating.”
Azure Monitor
Azure Monitor is part of the Azure ecosystem, and Azure SQL is integrated to support Azure Metrics, Alerts, and Logs. Azure Monitor data can be visualized in the Azure Portal or accessed by applications through Azure Event Hub or APIs. An example of why Azure Monitor is important is accessing resource usage metrics for Azure SQL outside of SQL Server tools much like Windows Performance Monitor. Read more about how to use Azure Monitor with Azure SQL in the Azure portal at https://docs.microsoft.com/en-us/azure/azure-sql/database/monitor-tune-overview#monitoring-and-tuning-capabilities-in-the-azure-portal.
Dynamic Management Views (DMV)
Azure SQL provides the same DMV infrastructure as with SQL Server with a few differences. DMVs are a crucial aspect to performance monitoring since you can view key SQL Server performance data using standard T-SQL queries. Information such as active queries, resource usage, query plans, and resource wait types are available with DMVs. Learn more details about DMVs with Azure SQL later in this chapter.
Extended Events (XEvent)
Azure SQL provides the same Extended Events infrastructure as with SQL Server. Extended Events is a method to trace key events of execution within SQL Server that powers Azure SQL. For performance, extended events allow you to trace the execution of individual queries. Learn more details about Extended Events with Azure SQL later in this chapter.
Lightweight Query Profiling
Lightweight Query Profiling is a capability to examine the query plan and running state of an active query. This is a key feature to debug query performance for long-running statements as they are running. This capability cuts down the time for you to solve performance problems vs. using tools like Extended Events to trace query performance. Lightweight Query Profiling is accessed through DMVs and is on by default for Azure SQL just like SQL Server 2019. Read more about Lightweight Query Profiling at https://docs.microsoft.com/en-us/sql/relational-databases/performance/query-profiling-infrastructure?view=sql-server-ver15#lwp.
Query Plan Debugging
In some situations, you may need additional details about query performance for an individual T-SQL statement. T-SQL SET statements such as SHOWPLAN and STATISTICS can provide these details and are fully supported for Azure SQL as they are for SQL Server. A good example of using SET statements for query plan debugging can be found at https://docs.microsoft.com/en-us/sql/t-sql/statements/set-statistics-profile-transact-sql. In addition, looking at plans in a graphical or XML format is always helpful and completely works for Azure SQL. Learn more at https://docs.microsoft.com/en-us/sql/relational-databases/performance/display-the-estimated-execution-plan?view=sql-server-ver15.
Query Store
Query Store is a historical record of performance execution for queries stored in the user database. Query Store is on by default for Azure SQL and is used to provide capabilities such as Automatic Plan Correction and Automatic Tuning. SQL Server Management Studio (SSMS) reports for Query Store are available for Azure SQL. These reports can be used to find top resource consuming queries including query plan differences and top wait types to look at resource wait scenarios. I will show you an example of using the Query Store in this chapter with Azure SQL. If you have never seen or used Query Store, start reading at https://docs.microsoft.com/en-us/sql/relational-databases/performance/monitoring-performance-by-using-the-query-store.
Performance Visualization in Azure Portal
For Azure SQL Database, we have integrated Query Store performance information into the Azure Portal through visualizations. This way, you can see some of the same information for Query Store as you would with a client tool like SSMS by using the Azure Portal with an option called Query Performance Insight . I’ll show you an example of using these visuals in the portal later in the chapter. For now to get started using it, check out our documentation at https://docs.microsoft.com/en-us/azure/azure-sql/database/query-performance-insight-use.
Dive into DMVs and Extended Events
Dynamic Management Views (DMV) and Extended Events (XEvent) have been the bedrock of diagnostics including performance monitoring and troubleshooting for SQL Server for many years. I can truthfully tell you that DMV and XEvent technology all started with the brains of folks like Slava Oks and Conor Cunningham so many years ago. Many on the engineering team have worked, molded, and shaped these technologies, but I remember being there from the beginning with Slava and my colleague for many years Robert Dorr working on these technologies when we were in Microsoft support together. DMVs and XEvent are very important technologies to support performance monitoring and troubleshooting for Azure SQL because Azure SQL is powered by the SQL Server engine and the SQL Server engine powers Azure SQL Managed Instance and Database.
Let’s dive a bit deeper into what DMV and XEvent capabilities are the same and new for Azure SQL vs. SQL Server.
DMVs Deep Dive
Let’s dive deeper into DMV for Azure SQL vs. SQL Server across Azure SQL Managed Instance and Database.
Azure SQL Managed Instance
All DMVs for SQL Server are available for Managed Instance. Key DMVs like sys.dm_exec_requests and sys.dm_os_wait_stats are commonly used to examine query performance.
One DMV is specific to Azure called sys.server_resource_stats and shows historical resource usage for the Managed Instance. This is an important DMV to see resource usage since you do not have direct access to OS tools like Performance Monitor. You can learn more about sys.server_resource_stats at https://docs.microsoft.com/en-us/sql/relational-databases/system-catalog-views/sys-server-resource-stats-azure-sql-database?view=azuresqldb-current.
Azure SQL Database
Most of the common DMVs you need for performance including sys.dm_exec_requests and sys.dm_os_wait_stats are available. It is important to know that these DMVs only provide information specific to the database and not across all databases for a logical server.
sys.dm_db_resource_stats is a DMV specific to Azure SQL Database and can be used to view a history of resource usage for the database. Use this DMV similar to how you would use sys.server_resource_stats for a Managed Instance. I will show you how to use this DMV in an example later in this chapter. For now, you can read more at https://docs.microsoft.com/en-us/sql/relational-databases/system-dynamic-management-views/sys-dm-db-resource-stats-azure-sql-database?view=azuresqldb-current.
sys.elastic_pool_resource_stats is similar to sys.dm_db_resource_stats but can be used to view resource usage for elastic pool databases.
DMVs You Will Need
There are a few DMVs worth calling out you will need to solve certain performance scenarios for Azure SQL:
sys.dm_io_virtual_file_stats is important for Azure SQL since you don’t have direct access to operating system metrics for I/O performance per file.
sys.dm_os_performance_counters is available for both Azure SQL Database and Managed Instance to see SQL Server common performance metrics. This can be used to view SQL Server Performance Counter information that is typically available in Windows Performance Monitor.
sys.dm_instance_resource_governance can be used to view resource limits for a Managed Instance. You can view this information to see what your expected resource limits should be without using the Azure portal.
sys.dm_user_db_resource_governance can be used to see common resource limits per the deployment option, service tier, and size for your Azure SQL Database deployment. You can view this information to see what your expected resource limits should be without using the Azure portal. I’ll show you an example of looking at this DMV in an example. For now, you can read more at https://docs.microsoft.com/en-us/sql/relational-databases/system-dynamic-management-views/sys-dm-user-db-resource-governor-azure-sql-database?view=azuresqldb-current.
DMVs for Deep Troubleshooting
sys.dm_user_db_resource_governance_internal (Managed Instance only)
sys.dm_resource_governor_resource_pools_history_ex
sys.dm_resource_governor_workload_groups_history_ex
Geek out with these DMVs. The last two DMVs provide historical information across time (right now about 30 minutes). Be warned when using these DMVs. We kind of built these for our internal purposes to debug issues with Azure to look at problems like background activity vs. user load. So don’t be surprised if we change these to suit our needs to ensure we provide a great database service.
XEvent at Your Service
Extended Events (XEvent) was introduced as the new tracing mechanism for SQL Server in SQL Server 2005 to replace SQL Trace. XEvent today supports some 1800+ trace points in the SQL Server engine. XEvent powers other capabilities including SQL Audit and Advanced Threat Protection (ATP).
Extended Events for Azure SQL Managed Instance
All events, targets, and actions are supported.
File targets are supported with Azure Blob Storage since you don’t have access to the underlying operating system disks.
Some specific events are added for Managed Instance to trace events specific to the management and execution of the instance.
You can use SSMS or T-SQL to create and start sessions. You can use SSMS to view extended event session target data or the system function sys.fn_xe_file_target_read_file.
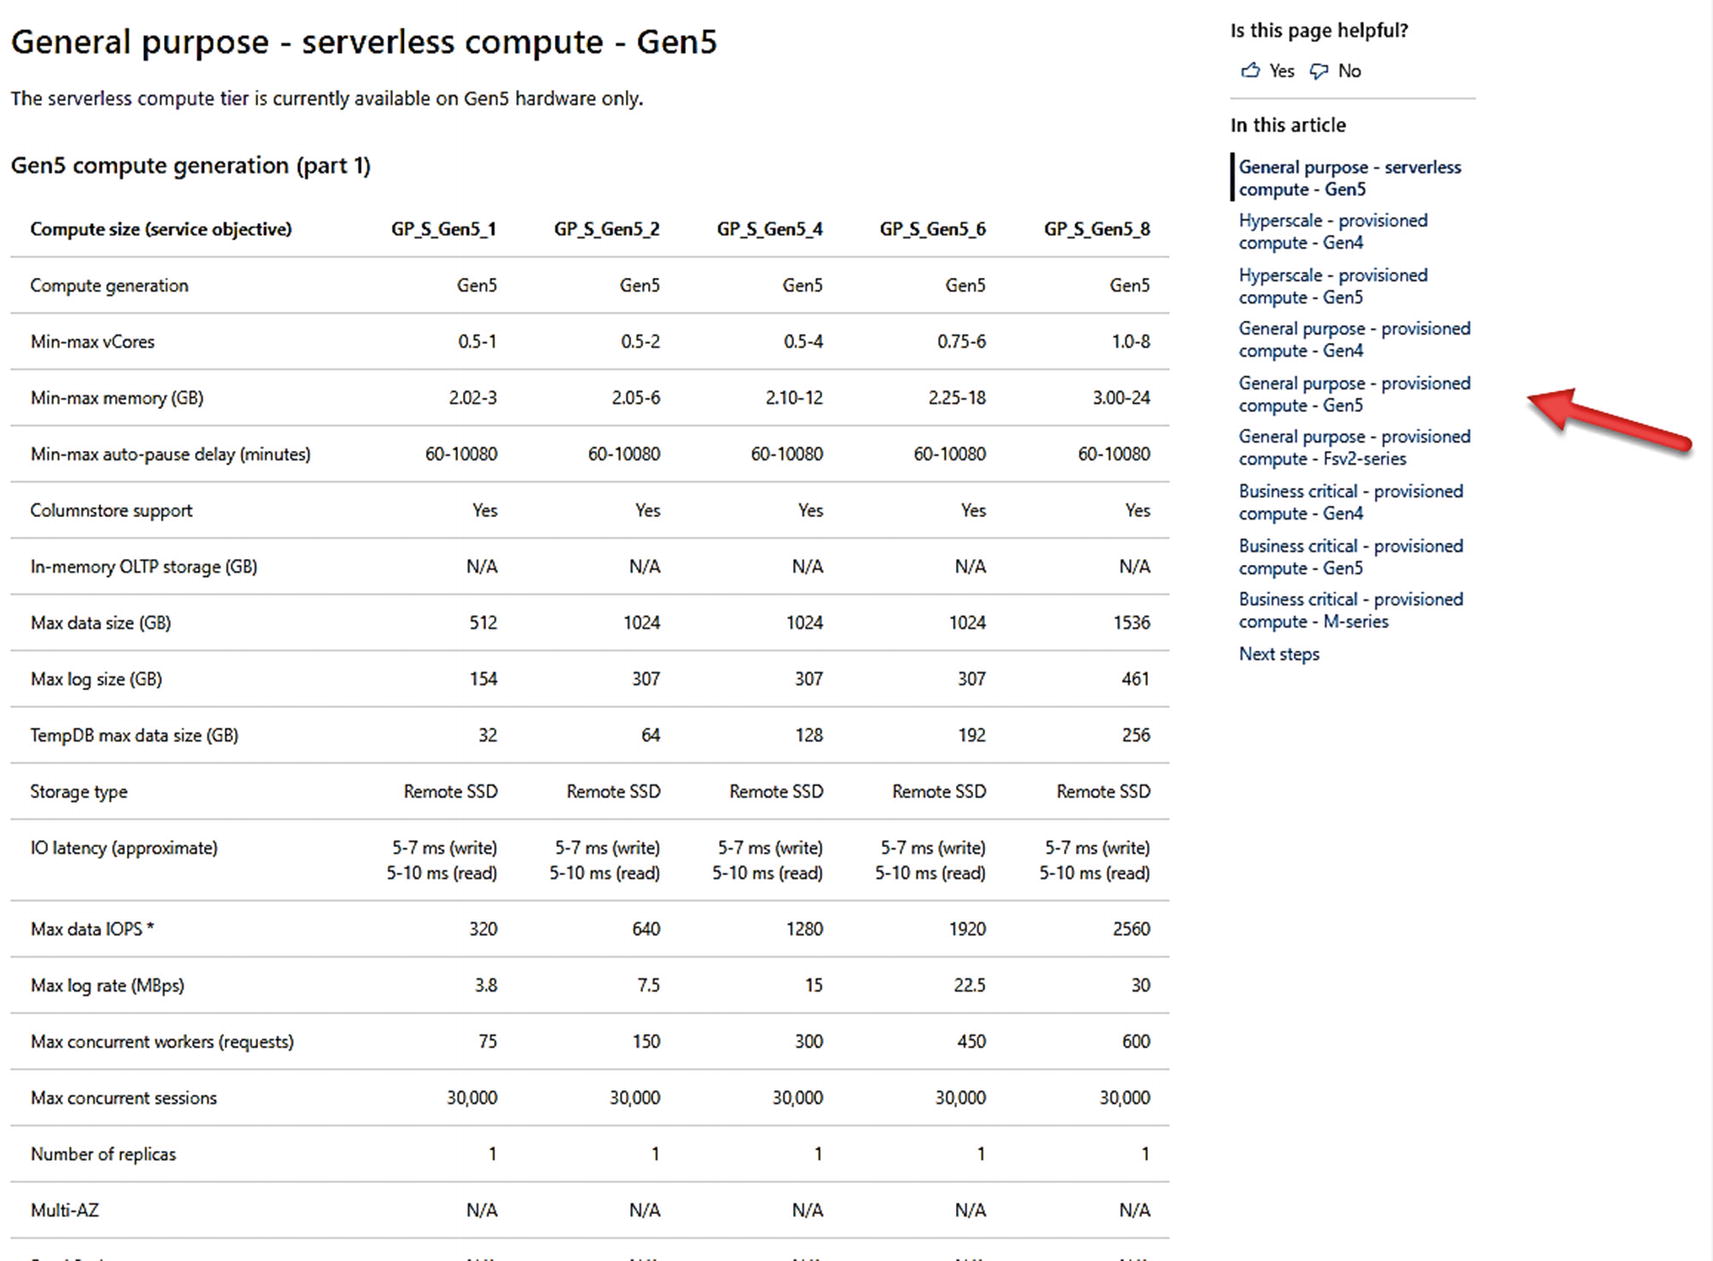
XEvent session to help track queries for Advanced Threat Protection (ATP)
You are the administrator of this SQL Server and have permissions to delete that XEvent session. If you do this, you will effectively disable us from serving you ATP needs. To get the XEvent session back, disable and enable Advanced Data Security from the portal. This session for ATP is part of the solution we use internally. Don’t rely on its definition or output as we may change this in the future.
There is another XEvent session defined which is used for availability purposes called TPS_TdService_session_control. You can look at the event definition but don’t rely on this. We use this internally and may change it in the future. You will also notice the system_health session and AlwaysOn_health session which are normally with any SQL Server. I’ll take more about system_health in Chapter 8 of the book. AlwaysOn_health is not started and not used for a Managed Instance.
Extended Events for Azure SQL Database
Most commonly used Events and Actions are supported. For example, the fundamental event sql_batch_completed is available to you. Azure SQL Database offers ~400 events vs. SQL Server (and Managed Instance) which has around 1800. Use the DMV sys.dm_xe_objects to find out all objects available to you.
File, ring_buffer, and counter targets are supported.
File targets are supported with Azure Blob Storage since you don’t have access to the underlying operating system disks. Here is a blog from the Azure Support team for a step-by-step process to set up Azure Blob Storage as a file target: https://techcommunity.microsoft.com/t5/azure-database-support-blog/extended-events-capture-step-by-step-walkthrough/ba-p/369013.
You can use SSMS or T-SQL to create and start sessions. You can use SSMS to view extended event session target data or the system function sys.fn_xe_file_target_read_file.
The ability with SSMS to View Live Data is not available for Azure SQL Database.
It is important to know that any extended events fired for your sessions are specific to your database and not across the logical server. Therefore, we have a new set of catalog views such as sys.database_event_sessions (definitions) and DMVs such as sys.dm_xe_database_sessions (active sessions).
Take a look through our documentation for a complete list of differences for XEvent between Azure SQL Database and SQL Server: https://docs.microsoft.com/en-us/azure/azure-sql/database/xevent-db-diff-from-svr.
Performance Scenarios
In a galaxy, far, far away when I was in Microsoft Support, my longtime friend Keith Elmore was considered our expert on performance troubleshooting. As we trained other support engineers, Keith came up with an idea that most SQL performance problems could be categorized as either Running or Waiting.
Keith’s work led to a report called the Performance Dashboard reports. That report is now part of the Standard Reports for SQL Server Management Studio. Unfortunately, the report relies on some DMVs which are not exposed for Azure SQL Database. However, the reports will work for Managed Instance.

The Running vs. Waiting for SQL performance
Let’s take a look at more of the details of this figure from the perspective of performance scenarios.
As you look at DMVs in this section, remember that for Azure SQL Database you are only looking at results for a specific database not across all databases for the logical server.
Running vs. Waiting
Running or waiting scenarios can often be determined by looking at overall resource usage. For a standard SQL Server deployment, you might use tools such as Performance Monitor in Windows or top in Linux. For Azure SQL, you can use the following methods:
Azure Portal/PowerShell/Alerts
Azure Monitor has integrated metrics to view resource usage for Azure SQL. You can also set up alerts to look for resource usage conditions such as high CPU percent. Since we have integrated some Azure SQL performance data with Azure Monitor, having alerts is a huge advantage to snapping into the ecosystem. Read more about how to set up alerts with Azure Metrics at https://docs.microsoft.com/en-us/azure/azure-monitor/platform/alerts-metric.

Azure Metric alerts sent via SMS text
sys.dm_db_resource_stats
For Azure SQL Database, you can look at this DMV to see CPU, memory, and I/O resource usage for the database deployment. This DMV takes a snapshot of this data every 15 seconds. The reference for all columns in this DMV can be found at https://docs.microsoft.com/en-us/sql/relational-databases/system-dynamic-management-views/sys-dm-db-resource-stats-azure-sql-database?view=azuresqldb-current. I’ll use this DMV in an example later in this section.
A DMV called sys.resource_stats works within the logical master to review resource stats for up to 14 days across all Azure databases associated with the logical server. Learn more at https://docs.microsoft.com/en-us/sql/relational-databases/system-catalog-views/sys-resource-stats-azure-sql-database?view=azuresqldb-current.
sys.server_resource_stats
This DMV behaves just like sys.dm_db_resource_stats, but it used to see resource usage for the Managed Instance for CPU, memory, and I/O. This DMV also takes a snapshot every 15 seconds. You can find the complete reference for this DMV at https://docs.microsoft.com/en-us/sql/relational-databases/system-catalog-views/sys-server-resource-stats-azure-sql-database?view=azuresqldb-current.
Running
If you have determined the problem is high CPU utilization, this is called a running scenario . A running scenario can involve queries that consume resources through compilation or execution. Further analysis to determine a solution can be done by using these tools:
Query Store
Query Store was introduced with SQL Server 2016 and has been one of the most game-hanging capabilities for performance analysis. Use the Top Consuming Resource reports in SSMS, Query Store catalog views, or Query Performance Insight in the Azure Portal (Azure SQL Database only) to find which queries are consuming the most CPU resources. Need a primer for Query Store? Start with our documentation at https://docs.microsoft.com/en-us/sql/relational-databases/performance/monitoring-performance-by-using-the-query-store.
sys.dm_exec_requests
This DMV has become perhaps the most popular DMV to use for SQL Server in history. This DMV displays a snapshot of all current active requests, which could be a T-SQL query or background task. Use this DMV in Azure SQL to get a snapshot of the state of active queries. Look for queries with a state of RUNNABLE and a wait type of SOS_SCHEDULER_YIELD to see if you have enough CPU capacity. Get the complete reference for this DMV at https://docs.microsoft.com/en-us/sql/relational-databases/system-dynamic-management-views/sys-dm-exec-requests-transact-sql.
sys.dm_exec_query_stats
This DMV can be used much like Query Store to find top resource consuming queries but only is available for query plans that are cached where Query Store provides a persistent historical record of performance. This DMV also allows you to find the query plan for a cached query. Get the complete reference at https://docs.microsoft.com/en-us/sql/relational-databases/system-dynamic-management-views/sys-dm-exec-query-stats-transact-sql.
Since Query Store is not yet available for readable secondaries, this DMV could be useful for those scenarios.
sys.dm_exec_procedure_stats
This DMV provides information much like sys.dm_exec_query_stats, except the performance information can be viewed at the stored procedure level. Get the complete reference at https://docs.microsoft.com/en-us/sql/relational-databases/system-dynamic-management-views/sys-dm-exec-procedure-stats-transact-sql.
Once you determine what query or queries are consuming the most resources, you may have to examine whether you have enough CPU resources for your workload or debug query plans with tools like Lightweight Query Profiling, SET statements, Query Store, or Extended Events tracing.
Waiting
If your problem doesn’t appear to be a high CPU resource usage, it could be the performance problem involves waiting on a resource. Scenarios involving waiting on resources are as follows:
I/O Waits – This includes wait types such as PAGEIOLATCH latches (wait on database I/O) and WRITELOG (wait on transaction log I/O).
Lock Waits – These waits show up as standard “blocking” problems.
Latch Waits – This includes PAGELATCH (“hot” page) or even just LATCH (concurrency on an internal structure).
Buffer Pool limits – If you run out of Buffer Pool, you might run into unexpected PAGEIOLATCH waits.
Memory Grants – A high number of concurrent queries that need memory grants or large grants (could be from overestimation) could result in RESOURCE_SEMAPHORE waits.
Plan Cache Eviction – If you don’t have enough plan cache and plans get evicted, this could lead to higher compile times (which could result in higher CPU) or RUNNABLE status with SOS_SCHEDULER_YIELD because there is not enough CPU capacity to handle compiles. You also might see waiting on locks for schema to compile queries.
To perform analysis on waiting scenarios, you typically look at the following tools:
sys.dm_os_wait_stats
Use this DMV to see what the top wait types for the database or instance are. This can guide you on what action to take next depending on the top wait types. Remember that for Azure SQL Database these are just waits for the database, not across all databases on the logical server. You can view the complete reference at https://docs.microsoft.com/en-us/sql/relational-databases/system-dynamic-management-views/sys-dm-os-wait-stats-transact-sql.
There is a DMV specific to Azure SQL Database called sys.dm_db_wait_stats (it also works with Managed Instance, but I don’t recommend using it given you are looking at the instance) which only shows waits specific for the database. You might find this useful, but sys.dm_os_wait_stats will show all waits for the dedicated instance hosting your Azure SQL Database.
sys.dm_exec_requests
Use this DMV to find specific wait types for active queries to see what resource they are waiting on. This could be a standard blocking scenario waiting on locks from other users.
sys.dm_os_waiting_tasks
Queries that use parallelism use multiple tasks for a given query so you may need to use this DMV to find wait types for a given task for a specific query.
Query Store
Query Store provides reports and catalog views that show an aggregation of the top waits for query plan execution. The catalog view to see waits in Query Store is called sys.query_store_wait_stats which you can read more about at https://docs.microsoft.com/en-us/sql/relational-databases/system-catalog-views/sys-query-store-wait-stats-transact-sql. It is important to know that a wait of CPU is equivalent to a running problem.
Extended Events can be used for any running or waiting scenarios but requires you to set up an extended events session to trace queries and can be considered a heavier method to debug a performance problem.
The logical server bwazuresqlserver as well as the database bwazuresqldb. This database was deployed as a General Purpose 2 vCore database.
The Azure VM called bwsql2019. I left my security settings from Chapter 6 so this VM has access to the logical server and database.
I’ll use SQL Server Management Studio (SSMS) to run some queries and look at Query Store Reports.
If you connect with SSMS to an Azure SQL Database logical server and with SSMS choose a specific database, Object Explorer will only show you the logical master and your database. If you connect to the logical master with a server admin account, Object Explorer will show you all databases.
I’ll use the Azure portal to view Azure Metrics and look at logs.
For this chapter, I have script files you can use for several of the examples. You can find scripts for this example (and the next one) in the ch7_performancemonitor_and_scale folder for the source files included for the book. I will also use the very popular tool ostress.exe for exercises in this chapter which comes with the RML Utilities. You can download RML from www.microsoft.com/en-us/download/details.aspx?id=4511. Make sure to put the folder where RML gets installed in your system path (which is by default C:Program FilesMicrosoft CorporationRMLUtils).
Let’s go through an example in a step-by-step fashion:
In some of these examples, you may see a different database name than I deployed. I’ve run these exact examples with different database names so you might see some different context in figures in this chapter.
- 1.
Set up to monitor Azure SQL Database with a DMV query.
Tip To open a script file in the context of a database in SSMS, click the database in Object Explorer and then use the File/Open menu in SSMS.
Launch SQL Server Management Studio (SSMS) and load a query in the context of the database to monitor the Dynamic Management View (DMV) sys.dm_exec_requests from the script dmexecrequests.sql which looks like this:SELECT er.session_id, er.status, er.command, er.wait_type, er.last_wait_type, er.wait_resource, er.wait_timeFROM sys.dm_exec_requests erINNER JOIN sys.dm_exec_sessions esON er.session_id = es.session_idAND es.is_user_process = 1; - 2.
Load another query to observe resource usage.
In another session for SSMS in the context of the database, load a query to monitor a Dynamic Management View (DMV) unique to Azure SQL Database called sys.dm_db_resource_stats from a script called dmdbresourcestats.sql:
SELECT * FROM sys.dm_db_resource_stats;This DMV will track overall resource usage of your workload against Azure SQL Database such as CPU, I/O, and memory.
- 3.
Edit the workload script.
Edit the script sqlworkload.cmd (which will use the ostress.exe program).
I’ll substitute my server, database, and password. The script will look like this (without password substitution):ostress.exe -Sbwazuresqlserver.database.windows.net -itopcustomersales.sql -Uthewandog -dbwazuresqldb -P<password> -n10 -r2 -q - 4.Examine the T-SQL query we will use for the workload. You can find this T-SQL batch in the script topcustomersales.sql:DECLARE @x intDECLARE @y floatSET @x = 0;WHILE (@x < 10000)BEGINSELECT @y = sum(cast((soh.SubTotal*soh.TaxAmt*soh.TotalDue) as float))FROM SalesLT.Customer cINNER JOIN SalesLT.SalesOrderHeader sohON c.CustomerID = soh.CustomerIDINNER JOIN SalesLT.SalesOrderDetail sodON soh.SalesOrderID = sod.SalesOrderIDINNER JOIN SalesLT.Product pON p.ProductID = sod.ProductIDGROUP BY c.CompanyNameORDER BY c.CompanyName;SET @x = @x + 1;ENDGO
This database is not large, so the query to retrieve customer and their associated sales information ordered by customers with the most sales shouldn’t generate a large result set. It is possible to tune this query by reducing the number of columns from the result set, but these are needed for demonstration purposes of this activity. You will note in this query I don’t return any results to the client but assign values to a local variable. This will put all the CPU resources to run the query to the server.
- 5.Now let’s run the workload and observe its performance and results from queries we loaded earlier. Run the workload by executing the sqlworkload.cmd script from a command shell or PowerShell. The script uses ostress to simulate ten concurrent users running the T-SQL batch. You should see output that looks similar to this:[datetime] [ostress PID] Max threads setting: 10000[datetime] [ostress PID] Arguments:[datetime] [ostress PID] -S[server].database.windows.net[datetime] [ostress PID] -isqlquery.sql[datetime] [ostress PID] -U[user][datetime] [ostress PID] -dbwazuresqldb[datetime] [ostress PID] -P********[datetime] [ostress PID] -n10[datetime] [ostress PID] -r2[datetime] [ostress PID] -q[datetime] [ostress PID] Using language id (LCID): 1024 [English_United States.1252] for character formatting with NLS: 0x0006020F and Defined: 0x0006020F[datetime] [ostress PID] Default driver: SQL Server Native Client 11.0[datetime] [ostress PID] Attempting DOD5015 removal of [directory]sqlquery.out][datetime] [ostress PID] Attempting DOD5015 removal of [directory]sqlquery_1.out][datetime] [ostress PID] Attempting DOD5015 removal of [directory]sqlquery_2.out][datetime] [ostress PID] Attempting DOD5015 removal of [directory]sqlquery_3.out][datetime] [ostress PID] Attempting DOD5015 removal of [directory]sqlquery_4.out][datetime] [ostress PID] Attempting DOD5015 removal of [directory]sqlquery_5.out][datetime] [ostress PID] Attempting DOD5015 removal of [directory]sqlquery_6.out][datetime] [ostress PID] Attempting DOD5015 removal of [directory]sqlquery_7.out][datetime] [ostress PID] Attempting DOD5015 removal of [directory]sqlquery_8.out][datetime] [ostress PID] Attempting DOD5015 removal of [directory]sqlquery_9.out][datetime] [ostress PID] Starting query execution...[datetime] [ostress PID] BETA: Custom CLR Expression support enabled.[datetime] [ostress PID] Creating 10 thread(s) to process queries[datetime] [ostress PID] Worker threads created, beginning execution...
- 6.
Now use the DMVs that you loaded to observe performance while this runs. First, run the query from dmexecrequests.sql five or six times in the query window from SSMS. You will see several users have status = RUNNABLE and last_wait_type = SOS_SCHEDULER_YIELD. This is a classic signature of not having enough CPU resources for a workload.
- 7.
Observe the results from the query dmdbresourcestats.sql. Run this query a few times and observe the results. You will see several rows with a value for avg_cpu_percent close to 100%. sys.dm_db_resource_stats takes a snapshot every 15 seconds of resource usage.
- 8.
Let the workload complete and take note of its duration. For me, it measured around 1 minute and 30 seconds.
- 9.Let’s use the Query Store now to dive deeper into the performance the queries in this workload. In SSMS in the Object Explorer, load the Top Resource Consuming Queries as seen in Figure 7-6.
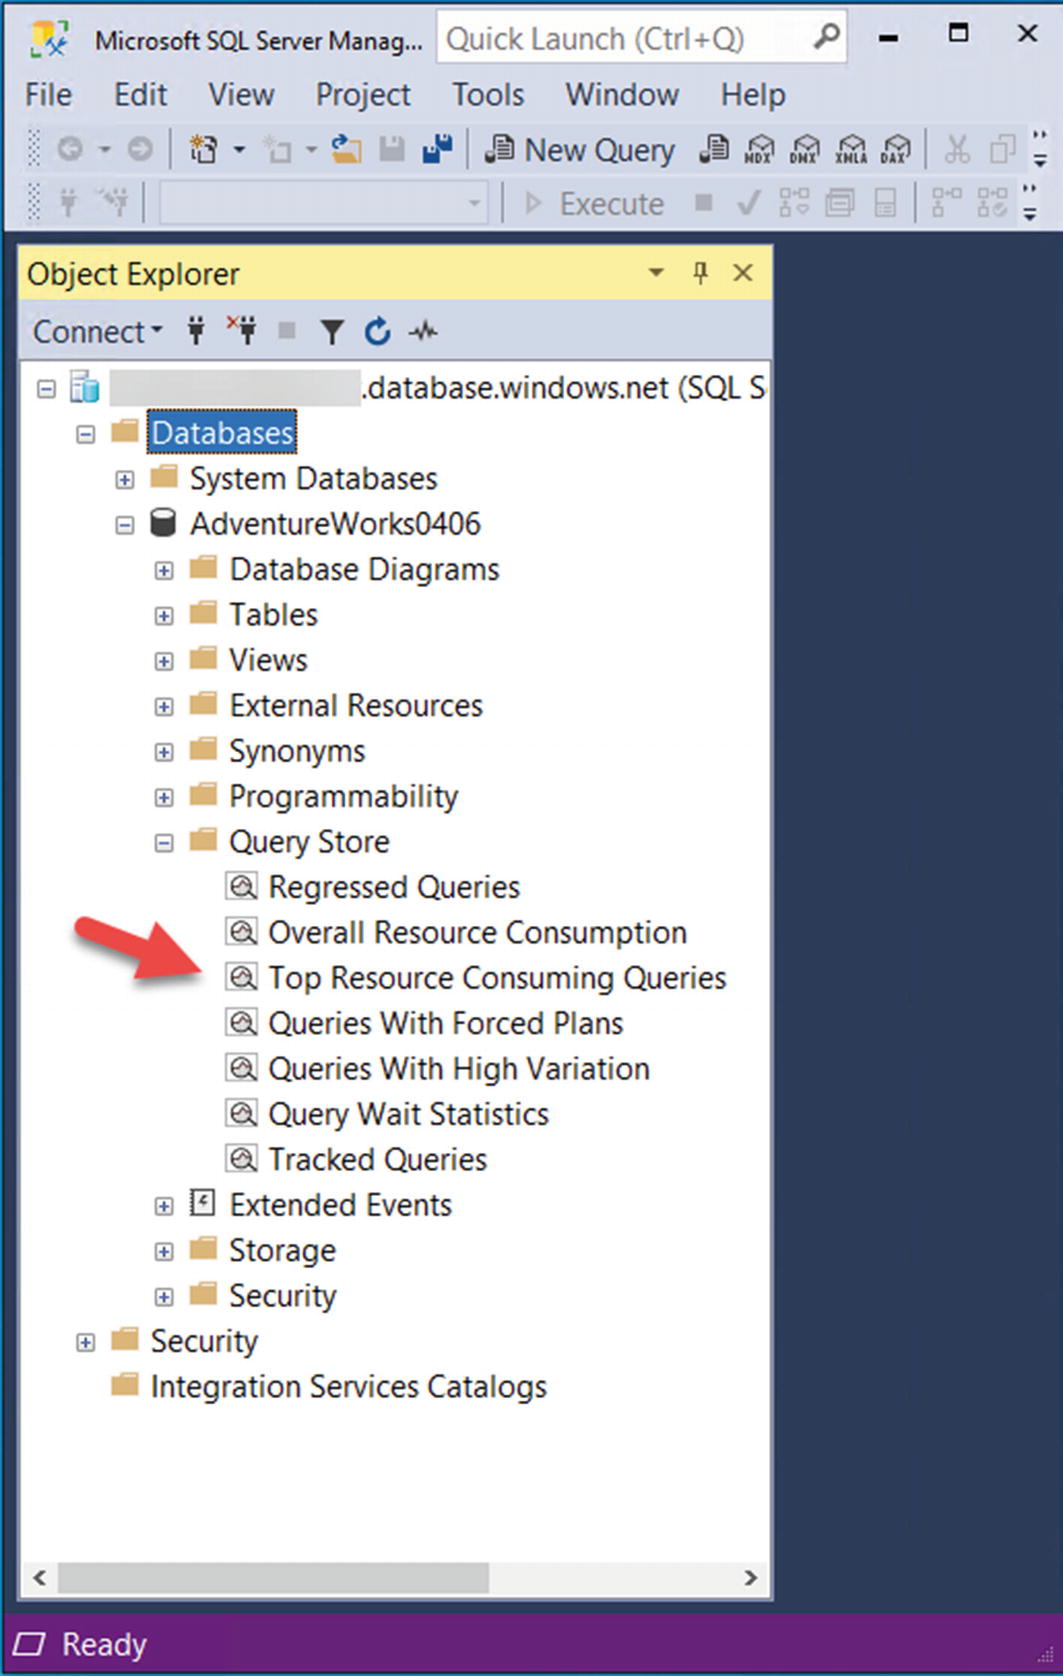 Figure 7-6
Finding the Top Consuming Queries report for Query Store
- 10.
Dive into the details of this report to see the performance of the workload.
Select the report to find out what queries have consumed the most average resources and execution details of those queries. Based on the workload run to this point, your report should look something like Figure 7-7.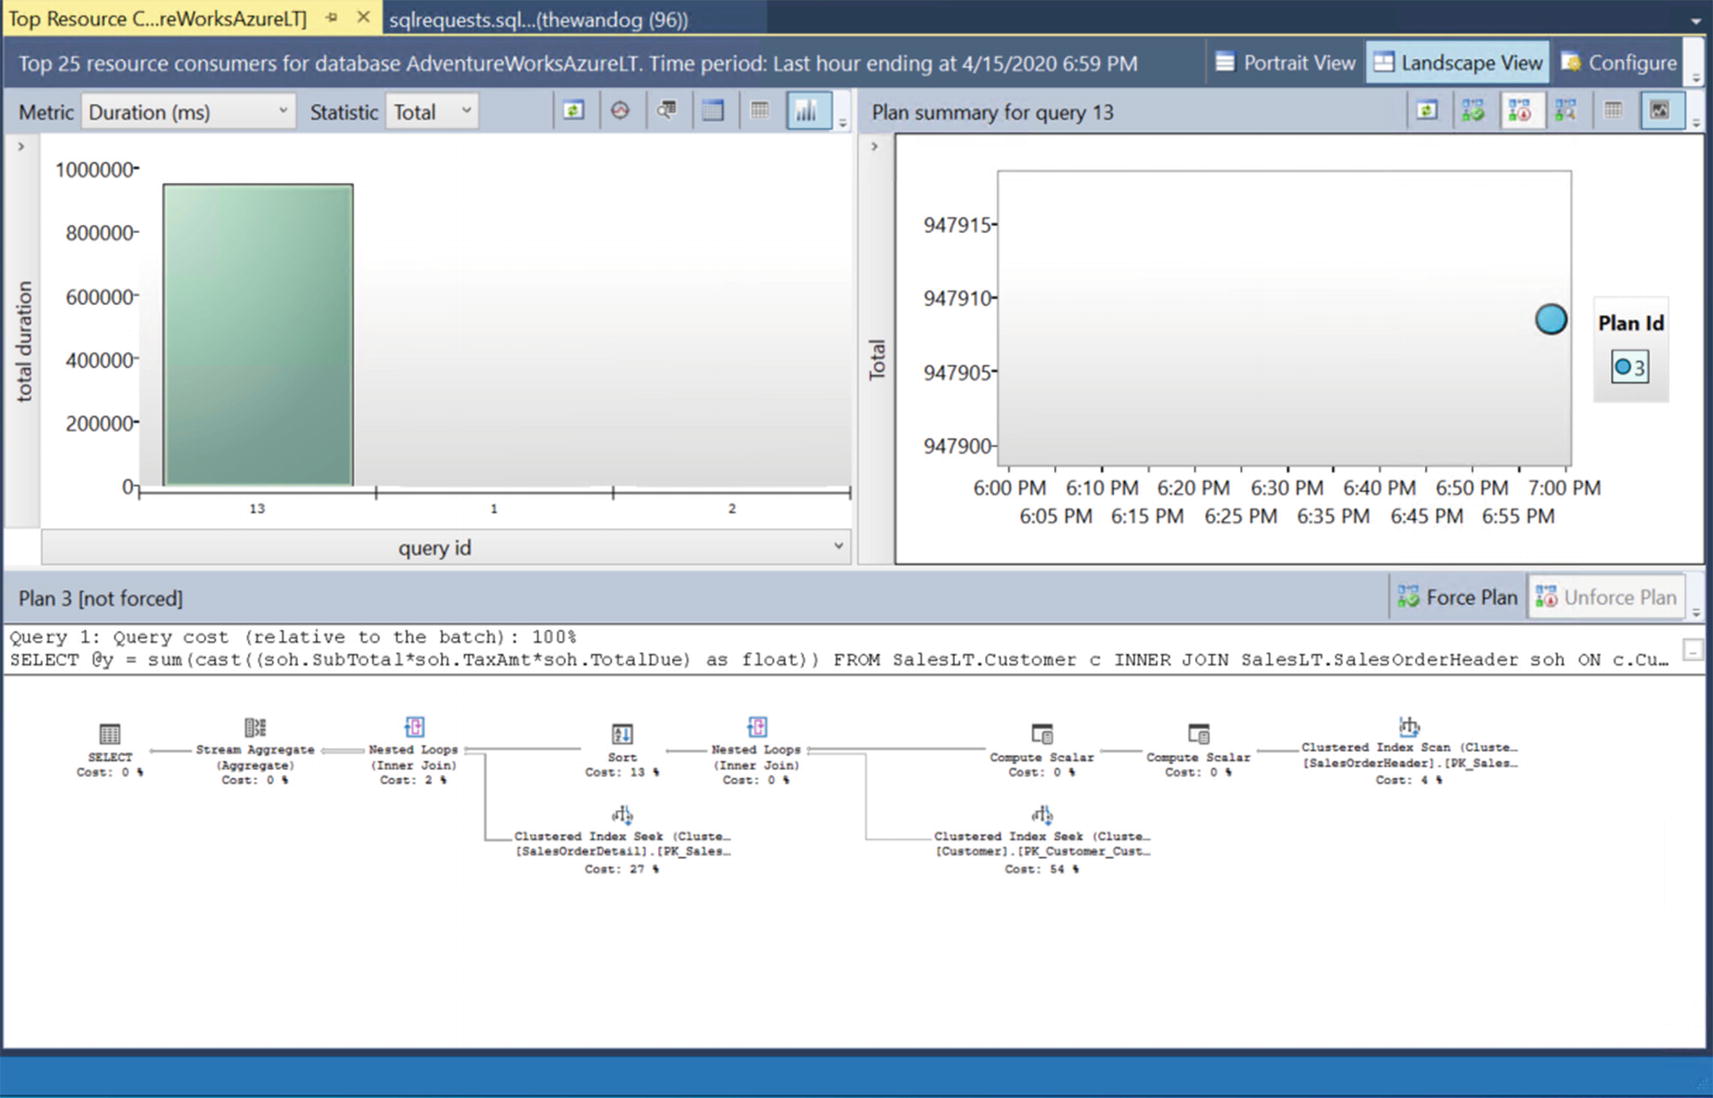 Figure 7-7
The Top Consuming Queries Report in SSMS
query_id from the Top Resource Consuming Query report

Query stats for a query plan
- 11.
Look at the Query Wait Statistics Report for the Query Store.
Based on the decision tree earlier in this chapter, this appears to be a running scenario. If the query plan can’t be tuned, how can we make the query run faster? The Query Wait Statistics report could help give us a clue (along with the DMV results we have already observed).
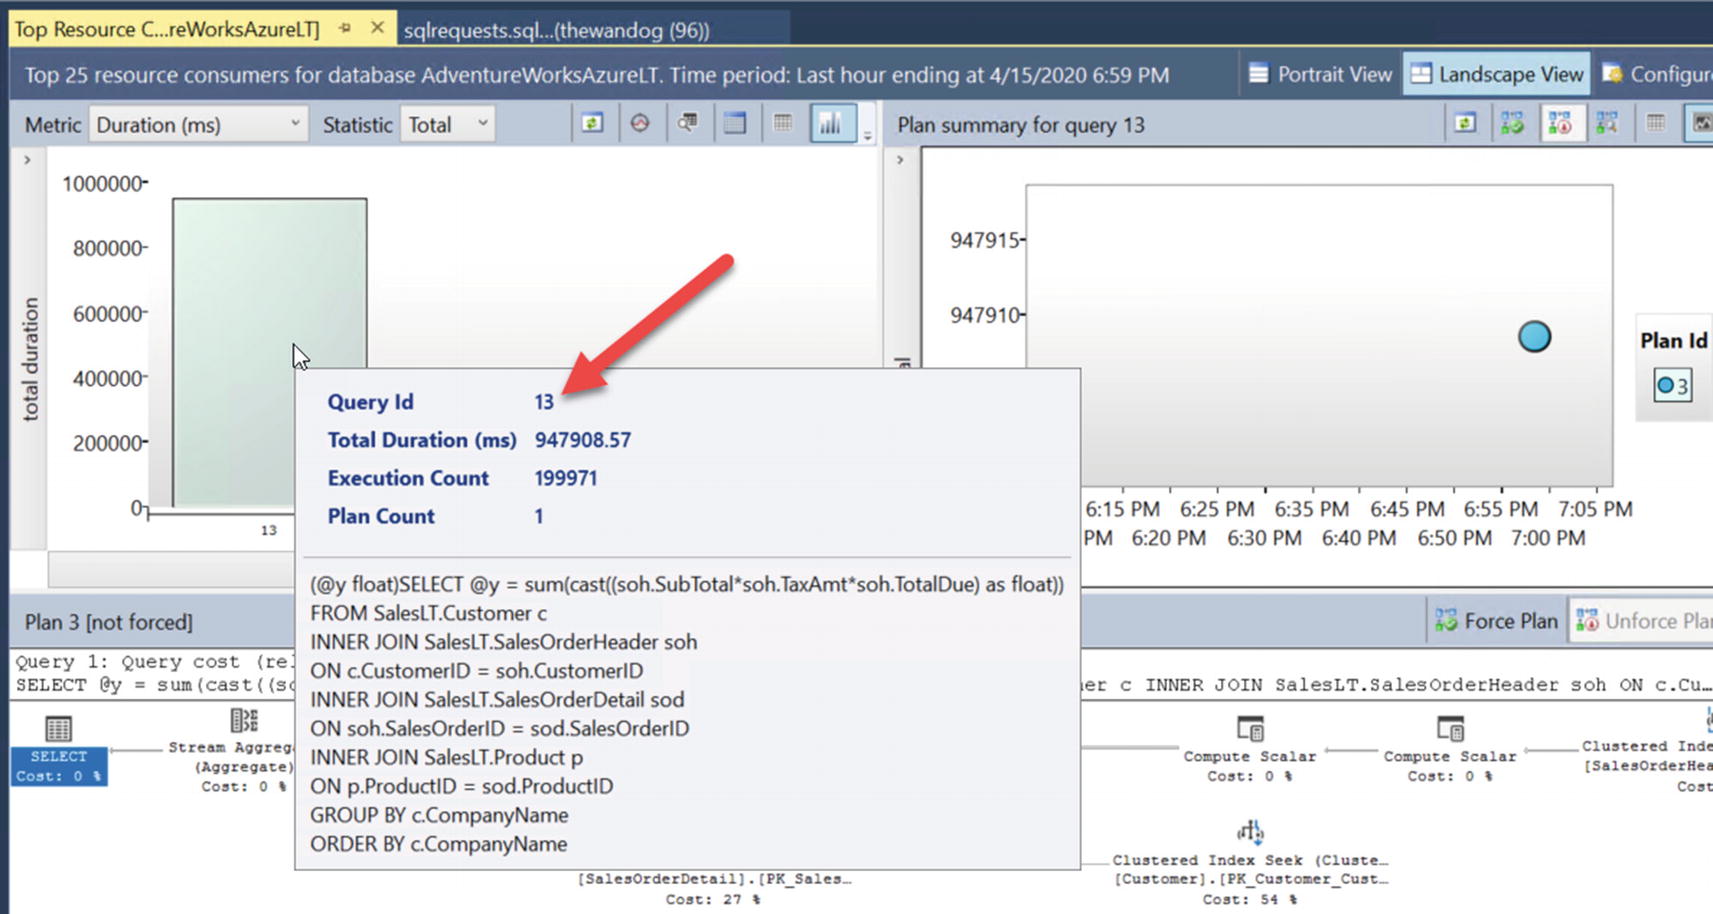
If you then select Query Wait Statistics report from the Object Explorer and hover over the Bar Chart that says CPU, you will see something like Figure 7-10. Figure 7-10
Query Wait Statistic report from SSMS
So the top wait category is CPU, and the average time waiting for this wait type is almost 4ms. A wait category of CPU is equivalent to a wait type = SOS_SCHEDULER_YIELD.

Average wait time for CPU for a specific query
- 12.
Use Azure Monitor and metrics.
Let’s look at this performance scenario through the lens of Azure Monitor and metrics. I’ll navigate to my database using the Azure portal. In the monitoring pane is an area called Compute utilization. After my workload has run, my chart looks similar to Figure 7-12.
Note I grabbed these numbers from a different test I had already done using databases just like bwazuresqldb called AdventureWorks0406 and AdventureWorksLT.

Viewing CPU utilization from the Azure portal
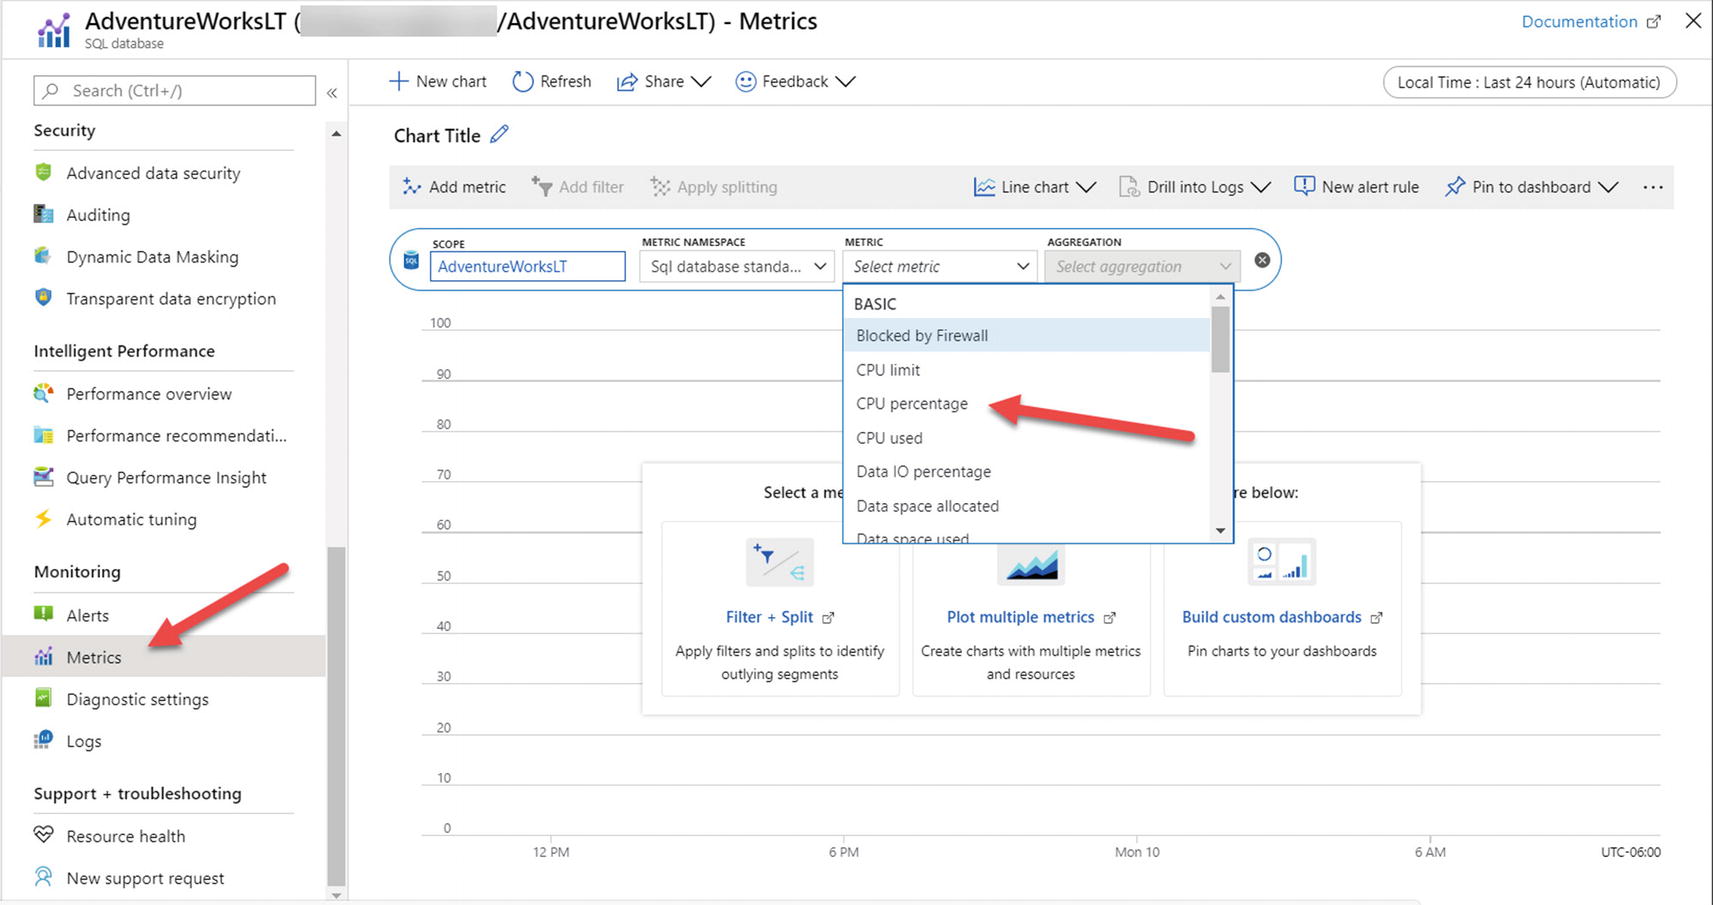
Azure metrics for an Azure SQL Database

Granular view of Azure Metrics
- 13.
Use Azure Monitor Logs.
I’ve mentioned Azure Monitor includes another capability called Azure Monitor Log. Azure Monitor Logs can provide a longer historical record than Metrics.
Note There is a delay in seeing results in Logs, so it may take several minutes for you to see results like this figure.
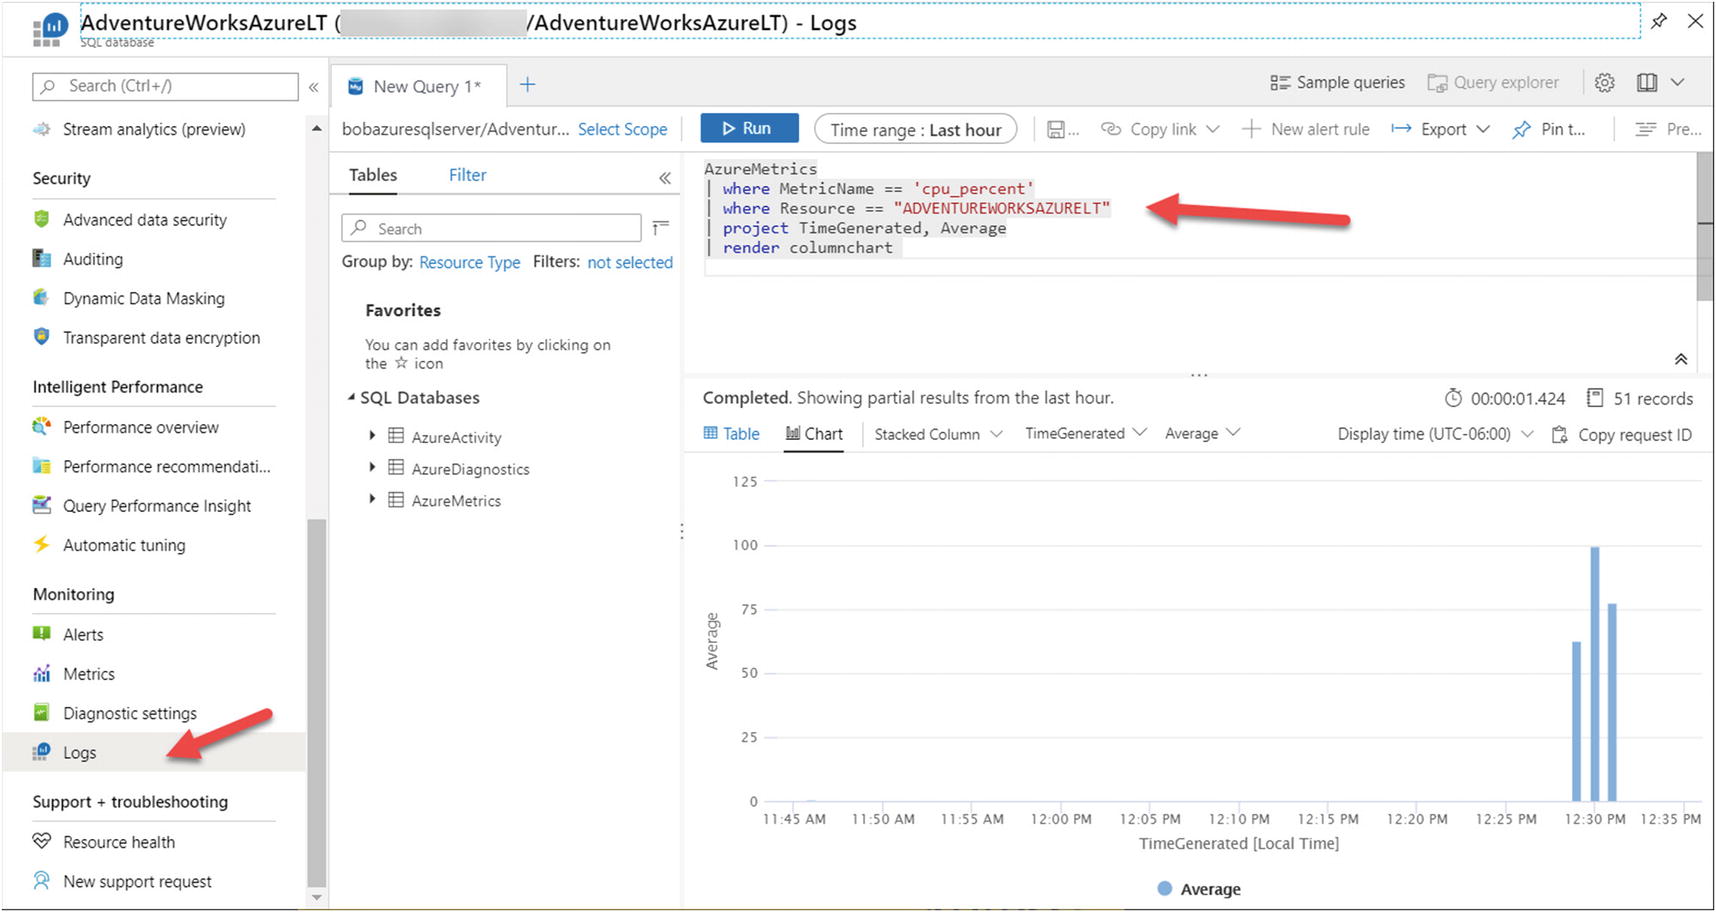
Using Kusto to view resource usage from Azure Monitor Logs
I’ve talked about Kusto in the book before, but here is a link for you to learn more: https://docs.microsoft.com/en-us/azure/data-explorer/kusto/concepts/. There is another tool you can use to run Kusto queries is Kusto Explorer which you can read more about at https://docs.microsoft.com/en-us/azure/data-explorer/kusto/tools/kusto-explorer. At the time I was writing this chapter, we plan to bring the Kusto query experience to Azure Data Studio!
Azure SQL Specific Performance Scenarios
Based on the Running vs. Waiting scenario, there are some scenarios which are specific to Azure SQL.
Log Governance
LOG_RATE_GOVERNOR – Waits for Azure SQL Database
POOL_LOG_RATE_GOVERNOR – Waits for Elastic Pools
INSTANCE_LOG_GOVERNOR – Waits for Azure SQL Managed Instance
HADR_THROTTLE_LOG_RATE* – Waits for Business Critical and Geo-Replication latency
Log rate governance is enforced inside the SQL Server engine before transaction log blocks are submitted for I/O. The documentation has a good description of how this works at https://docs.microsoft.com/en-us/azure/azure-sql/database/resource-limits-logical-server#transaction-log-rate-governance. Scaling your deployment to a different service tier or vCore choice can give you more log rate for your application.
Worker Limits
- Azure SQL Database has limits based on service tier and size. If you exceed this limit, a new query will receive an error likeMsg 10928The request limit for the database is <limit> and has been reached.
Azure SQL Managed Instance uses “max worker threads” so workers past this limit may see THREADPOOL waits.
Managed Instance in the future may enforce worker limits similar to Azure SQL Database.
Business Critical (BC) HADR Waits
Let’s say you deploy a Business Critical service tier for Azure SQL Managed Instance or Azure SQL Database. Now you start running transactions that modify data and therefore require logged changes.
You look at a DMV like sys.dm_exec_requests and see wait types like HADR_SYNC_COMMIT. What? This wait type is only seen when you deploy a sync replica for an Always On Availability Group (AG).
It turns out Business Critical service tiers uses an AG behind the scenes. Therefore, it is not surprising to see these wait types normally, but it may surprise you if you are monitoring wait types.
You can also see HADR_DATABASE_FLOW_CONTROL and HADR_THROTTLE_LOG_RATE_SEND_RECV waits as part of Log Governance to ensure we can meet your promised SLA.
Hyperscale Scenarios
I’ve talked about the Hyperscale architecture briefly in Chapter 4 of the book. I’ll go even deeper in Chapter 8. While Hyperscale has log rate limits just like other deployment options, there are cases where we must govern transaction log generation due to a page server or replica getting significantly behind (which would then affect our ability to deliver our SLA). When this occurs, you may see wait types that start with the word RBIO_.
Even though we don’t dive into the details of how to diagnose various aspects of the Hyperscale architecture in this book, there are interesting capabilities for you to take advantage of. For example, reads from page servers are now available in DMVs like sys.dm_exec_query_stats, sys.dm_io_virtual_file_stats, and sys.query_store_runtime_stats. In addition, the I/O statistics in sys.dm_io_virtual_file_stats apply to RBEX cache and page servers since these are the I/O files that mostly affect Hyperscale performance.
Get all the details for Hyperscale performance diagnostics at https://docs.microsoft.com/en-us/azure/azure-sql/database/hyperscale-performance-diagnostics.
Accelerating and Tuning Performance
You have seen performance capabilities for Azure SQL including monitoring tools. You have also seen an example of how to apply your knowledge of monitoring and a performance scenario to recognize a possible performance bottleneck. Let’s apply that knowledge to learn how to accelerate and tune performance in the areas of scaling CPU capacity, I/O performance, memory, application latency, and SQL Server performance tuning best practices.
Scaling CPU Capacity
Let’s say you ran into the performance problem with high CPU as I showed you in the previous exercise in your data center. What would you do? If you were running SQL Server on a bare-metal server, you would have to potentially acquire more CPUs or even move to another server. For a virtual machine, you may be able to reconfigure the VM to get more vCPUs, but what if the host server didn’t support that? You are possibly facing a scenario to migrate your database to another VM on another host. Ouch.
For Azure SQL, you have the ability to scale your CPU resources with very simple operations from the Azure portal, az CLI, PowerShell, and even T-SQL. And you can do all of this with no database migration required.
For Azure SQL Database, there will be some small downtime to scale up your CPU resources. It is possible with larger database sizes this downtime could be longer, especially if we need to move your deployment to another host with enough resources for your request. We also have to ensure your replicas have the same new resources for Business Critical service tiers. Hyperscale provides a more constant scaling motion regardless of database size.
Azure SQL Managed Instance can be a concern for duration of scaling. We may need to build a new virtual cluster, so scaling operations can be significantly longer. This is something to keep in mind and is why deploying with the right resources for Managed Instance can be important. Managed Instance pools are much faster but still significantly longer than Azure SQL Database in most cases.
Azure SQL Database Serverless compute tier provides the concept of autoscaling as I described its implementation in Chapter 4 of the book.
- 1.
Look at scaling options in the Azure portal.
I’ll navigate to my database in the Azure portal and select Pricing tier as seen in Figure 7-16. Figure 7-16
Choosing a pricing or service tier for a General Purpose database

Using the Azure portal to increase vCores
- 2.
Scale vCores using T-SQL.
Let’s use a more familiar method to make changes to SQL Server. The T-SQL ALTER DATABASE statement has been enhanced for Azure SQL Database to scale CPUs for the deployment.
To properly show a performance difference with Query Store reports, I’m going to flush the current data in memory in the Query store using the script flushquerystore.sql which executes this T-SQL statement:
You are seeing the same information you saw in the Azure portal regarding CPUs, but sys.dm_user_db_resource_governance effectively gives us a way to programmatically look at resource limits you would read in our tables in the documentation.
The system function DATABASEPROPERTYEX has also been enhanced to show you the ServiceObjective for a database.
You can decode the information from the slo_name column (slo = service-level objective) or the system function. For example, SQLDB_GP_GEN5_2_SQLG5 is equivalent to General Purpose Gen5 Hardware 2 vCores. SQLDB_OP… is used for Business Critical.
We can use the T-SQL ALTER DATABASE documentation to see all possible values for the service objective at https://docs.microsoft.com/en-us/sql/t-sql/statements/alter-database-transact-sql.
This statement executes immediately because the modification to scale to 8 vCores is an option that happens in the background.
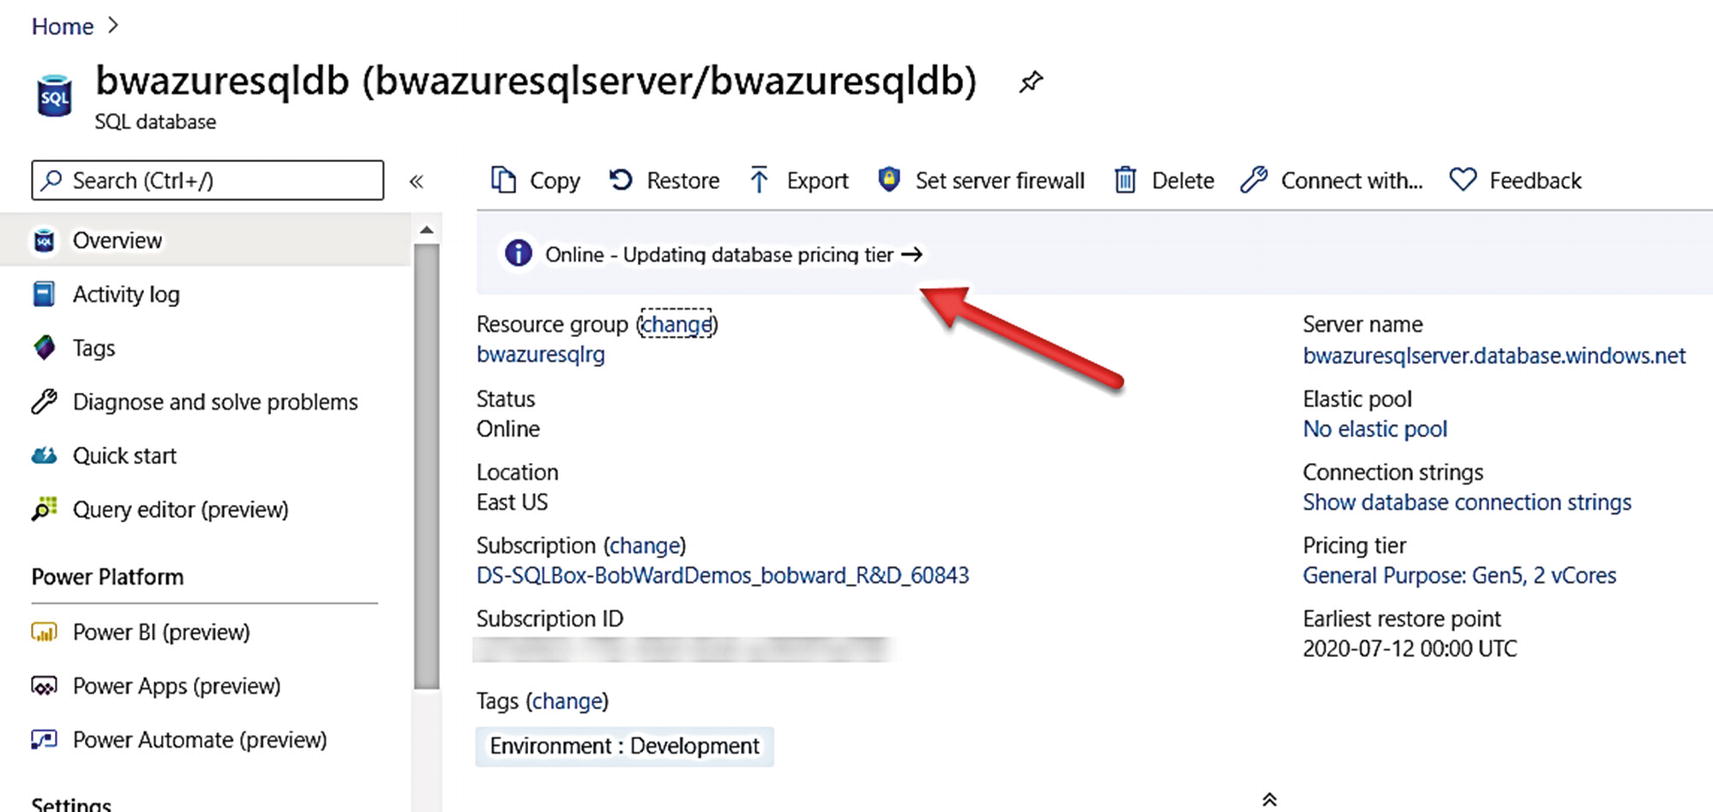
Scaling of Azure SQL Database in progress
- 3.
Run the workload again.
Let’s run the workload again to see if there is any performance differences. I’ll use the same scripts, queries, and SSMS reports as I did in the previous example in the chapter.
Run the script sqlworkload.cmd again from the command prompt.
- 4.
Observe resource usage with sys.dm_db_resource_stats.
Just as you did before running this query, several times should show a lower overall CPU usage for the database.
- 5.
Observe active queries with sys.dm_exec_requests.
You should see more RUNNING requests and less SOS_SCHEDULER_YIELD waits.
- 6.
Observe the overall workload duration.
Remember this ran in around 1 minute and 30 seconds before. Now it should finish in around 25–30 seconds – clearly, a significant performance improvement.
- 7.
Observe performance with Query Store Top Consuming Reports.
Using the same report as before, you can see two queries in the report with a new query_id as seen in Figure 7-19. Figure 7-19
Top Consuming Query report with a faster query
Even though there is a new query_id, it is the exact same query. Because the SQL Server that hosts our database was restarted for scaling (or a new SQL Server used), the query had to be recompiled, hence a new query_id. This scenario is also where the power of Query Store comes into play. Query performance is stored in the user database, so even if we had to migrate your SQL Server behind the scenes to a new node, no query performance information is lost.
The behavior of a different query_id is actually very interesting. The query was recompiled, but in many cases, the same query_id would appear in the Query Store. However, in this case, the first execution of the query was against a 2 vCore deployment. In a 2 vCore deployment, maxdop is fixed at 1. When the back-end server has a fixed maxdop of 1, queries will use a context setting with a bit that is NOT set for Parallel Plan. With a deployment of 8 vCores, maxdop is fixed at 8. In this case, the context_setting will include the bit set for Parallel Plan. Parallel Plan is not an option set by the application but rather by a negotiation with the server and indicates the query can use a parallel plan. In this case, the query_id is different because the context_settings_id (see the catalog view sys.query_store_query) is different for each execution. You can view context settings in the Query Store using the catalog view sys.query_context_settings. You can see more about context settings “bits” in the DMV sys.dm_exec_plan_attributes.
- 8.
Look at Query Wait Statistics report.
If you use the Query Wait Statistics report, you can see a significant less time waiting on CPU for the query as seen in Figure 7-20.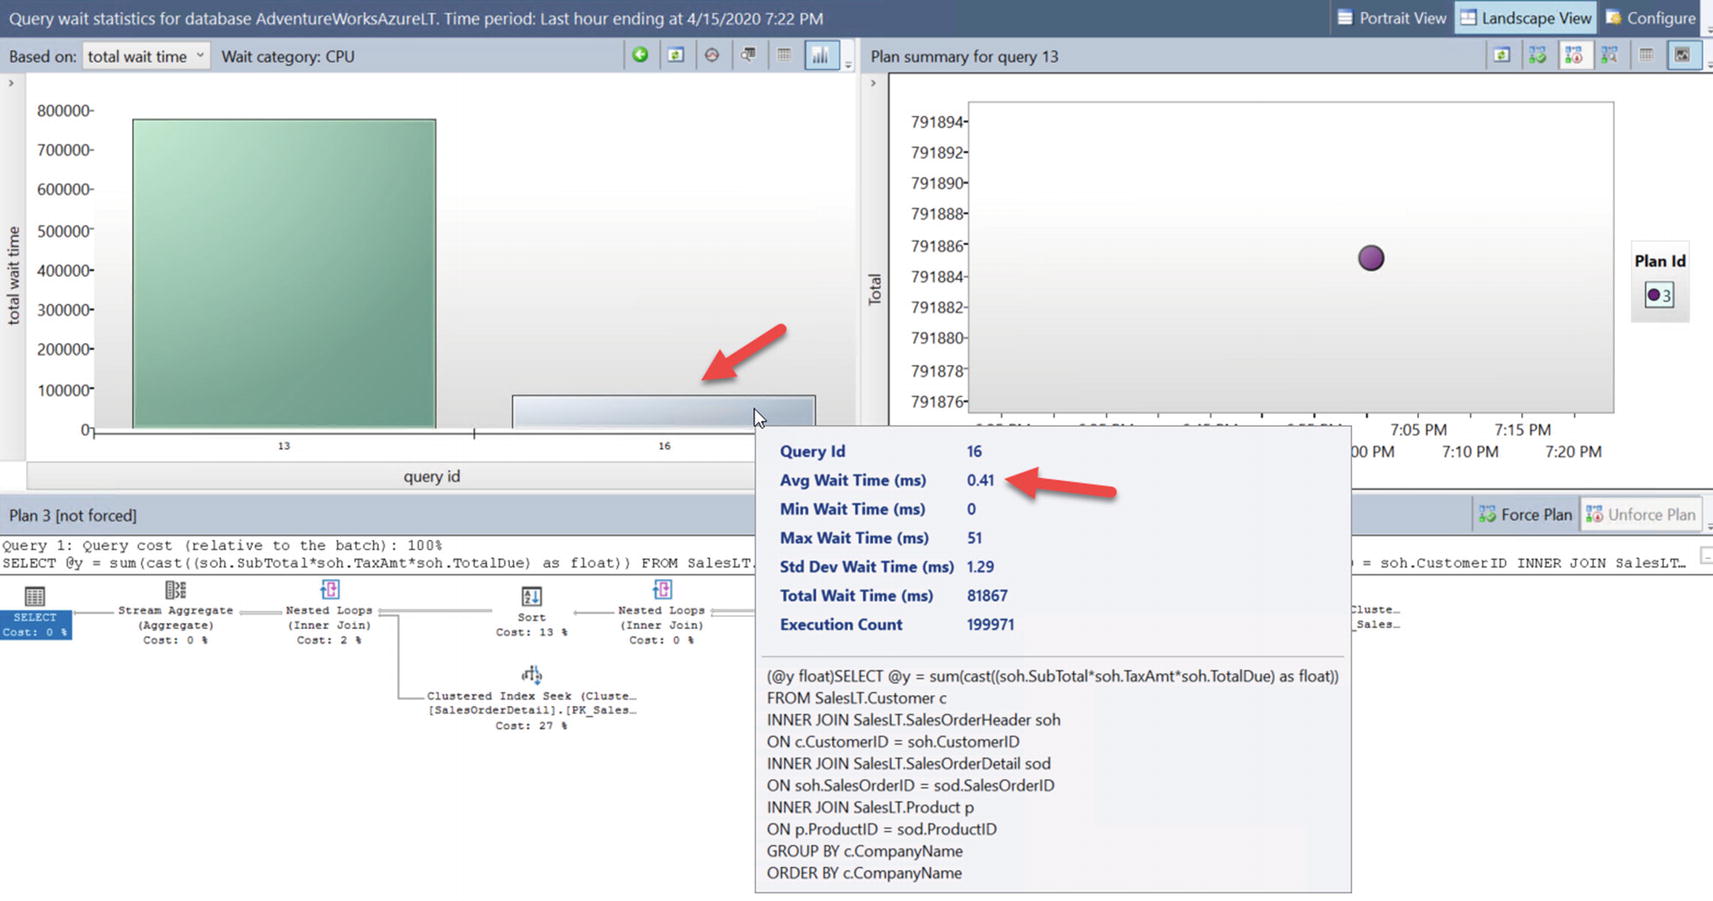 Figure 7-20
Faster query with less waiting on CPU
- 9.
Look at differences with Azure Metrics and Logs.
Let’s navigate to the Azure portal to see the difference in compute utilization. Figure 7-21 shows the example.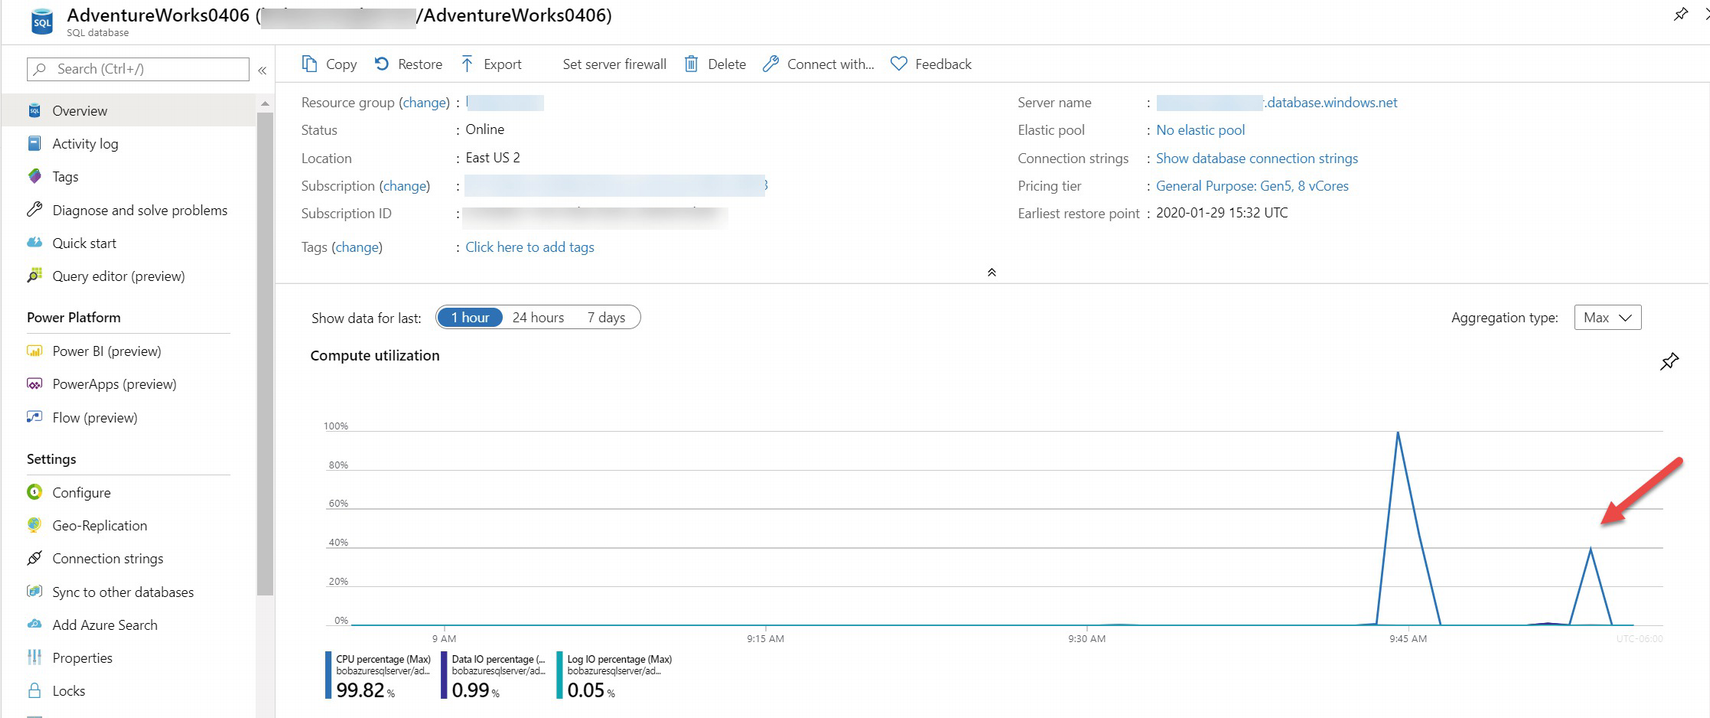 Figure 7-21
Azure compute after scaling CPUs

Using Kusto with Azure logs after scaling CPUs
What happens if we were to use the Serverless compute tier option for our workload? Remember Serverless offers the ability to autoscale workloads and also pause idle compute.
I deployed a new Serverless database with a min vCore = 2 and max vCore = 8. Turns out in most cases (not guaranteed), a Serverless database is deployed with the number of SQL Schedulers = max vCores. So provided the Serverless database is not paused, running the same workload as in this example gives you approximately the same performance as the scaled General Purpose 8 vCore deployment. Here is the big advantage of Serverless over the General Purpose deployment. Let’s say over a period of two hours, this workload only consumes compute for 15 minutes of the 120 minutes. For a General Purpose deployment, you will pay for compute for the entire 120 minutes. For a Serverless deployment, you would pay for the 15 minutes of compute usage for 8 vCores, and for the remaining 90 minutes, you would pay for the equivalent compute usage for the min vCores. In addition, if you have AutoPause enabled, you will not pay for any compute costs for the last 60 minutes of that two-hour period (this is because the smallest time before a Serverless deployment is paused if idle is one hour).
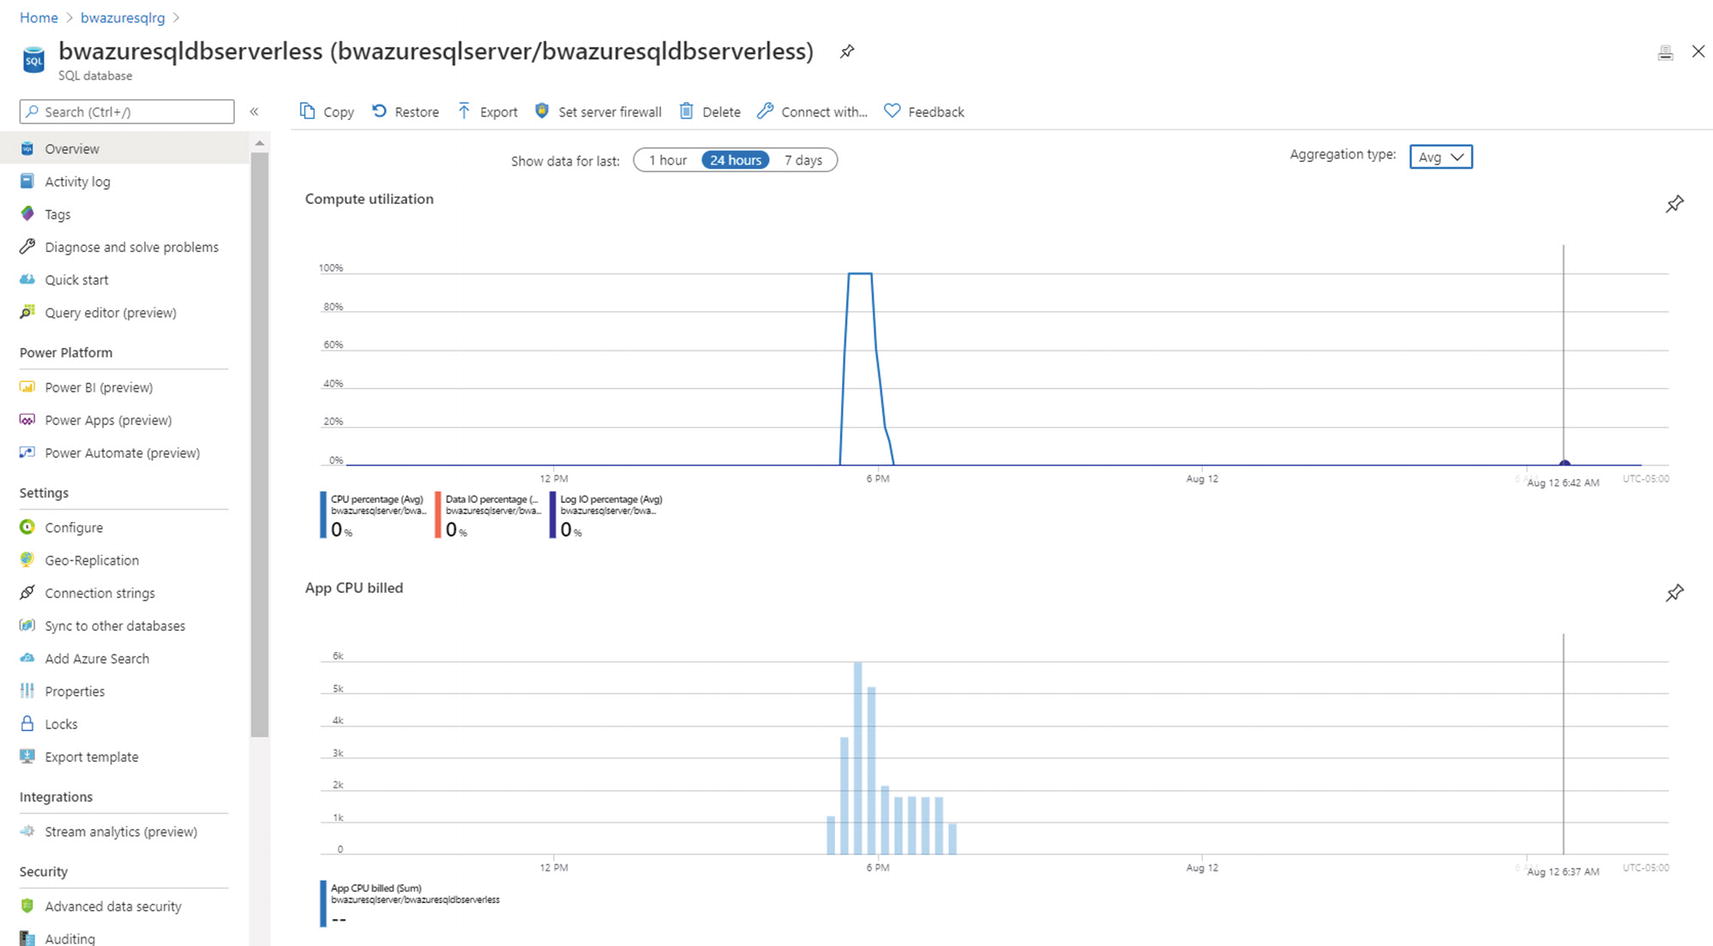
Serverless scale and compute billing
I/O Performance
I/O performance can be critical to SQL Server applications and queries. Azure SQL abstracts you from physical file placement, but there are methods to ensure you get the I/O performance you need.
Input/Output Per Second (IOPS) may be important to your application. Be sure you have chosen the right service tier and vCores for your IOPS needs. Understand how to measure IOPS for your queries on-premises if you are migrating to Azure (Hint: Look at Disk Transfers/sec in Performance Monitor). If you have restrictions on IOPS, you may see long I/O waits. Scale up vCores or move to Business Critical or Hyperscale if you don’t have enough IOPS.
I/O latency is another key component for I/O performance. For faster I/O latency for Azure SQL Database, consider Business Critical or Hyperscale. For faster I/O latency for Managed Instance, move to Business Critical or increase file size or number of files for the database.
Let’s take a minute to examine this last statement a bit more closely for Managed Instance and file size or number of files. I’ve pointed you to this blog post from Jovan Popovic before on the topic at https://medium.com/azure-sqldb-managed-instance/increasing-data-files-might-improve-performance-on-general-purpose-managed-instance-tier-6e90bad2ae4b.
The concept is that for the General Purpose tier, we store database and log files on Azure premium storage disks. Turns out that for premium disks, the larger the size of disk we use, the better performance we can get. So as you increase the size of your files, we will use a level of Premium storage to meet those needs, which can result in more IOPS or better throughput. I love Jovan’s blog post because he backs up his statements with data using the popular open source tool HammerDB .
Configuration isn’t your only choice. Improving transaction log latency may require you to use multi-statement transactions. Learn more at https://docs.microsoft.com/en-us/azure/azure-sql/performance-improve-use-batching.
Increasing Memory or Workers
Memory is also an important resource for SQL Server performance and Azure SQL is no different. The total memory available to you for buffer pool, plan cache, columnstore, and In-Memory OLTP is all dependent on your deployment choice. As I described earlier in this chapter, your highest memory capacity comes from an Azure SQL Database Business Critical tier using the new M-Series hardware generation (around 4TB). For a Managed Instance, you can get around 400Gb of memory using the 80 vCore deployment for Business Critical. Also keep in mind that In-Memory OLTP, which is only available for Business Critical service tiers, has a maximum memory as a subset of the overall maximum memory.
One key statement about memory that holds true for SQL Server or Azure SQL: If you think you don’t have enough memory, be sure you have an optimal database and query design. You may think you are running out of buffer pool after you scan a massive table. Maybe indexes should be deployed to enhance performance of your query and use less memory. Columnstore indexes are compressed, so use far less memory than traditional indexes.
The Hyperscale vCore choice not only affects the amount of memory available to the compute nodes but also the size of the RBEX cache which can also affect performance.
I’ve described worker limits in this chapter already which is set to a maximum value for Azure SQL Database, but Managed Instance uses “max worker threads” (but this is something we may limit less than this in the future). As with SQL Server, running out of workers may be an application problem. A heavy blocking problem for all users may result in an error running out of workers when the problem is fixing the blocking problem.
Improving Application Latency
Use a redirect connection type instead of proxy.
Optimize “chatty” applications by using stored procedures or limiting the number of query round trips through techniques like batches.
Optimize transactions by grouping them vs. singleton transactions.
Take a look at this documentation page for tuning applications for Azure SQL Database: https://docs.microsoft.com/en-us/azure/azure-sql/database/performance-guidance.
Tune Like It Is SQL Server
Proper index design.
Using batches.
Using stored procedures.
Parameterize queries to avoid too many cached ad hoc queries.
Process results in your application quickly and correctly (avoid the dreaded ASYNC_NETWORK_IO waits).
Let’s use an exercise to demonstrate how in some cases, while it may seem natural to try and change a service tier to improve performance, a change in your queries or application can show benefits.
For this exercise, I’ll use all the same tools, the same Azure SQL database deployment (which now has 8 vCores), and the same VM to look at a performance scenario for I/O. The scripts for this exercise can be found in the ch7_performance uning_applications folder for the source files included.
Let’s consider the following application scenario to set up how to see this problem. Assume that to support a new extension to a website for AdventureWorks orders to provide a rating system from customers, you need to add a new table for a heavy set of concurrent INSERT activity. You have tested the SQL query workload on a development computer with SQL Server 2019 that has a local SSD drive for the database and transaction log. When you move your test to Azure SQL Database using the General Purpose tier (8 vCores), the INSERT workload is slower. You need to discover whether you need to change the service objective or tier to support the new workload or look at the application.
I ran all of my tests for this exercise in an Azure VM which will use the Redirect connection type by default. If you run this outside of Azure, the default is Proxy. You will not see the same significant performance increase I observed if you use Proxy, but you will see some gains. This is because the simulation of the application requires enough round trips that Proxy can affect overall performance.
- 1.
Create a new table in the database.
I’ll use SSMS in my Azure VM that is connected to Azure SQL Database to add this table into the database based on the script order_rating_ddl.sql:DROP TABLE IF EXISTS SalesLT.OrderRating;GOCREATE TABLE SalesLT.OrderRating(OrderRatingID int identity not null,SalesOrderID int not null,OrderRatingDT datetime not null,OrderRating int not null,OrderRatingComments char(500) not null);GO - 2.
Load queries to monitor execution.
Using SSMS, load up queries in separate query windows to look at DMVs using scripts in the context of the user database with sqlrequests.sql, top_waits.sql, and tlog_io.sql. You will need to modify tlog_io.sql to put in your database name.
These scripts use the following queries, respectively:SELECT er.session_id, er.status, er.command, er.wait_type, er.last_wait_type, er.wait_resource, er.wait_timeFROM sys.dm_exec_requests erINNER JOIN sys.dm_exec_sessions esON er.session_id = es.session_idAND es.is_user_process = 1;SELECT * FROM sys.dm_os_wait_statsORDER BY waiting_tasks_count DESC;SELECT io_stall_write_ms/num_of_writes as avg_tlog_io_write_ms, *FROM sys.dm_io_virtual_file_stats(db_id('<database name>'), 2);The DMVs used in these queries are a great example of showing you diagnostics in the context of a database based on instance-level DMV diagnostics. It is one of the benefits when we moved to the V12 architecture I mentioned in Chapter 1 of the book.
Tip You can also find your session_id and use the DMV sys.dm_exec_session_wait_stats to see only the waits for your session. Note that this DMV will not show waits for any background tasks. Learn more at https://docs.microsoft.com/en-us/sql/relational-databases/system-dynamic-management-views/sys-dm-exec-session-wait-stats-transact-sql?view=sql-server-ver15.
- 3.
Run the workload.
The workload to insert database can be found in the script order_rating_insert_single.sql. The batch for this script looks like this:DECLARE @x int;SET @x = 0;WHILE (@x < 500)BEGINSET @x = @x + 1;INSERT INTO SalesLT.OrderRating(SalesOrderID, OrderRatingDT, OrderRating, OrderRatingComments)VALUES (@x, getdate(), 5, 'This was a great order');ENDWe will use ostress.exe to run this query with a script as found in order_rating_insert_single.cmd. For you to run this, you will need to edit the script to put in your correct server, database, login, and password.
Run this script from a command or PowerShell prompt.
- 4.
Observe query performance and duration.
Using the DMV you loaded, you will likely observe the following:Many requests constantly have a wait_type of WRITELOG with a value > 0.
The WRITELOG wait type is one of the highest counts for wait types.
The avg time to write to the transaction log is somewhere around 2ms.
The overall duration of running this workload on SQL Server 2019 on a computer with fairly normal SSD storage is around 10–12 seconds. The total duration of running thins using Azure SQL Database with my deployed General Purpose 8 vCore database is around 25 seconds. The latency of WRITELOG waits is affecting the overall performance of the application.
The documentation states that the expected latency for General Purpose is 5–7ms for writes. Our diagnostics showed better performance, but it won’t be the same as using an SSD storage system.
- 5.
Decide on a resolution.
You could look at changing your deployment to Business Critical or Hyperscale to get better I/O latency. But is there a more cost-effective way? If you looked at the batch for order_rating_insert_single.sql, you will notice that each INSERT is its own commit or singleton transactions. What if we grouped INSERTs into transactions?
- 6.
Change the application workload.
You can see a new workload method to group INSERTs into a transaction with order_rating_insert.sql like the following:DECLARE @x int;SET @x = 0;BEGIN TRAN;WHILE (@x < 500)BEGINSET @x = @x + 1;INSERT INTO SalesLT.OrderRating(SalesOrderID, OrderRatingDT, OrderRating, OrderRatingComments)VALUES (@x, getdate(), 5, 'This was a great order');ENDCOMMIT TRAN;GONotice the use of BEGIN TRAN and COMMIT TRAN to wrap the loop of INSERT statements.
You can now edit the order_rating_insert.cmd script with your server, database, login, and password to run this workload change.
- 7.
Run the new workload change.
When you run the new script (which is executing the same number of INSERT statements), you will seeFar less WRITELOG waits with lower average wait time
A much faster overall duration
The workload runs even faster now (I’ve seen as fast as 3 seconds overall).
This is a great example of ensuring you are looking at your application when running it against Azure SQL vs. just assuming you need to make a deployment option change and pay more in your subscription.
Intelligent Performance
I mentioned earlier in this chapter our intention to build into the database engine intelligent capabilities based on data and your application workload to get you faster with no code changes.
Let’s take a look in more detail to these areas of Intelligent Query Processing, Automatic Plan Correction, and Automatic Tuning.
Intelligent Query Processing
In SQL Server 2017, we enhanced the query processor to adapt to query workloads and improve performance when you used the latest database compatibility level. We called this Adaptive Query Processing (AQP). We went a step further in SQL Server 2019 and rebranded it as Intelligent Query Processing (IQP) .
IQP is a suite of new capabilities built into the Query Processor and enabled using the latest database compatibility level. Applications can gain performance with no code changes by simply using the latest database compatibility level. An example of IQP is table variable deferred compilation to help make queries using table variables run faster with no code changes. Azure SQL Database and Managed Instance support the same database compatibility level required to use IQP (150) as SQL Server 2019. IQP is a great example of a cloud-first capability since it was first adopted by customers in Azure before it was released in SQL Server 2019.
I covered this topic extensively in the book SQL Server 2019 Revealed. You can go run any of these examples from https://github.com/microsoft/bobsql/tree/master/sql2019book/ch2_intelligent_performance against Azure SQL to see how this works in action.
In addition, the documentation covers this topic extensively at https://docs.microsoft.com/en-us/sql/relational-databases/performance/intelligent-query-processing.
At the time of the writing of this book, Scalar UDF inlining was not yet available in Azure SQL Database, but probably by the time you are reading this, it will be available.
I asked Joe Sack who is not only the technical reviewer of this book but also the program manager lead for IQP about the significance of IQP for Azure SQL. According to Joe, “Over the last four years, the query processing team delivered two waves of Intelligent QP features – all with the objective to improve workload performance automatically with minimal changes to application code. Today we’re already seeing millions of databases and billions of queries using IQP features. Just as one example , we already have millions of unique query execution plans being executed hundreds of millions of times per day that use the memory grant feedback feature. In Azure SQL on a daily basis, this ends up preventing terabytes of query spills and petabytes worth of overestimations for user queries. The end result is improved query execution performance and workload concurrency.”
This area of improving our query processor to help your application is significant for Azure SQL. As Joe tells it for the future, “We have a long-term plan and active engineering investments to keep alleviating the hardest query processing problems that customers face at-scale. We look at a myriad of signals in order to prioritize features – including telemetry, customer support case volume, customer engagements and SQL community member feedback. We have eight separate Intelligent Database-related efforts underway in “wave 3”, and our plan is to light these efforts up in Azure SQL Database first over the next few years .”
Automatic Plan Correction
In 2017, I stood on stage with Conor Cunningham at the PASS Summit and showed off an amazing piece of technology for SQL Server 2017 to solve a performance problem using automation with Query Store. Query Store has such rich data; why not use it with automation?
What I showed on stage was a demonstration of a query plan regression problem that can be automatically fixed.
You can see the code I used for this demonstration at https://github.com/microsoft/bobsql/tree/master/demos/sqlserver/autotune.
A query plan regression occurs when the same query is recompiled and a new plan results in worse performance. A common scenario for query plan regression are parameter-sensitive plans (PSP), also known as parameter sniffing.
SQL Server 2017 and Azure SQL Database introduced the concept of Automatic Plan Correction (APC) by analyzing data in the Query Store. When the Query Store is enabled with a database in SQL Server 2017 (or later) and in Azure SQL Database, the SQL Server engine will look for query plan regressions and provide recommendations. You can see these recommendations in the DMV sys.dm_db_tuning_recommendations. These recommendations will include T-SQL statements to manually force a query plan when performance was “in a good state.”
If you gain confidence in these recommendations, you can enable SQL Server to force plans automatically when regressions are encountered. Automatic Plan Correction can be enabled using ALTER DATABASE using the AUTOMATIC_TUNING argument.
For Azure SQL Database, you can also enable Automatic Plan Correction through automatic tuning options in the Azure Portal or REST APIs. You can read more about these techniques in the documentation. Automatic Plan Correction recommendations are always enabled for any database where Query Store is enabled (which is the default for Azure SQL Database and Managed Instance). Automatic Plan Correction (FORCE_PLAN) is enabled by default for Azure SQL Database as of March 2020 for new databases .
You can read more about Automatic Plan Correction at https://docs.microsoft.com/en-us/sql/relational-databases/automatic-tuning/automatic-tuning.
Automatic Tuning
Technically, Automatic Plan Correction is part of a suite of services to use automation to improve query performance with no code changes called Automatic Tuning . Automatic Plan Correction works in SQL Server, Azure SQL Managed Instance, and Azure SQL Database.
In Chapter 1 of this book, I talked about the history of how Automatic Tuning was created. Azure SQL Database offers a unique feature of Automatic Tuning to help automate creating and dropping indexes called automatic indexing .
Today automatic indexing is not available for Azure SQL Managed Instance.
This capability is known as Automatic Tuning for Azure SQL Database (also known in some parts of the documentation as SQL Database Advisor). These services run as background programs analyzing performance data from an Azure SQL Database and are included in the price of any database subscription. Automatic Tuning will analyze data from telemetry of a database including the Query Store and Dynamic Management Views to recommend indexes to be created that can improve application performance. Additionally, you can enable Automatic Tuning services to automatically create indexes that it believes will improve query performance. Automatic Tuning will also monitor index changes and recommend or automatically drop indexes that do not improve query performance. Automatic Tuning for Azure SQL Database takes a conservative approach to recommend indexes. This means that recommendations that may show up in a DMV like sys.dm_db_missing_index_details or a query show plan may not show up immediately as recommendations for Automatic Tuning. Automatic Tuning services monitor queries over time and use machine learning algorithms to make recommendations to truly affect query performance.
One downside to Automatic Tuning for index recommendations is that it does not account for any overhead performance an index could cause insert, update, or delete operations.
You can read an excellent paper for how automatic indexing is built by our engineering team at www.microsoft.com/en-us/research/uploads/prod/2019/02/autoindexing_azuredb.pdf.
One additional scenario in preview for Automatic Tuning for Azure SQL Database is parameterized queries. Queries with non-parameterized values can lead to performance overhead because the execution plan is recompiled each time the non-parameterized values are different. In many cases, the same queries with different parameter values generate the same execution plans. These plans, however, are still separately added to the plan cache. The process of recompiling execution plans uses database resources, increases the query duration time, and overflows the plan cache. These events, in turn, cause plans to be evicted from the cache. This SQL Server behavior can be altered by setting the forced parameterization option on the database (this is done by executing the ALTER DATABASE T-SQL statement using the PARAMETERIZATION FORCED option). Automatic tuning can analyze a query performance workload against a database over time and recommend forced parameterization for the database. If over time performance degradation has been observed, the option will be disabled.
Let’s see an example of automatic indexing in action. I’ll use a database I deployed based on the AdventureWorks example to show this capability. You can try this out yourself using the scripts found in the ch7_performance uning_recommendations. You will need to edit the query_order_rating.cmd script to put in your server, database, login, and password. These scripts assume you have completed the previous exercise for concurrent INSERT execution as it uses the OrderRating table created in that exercise.
- 1.
See recommendations in the Azure portal.
After running the workload and waiting for 24 hours, I saw recommendations how up in the Azure portal similar to Figure 7-24.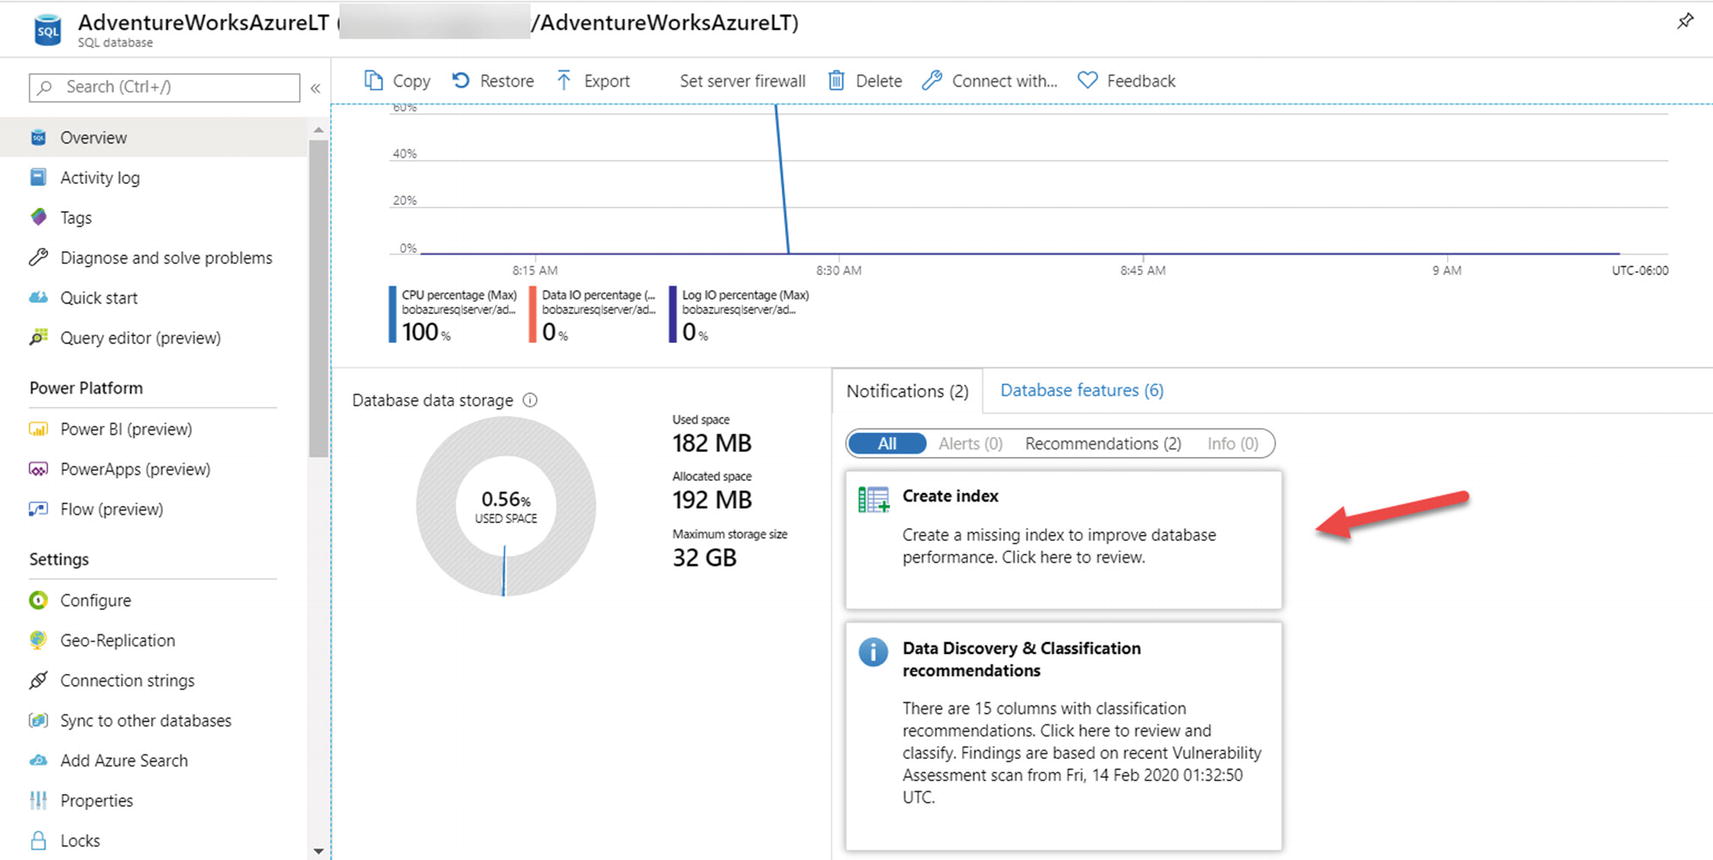 Figure 7-24
Index recommendation notification in the Azure portal

Performance overview from the Azure portal
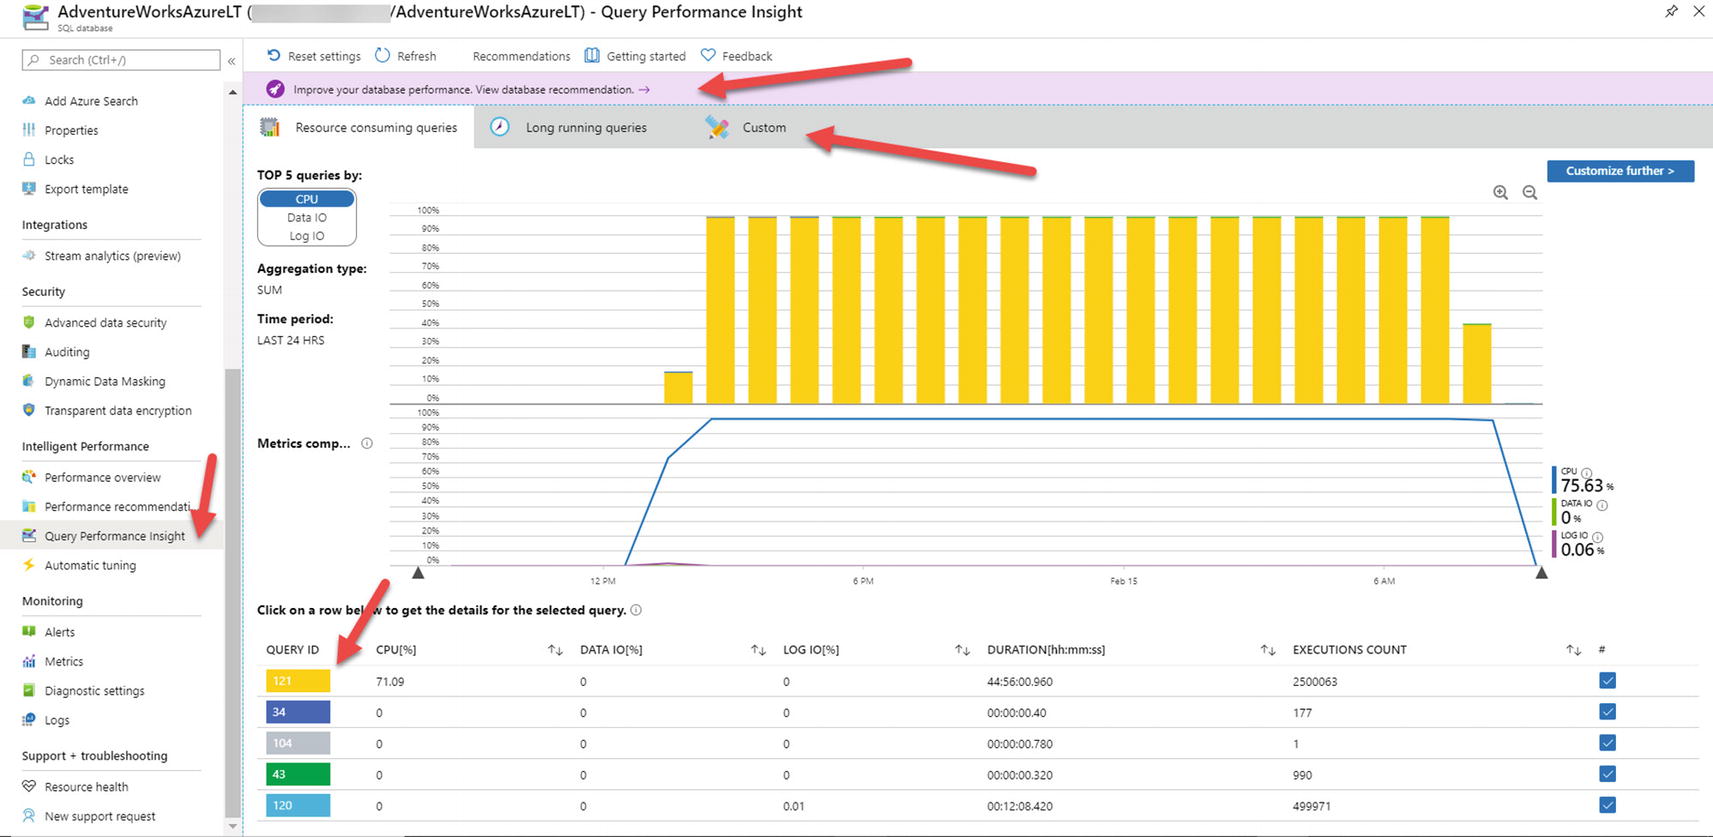
Query performance insights from the Azure portal
You can see in this figure a list of top queries consuming resources and a suggestion at the top of the screen to improve performance.

Performance recommendations from the Azure portal
You can see here specific recommendations for indexes, possible impact on performance, and history of any automatic tuning actions. You can also see in the command bar an option to select Automate.

Setting automatic tuning options
You can configure Automatic Tuning options at the logical server or database level. You can also view automatic tuning options through the catalog view sys.database_automatic_tuning_options. You can view all the columns for this catalog view at https://docs.microsoft.com/en-us/sql/relational-databases/system-catalog-views/sys-database-automatic-tuning-options-transact-sql?view=sql-server-ver15.
If you would have had create index turned on for this database, an index would have been automatically created.
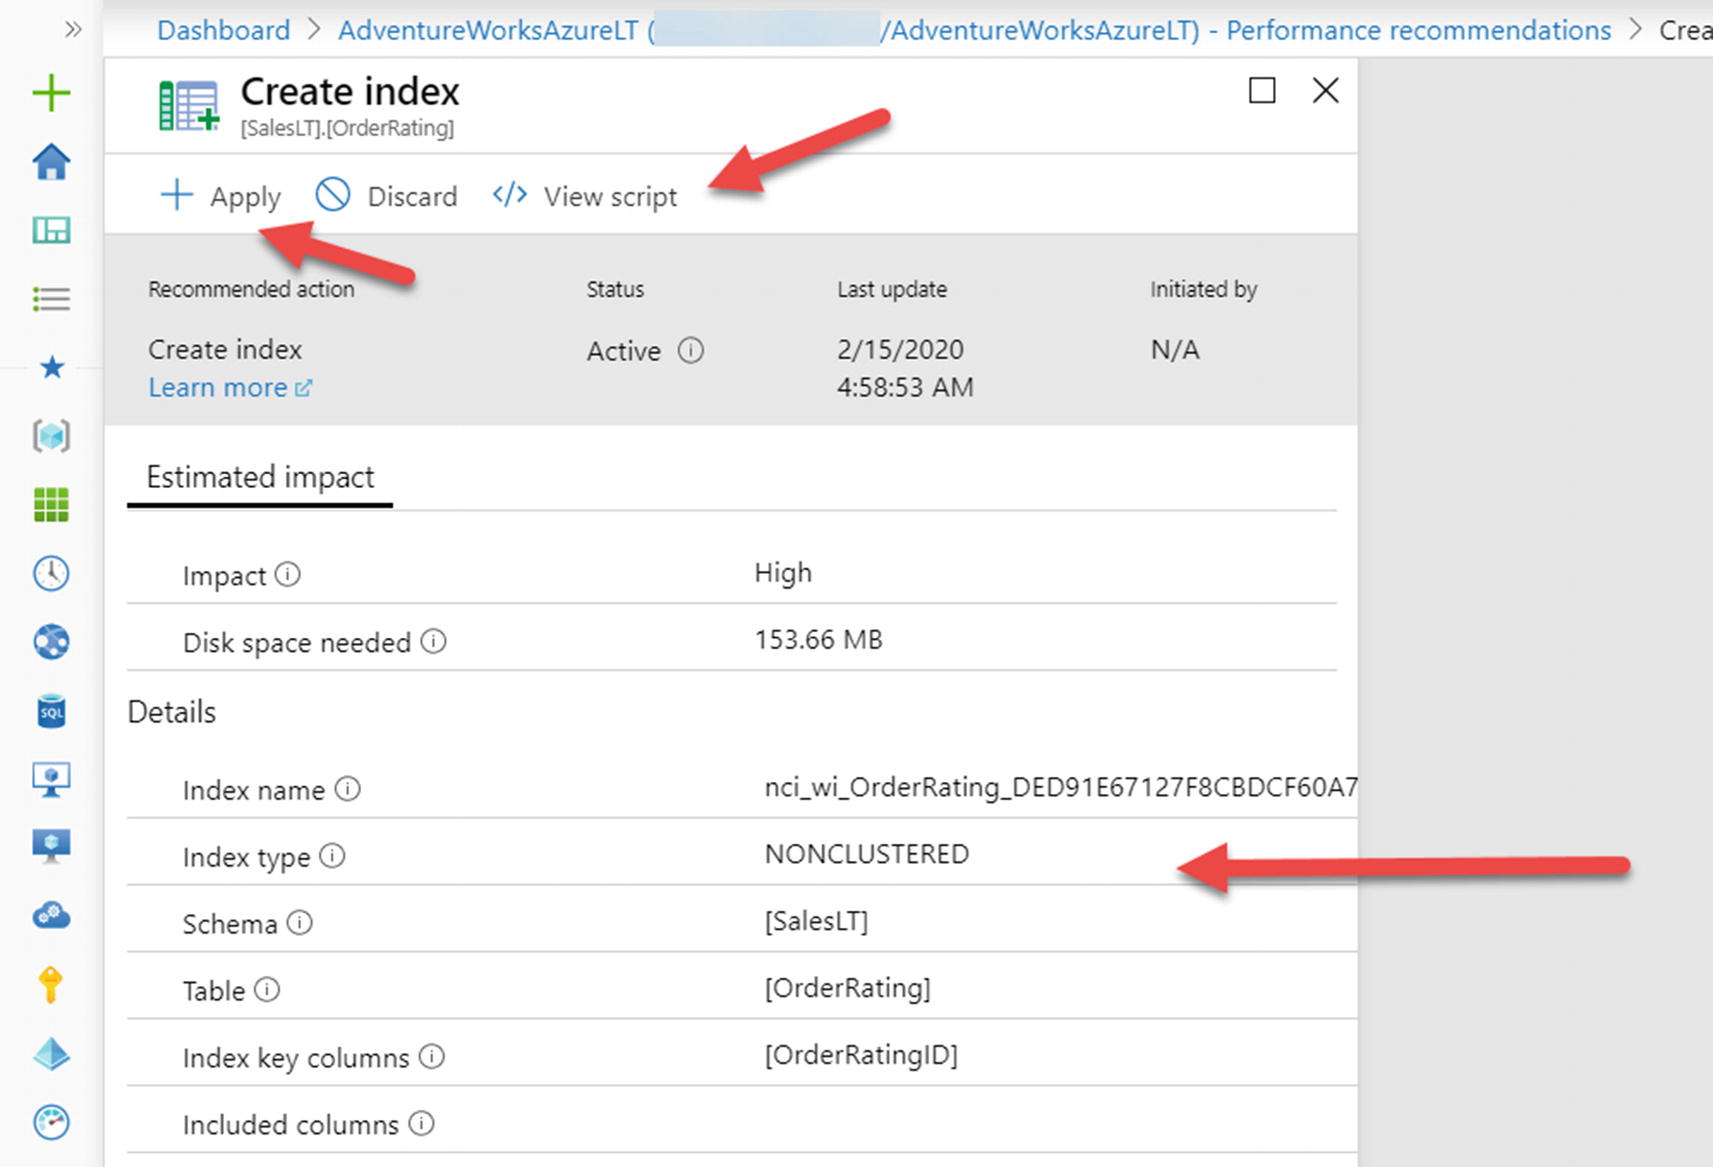
Details of a create index recommendation
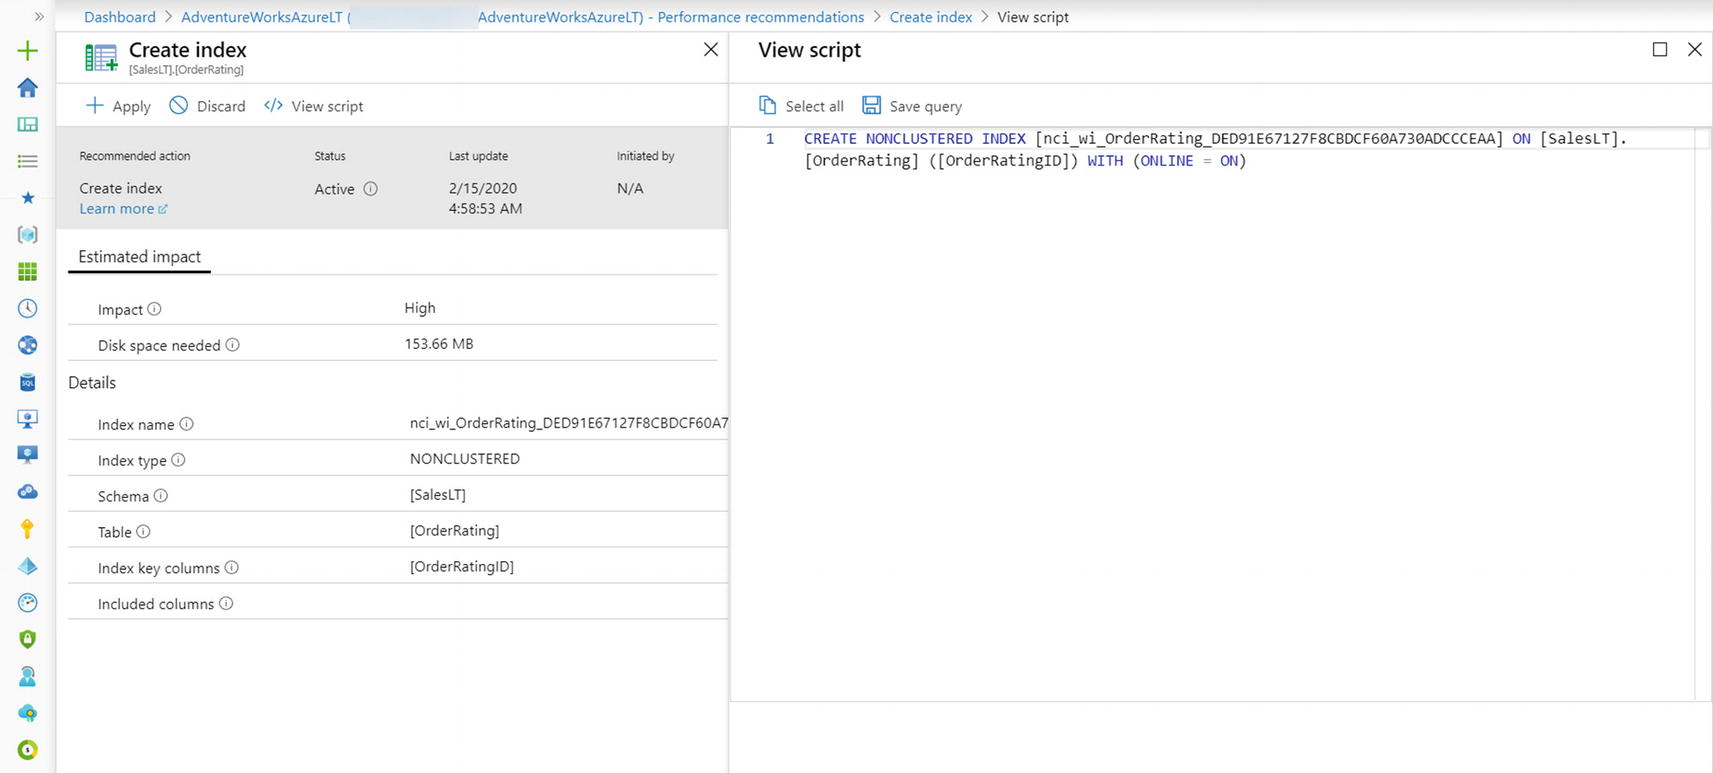
T-SQL script for index recommendations
You can see an online index is the default method used for automatic indexing. One thing I love about automatic indexing is that the service will run behind the scenes to monitor your workload performance after the index is applied. If performance degrades, a recommendation (or automation) can be provided to remove the index.
Summary
To deliver the best performance for you application, you need the capabilities and monitor tools that are tried and proven from SQL Server. Azure SQL gives you that and more, including capabilities and tools specific to Azure.
Azure SQL gives you the controls and options to accelerate and tune performance including the ability to scale easily with no database migration required.
Finally, Azure SQL comes with Intelligent Performance capabilities built into the query processor and services that leverage the power of Query Store from your database.
In the next chapter, we will explore and dive deep into the final core engine capability of Azure SQL to ensure your deployment is highly available and ensure you have the tools you need for disaster recovery.