Now that all the necessary pieces are in place, it is time to run the tests and review the test report.
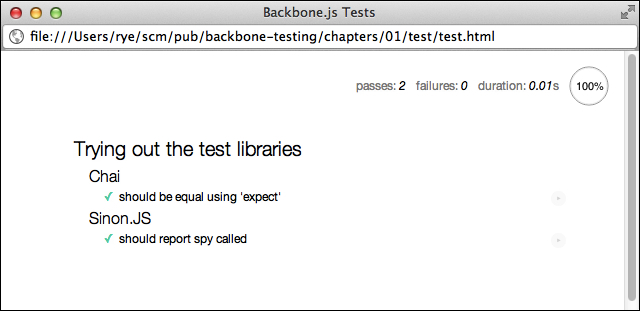
Opening up the chapters/01/test/test.html file in any web browser will cause Mocha to run all of the included tests and produce a test report:

Test report
This report provides a useful summary of the test run. The top-right column shows that two tests passed, none failed, and the tests collectively took 0.01 seconds to run. The test suites declared in our describe statements are present as nested headings. Each test specification has a green checkmark next to the specification text, indicating that the test has passed.
The report page also provides tools for analyzing subsets of the entire test collection. Clicking on a suite heading such as Trying out the test libraries or Chai will re-run only the specifications under that heading.
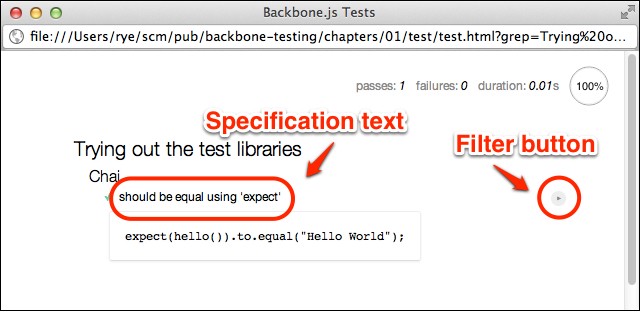
Clicking on a specification text (for example, should be equal using 'expect') will show the JavaScript code of the test. A filter button designated by a right triangle is located to the right of the specification text (it is somewhat difficult to see). Clicking the button re-runs the single test specification.

The test specification code and filter
The previous figure illustrates a report in which the filter button has been clicked. The test specification text in the figure has also been clicked, showing the JavaScript specification code.
Tip
Advanced test suite and specification filtering
The report suite and specification filters rely on Mocha's
grep feature, which is exposed as a URL parameter in the test web page. Assuming that the report web page URL ends with something such as chapters/01/test/test.html, we can manually add a grep filter parameter accompanied with the text to match suite or specification names.
For example, if we want to filter on the term spy, we would navigate a browser to a comparable URL containing chapters/01/test/test.html?grep=spy, causing Mocha to run only the should report spy called specification from the Sinon.JS suite. It is worth playing around with various grep values to get the hang of matching just the suites or specifications that you want.
All of our tests so far have succeeded and run quickly, but real-world development necessarily involves a certain amount of failures and inefficiencies on the road to creating robust web applications. To this end, the Mocha reporter helps identify slow tests and analyze failures.
Tip
Why is test speed important?
Slow tests can indicate inefficient or even incorrect application code, which should be fixed to speed up the overall web application. Further, if a large collection of tests run too slow, developers will have implicit incentives to skip tests in development, leading to costly defect discovery later down the deployment pipeline.
Accordingly, it is a good testing practice to routinely diagnose and speed up the execution time of the entire test collection. Slow application code may be left up to the developer to fix, but most slow tests can be readily fixed with a combination of tools such as stubs and mocks as well as better test planning and isolation.
Let's explore some timing variations in action by creating chapters/01/test/js/spec/timing.spec.js with the following code:
describe("Test timing", function () {
  it("should be a fast test", function (done) {
    expect("hi").to.equal("hi");
    done();
  });

  it("should be a medium test", function (done) {
    setTimeout(function () {
      expect("hi").to.equal("hi");
      done();
    }, 40);
  });

  it("should be a slow test", function (done) {
    setTimeout(function () {
      expect("hi").to.equal("hi");
      done();
    }, 100);
  });

  it("should be a timeout failure", function (done) {
    setTimeout(function () {
      expect("hi").to.equal("hi");
      done();
    }, 2001);
  });
});
We use the native JavaScript setTimeout() function to simulate slow tests. To make the tests run asynchronously, we use the done test function parameter, which delays test completion until done() is called. Asynchronous tests will be explored in more detail in Chapter 3, Test Assertions, Specs, and Suites.
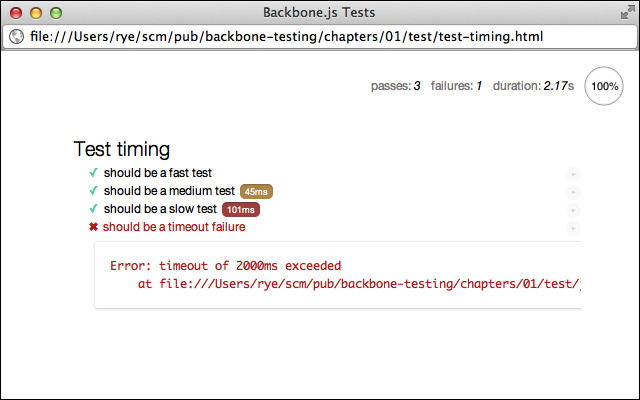
The first test has no delay before the test assertion and done() callback, the second adds 40 milliseconds of latency, the third adds 100 milliseconds, and the final test adds 2001 milliseconds. These delays will expose different timing results under the Mocha default configuration that reports a slow test at 75 milliseconds, a medium test at one half the slow threshold, and a failure for tests taking longer than 2 seconds.
Next, include the file in your test driver page (chapters/01/test/test-timing.html in the example code):
<script src="js/spec/timing.spec.js"></script>
Now, on running the driver page, we get the following report:

Test report timings and failures
This figure illustrates timing annotation boxes for our medium (orange) and slow (red) tests and a test failure/stack trace for the 2001-millisecond test. With these report features, we can easily identify the slow parts of our test infrastructure and use more advanced test techniques and application refactoring to execute the test collection efficiently and correctly.
A test timeout is one type of test failure we can encounter in Mocha. Two other failures that merit a quick demonstration are assertion and exception failures. Let's try out both in a new file named chapters/01/test/js/spec/failure.spec.js:
// Configure Mocha to continue after first error to show
// both failure examples.
mocha.bail(false);

describe("Test failures", function () {
  it("should fail on assertion", function () {
    expect("hi").to.equal("goodbye");
  });

  it("should fail on unexpected exception", function () {
    throw new Error();
  });
});
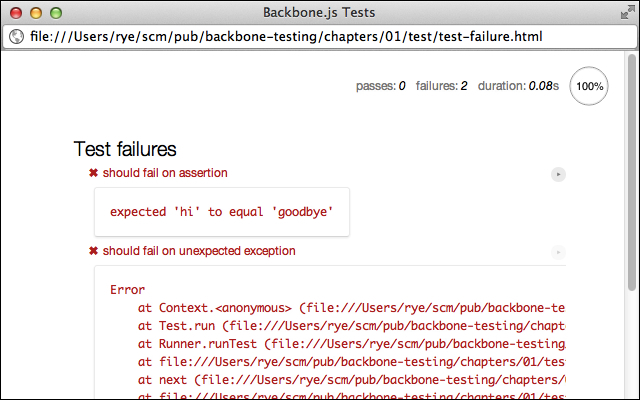
The first test, should fail on assertion, is a Chai assertion failure, which Mocha neatly wraps up with the message expected 'hi' to equal 'goodbye'. The second test, should fail on unexpected exception, throws an unchecked exception that Mocha displays with a full stack trace.

Test failures
Mocha's failure reporting neatly illustrates what went wrong and where. Most importantly, Chai and Mocha report the most common case—a test assertion failure—in a very readable natural language format.
