
CHAPTER 4
Not in the Next 30 Months
When you were a little kid, what did you want to be when you grew up?
Pretty much every tyke has some fanciful vision of their adulthood. Maybe you wanted to be a firefighter, princess, astronaut or baseball player! Maybe a doctor, movie star, builder, action hero or train conductor. Perhaps a pirate! At some time, most kids have wanted to be one of these or something similar—something they idealized for whatever reason.
Rarely do any of these dreams come true. Some do! But usually, hopes, dreams, possibilities and plans change as we age. Wanna-be athletes grow up to be mathletes. Wanna-be astronauts discover they hate studying physics. Kids who played Operation—that board game where you poke at a plastic patient’s ailments with tweezers—might grow up squeamish at the sight of blood. Those who idealized train conductors may learn Thomas the Tank Engine isn’t real life.
Countless things change between ages 5 and 30, and no five-year-old can know what their adult life will look like. They can imagine! But real life usually goes differently in ways we can’t predict. Kids can know what’ll probably happen in a rough way over the next two years or so of their life—what grade they’ll be in, what teachers they’ll probably have, how old they’ll be, what milestones they’ll hit. But not much further out. A nine-year-old might expect to end up at the local high school, but what if their parents move? Or another school opens? We have to live life, experience the changes firsthand, and see how it goes.
Same for markets. We can’t know the far future today! Too much change to fathom! Stocks know it, and they don’t look more than about 30 months ahead. Anything further out is sheer guesswork—possibilities, not probabilities, and markets move on probabilities.
Yet headlines continually bombard us with slowly developing super-long-term trends, claiming they’ll be our eventual doom. Like high debt, China taking over the world, global warming—you name it. Countless academic studies use fancy formulas claiming to predict how these and many other issues will play out. Pundits take their hypotheses as fact and hype them ad infinitum. Many take it a step further, warning these big, bad long-term things could doom stocks today and for the foreseeable future.
You can use an easy trick to identify this far-future unknowable pointlessness and tune it out. Simply ask: “Is any of this a material risk impacting economies in the next 30 months?”
This will sound Pollyannaish and dismissive, but it’s true: If whatever big, bad, terrible thing the media warns about won’t happen materially in the next approximate 30 months, it doesn’t matter for stocks. Even if the terrible horrible prediction ends up true eventually, way down the road! Stocks don’t look that far ahead. Ok, maybe 32 months sometimes, but not the far distant future.
This doesn’t mean you shouldn’t consider possibilities. Thinking about them—seeing what the crowd is saying, and considering what they’re overlooking or not imagining—can help you figure out whether the long-term picture is really so dire, and that can help you sleep at night. All good! But for your investing decisions, you need only assess what is most likely to happen over the next 30 months.
The “not in the next 30 months” test is a top trick. You can apply it to pretty much every long-term issue the headlines hype as America or the world’s eventual socioeconomic downfall. Even if they say we have to ACT NOW to prevent our eventual doom! If doom isn’t likely within the next 30 months, markets won’t worry about it today, and neither should you. This simple trick helps tune out a cacophony of frightful noise.
In this chapter, we’ll cover how to use “not in the next 30 months” to:
- Separate political and social issues from economic ones.
- Dazzle your next dinner party when the conversation turns to US debt.
- Skewer every long-term terror the media wants you to fear today.
Baby Boomer Bomb?
For over a decade now, folks have obsessed over the Baby Boomers. What happens when they all retire? Who will be left to buy stocks?
Who knows? Not me! Not you! Not the famous champions of Boomer doom and gloom! We can’t know—none of us—because it’s all too far out. Sure, the first Boomers turned 65 in 2011. But the last of them won’t get there until 2029. No one can see that far into the future. The average Boomer retirement is still far out. Stocks know this and don’t even bother trying—not in the next 30 months is good enough for markets!
But thanks to efficient markets, we can be darned sure about this: Boomers’ retirement won’t move markets. It will play out too slowly—over an entire generation!—and nothing about it is a surprise. Markets have known when Boomers will retire since they were born—that’s not foresight, just math. Fears started circulating about a decade before the first Boomers turned 65. They’ve been retiring in earnest for more than four years, and that doesn’t count the many who took early retirement. The world hasn’t ended. To presume markets won’t discount things like this is to insult The Great Humiliator (TGH). Never smart!
Contrarians know all of this. They also know all the fears surrounding Boomer retirement are just opinions, based on the assumption Boomers will swap stocks for bonds when they retire, denting demand for stocks and putting less pressure on prices. Maybe! But if it does come true, it’s a structural factor—stocks can still do fine, and cyclical factors can swamp.
Then again, this presumption of sagging demand for stocks ignores so many other possibilities. Maybe Boomers sell their businesses and invest the proceeds in stocks, and demand gets bigger! Private equity for public equity. Maybe their kids—a boom of their own—enter their prime working years and plow a ton of money into their 401(k)s, driving demand even higher! Maybe we see a combination, plus some other variables we can’t dream up today.
The ultimate Boomer retirement endgame is simply too far out to game today. So don’t even try. No point! Remember it isn’t a surprise, an automatic negative or a big market mover.
What About Social Security and Medicare?
A subset of Boomer doom is the fear this massive increase in America’s above-retirement age population will bankrupt Social Security and Medicaid. The Social Security Administration predicts that over 25% of Americans will be above the retirement age by 2029. The Social Security Board of Trustees’ Annual Report to Congress claims the Old-Age and Survivors Insurance and Disability Insurance, combined, will be depleted in 2033. It also suggests Social Security will be able to pay only 75% of its scheduled benefits by then unless something changes.
This is the subject of media hype regularly, and the general conclusion is: Panic! But contrarians don’t blink, and neither should you.
Why? One, it’s not in the next 30 months! Two, these fears don’t pass a basic logic test—one of a contrarian’s favorite tools, as I mentioned in Chapter 1. If a claim or forecast is based on a bad assumption, it’s bunk.
Social Security and Medicare depletion fears are based on long-term forecasts government agencies make using straight-line math—just take current conditions or historical averages and extrapolate them out to eternity. How is that rational? Why would the future ever look exactly like the past? Back in 2000, the Congressional Budget Office (CBO) predicted perpetual federal budget surpluses. In 2003, it predicted we’d have a ![]() 508 billion surplus and a 14.4% debt-to-GDP ratio in 2013. In real-life 2013, America ran a
508 billion surplus and a 14.4% debt-to-GDP ratio in 2013. In real-life 2013, America ran a ![]() 680 billion deficit, bringing the debt-to-GDP ratio to 72.1%. The CBO gets the inputs wrong, too. In 2002, the CBO assumed 10-year US Treasury yields would hover near 6% for the next decade. This was nowhere close to true! Figure 4.1 shows just how wrong that projection was.
680 billion deficit, bringing the debt-to-GDP ratio to 72.1%. The CBO gets the inputs wrong, too. In 2002, the CBO assumed 10-year US Treasury yields would hover near 6% for the next decade. This was nowhere close to true! Figure 4.1 shows just how wrong that projection was.
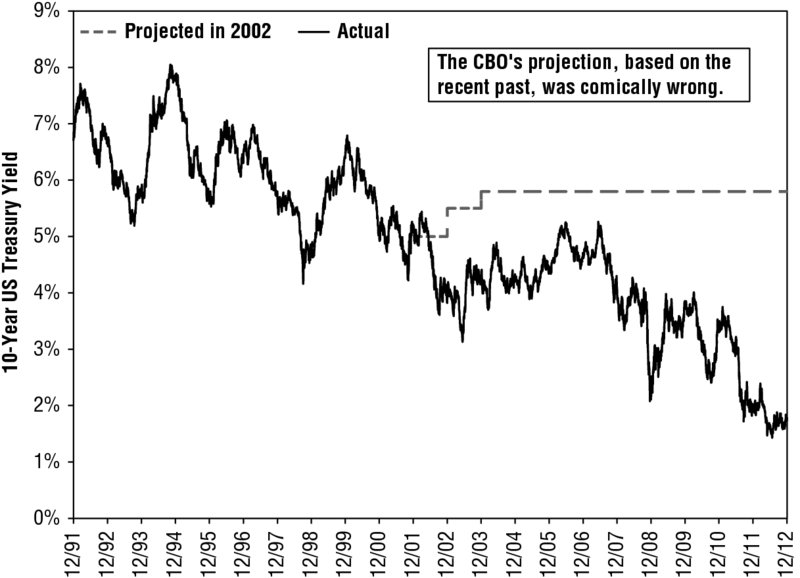
Figure 4.1 The CBO’s Comical Interest Rate Projection
Sources: FactSet, CBO, as of 12/4/2014. 10-year US Treasury yields (constant maturity), 12/31/1991–12/31/2012; CBO projection of 10-year US Treasury yields from 2002 to 2012 (issued January 2002).
Is the CBO right sometimes? Sure! That’s how TGH keeps us guessing, and it’s how the CBO still has some fragment of credibility after all these years. Plus, like the professional market forecasters we covered in Chapter 2, the CBO has a long time to revise its forecasts to catch up with reality—it updates twice a year. Table 4.1 shows how the CBO’s forecast for 2013’s fiscal stats evolved over time. Between 2003 and early 2013, it gradually morphed from massively wrong to largely right.
Table 4.1 The CBO’s Evolving Projections for Fiscal 2013
| Date Projection Issued | Spending ( |
Revenue ( |
Surplus or Deficit (–) | Debt ( |
Debt-to- GDP |
| Jan-03 | 3,167 | 3,674 | 508 | 2,565 | 14.4% |
| Aug-03 | 3,422 | 3,634 | 459 | 5,438 | 30.7% |
| Jan-04 | 3,457 | 3,441 | –16 | 6,409 | 37.0% |
| Sep-04 | 3,547 | 3,471 | –75 | 6,675 | 37.8% |
| Jan-05 | 3,389 | 3,474 | 85 | 5,884 | 32.6% |
| Aug-05 | 3,561 | 3,481 | –80 | 6,691 | 37.0% |
| Jan-06 | 3,506 | 3,546 | 40 | 6,032 | 32.9% |
| Aug-06 | 3,631 | 3,555 | –76 | 6,469 | 35.4% |
| Jan-07 | 3,391 | 3,550 | 159 | 5,089 | 28.3% |
| Aug-07 | 3,583 | 3,619 | 36 | 5,730 | 31.5% |
| Jan-08 | 3,524 | 3,585 | 61 | 5,701 | 31.6% |
| Sep-08 | 3,766 | 3,619 | –147 | 6,968 | 38.6% |
| Jan-09 | 3,610 | 3,353 | –257 | 8,516 | 50.0% |
| Aug-09 | 3,759 | 3,221 | –538 | 10,870 | 65.5% |
| Jan-10 | 3,756 | 3,218 | –539 | 11,056 | 66.3% |
| Aug-10 | 3,760 | 3,236 | –525 | 11,422 | 68.4% |
| Jan-11 | 3,794 | 3,090 | –704 | 12,386 | 75.5% |
| Aug-11 | 3,692 | 3,069 | –510* | 11,773 | 72.8% |
| Jan-12 | 3,573 | 2,988 | –585 | 11,945 | 75.1% |
| Aug-12 | 3,554 | 2,913 | –641 | 12,064 | 76.1% |
| Feb-13 | 3,553 | 2,708 | –845 | 12,229 | 76.3% |
| May-13 | 3,455 | 2,813 | –642 | 12,036 | 75.1% |
| Actual 2013 | 3,454 | 2,774 | –680 | 11,982 | 72.1% |
*Assumes ![]() 113 billion in additional savings under the Budget Control Act of 2011.
113 billion in additional savings under the Budget Control Act of 2011.
Source: Congressional Budget Office, as of 12/4/2014. Baseline Budget Outlooks from the CBO’s semiannual Budget and Economic Outlook reports published from January 2003 to February 2014.
We now know the CBO is often wrong, but we can’t dismiss it out of hand just because it’s the CBO! So we turn to another faulty premise: The presumption Social Security is a “lockbox,” to use the term popularized by Al Gore and Saturday Night Live during the 2000 Presidential campaign. The “lockbox” myth assumes the Social Security and Medicare trusts are money set in store for our retirees and maybe, one day, us. Nope! Of every tax dollar we pay into Social Security, 85 cents goes immediately to fund current benefits. The other 15 cents goes to the “trust fund,” which pays people with disabilities and their eligible family members. This trust isn’t locked away. Surplus funds, by law, are lent to the federal government for general use through the purchase of special issue Treasury bonds. The money is spent.
And all that chatter about “unfunded liabilities”? Meaningless! All of Social Security’s liabilities are technically unfunded! The Treasury isn’t borrowing to pay them! This system is entirely pay as you go. Workers pay in, the feds pay out.
What Boomers collect from entitlements over the next few decades will be paid, right then and there, by Gen X and the Millennials—and despite all those “aging population” fears, there are about 15 million more Millennials than Boomers. When they reach retirement age, their kids and grandkids—Gen Z or whatever snappy name they get—will fund their benefits. It’s the circle of life. (Even if Elton John never writes a song about it.)
Here, you might say, “Yeah, but what if the Millennials never grow up?!” What if they’re a disaster in their prime working years? Well, think about the basis for that question. Folks fear Millennials will never grow up because they see them as a bunch of self-entitled brats. It’s a “kids today!” argument. I have a lot of Millennials working for me. They’re no worse than Gen X, who were supposed to waste their lives drinking coffee and wearing grungy flannel—they grew up. They’re no worse than my generation, which was supposed to be anti-corporate drugged-out good-for-nothing turn on, tune in, drop outers—we grew up. Maybe the “kids today!” crowd is right this time, and the Millennials do turn into a bunch of 60-year-old brats who never did anything. Or maybe, just maybe, the kids are alright. But none of this is an issue in the next 30 months—always and everywhere what matters for stocks.
If natural population growth, immigration, and naturalization aren’t enough to maintain the programs, Congress can just change them. None of this is set in stone! It’s all legislation! Social Security and Medicare were created by Congress, and they can be tweaked by Congress. Yes, we’ve all heard this is the third rail of American politics, but Congress grabbed that third rail several times during the twentieth century, tweaking the inputs and outputs to preserve the program’s solvency. Way back in the 1970s, Trustees estimated Social Security would be unable to fully cover benefits by 1979! But a few small fixes in 1977 took care of it. It doesn’t take much to astronomically extend full funding. This issue can easily remain outside of markets’ forecasting horizon in perpetuity.
But What if the “Lost Generation” Stays Lost?
Some say the kids surely won’t be alright because the student loan bubble warped all their personal balance sheets into debt-heavy disaster. All for some degree that will never pay off!
This is another “not in the next 30 months” thing. Heck, it might be a “not in the ever” thing.
Let’s do the numbers. Student loan bubblephobia headlines hype the nearly threefold rise in outstanding debt since 2006. When that year began, total student debt was around ![]() 500 billion, according to the New York Fed. By Q1 2014, it was
500 billion, according to the New York Fed. By Q1 2014, it was ![]() 1.3 trillion. Add in most student loans’ exemption from bankruptcy protection, and headlines can easily convince you student debt is a mounting, unshakeable burden on the Millennial generation.
1.3 trillion. Add in most student loans’ exemption from bankruptcy protection, and headlines can easily convince you student debt is a mounting, unshakeable burden on the Millennial generation.
Here, the skeptical contrarian asks questions. Who’s paying that ![]() 1.3 trillion? How many borrowers? How old are they? How much does each person pay?
1.3 trillion? How many borrowers? How old are they? How much does each person pay?
You can get all the answers at the New York Fed, which keeps a running tally of the demographic breakdown of outstanding student debt. There, you’ll see the following:
- Nearly 40 million people share that
 1.3 trillion in outstanding student loans.
 - Using simple math, the average amount owed is 32,500.
- As of 2011 (the latest published figure as I’m writing this), the median amount owed was about 12,000. Half owed more, half owed less.
- One-third of the total was owed by the under-30 crowd.
- Another third was owned by folks aged 30 to 39.
- The rest was owed by the over-40 set.
It seems exceedingly difficult to argue Millennials are disproportionately impacted here. A lot of these folks owe the equivalent of a car loan. Most student debt is owed by folks in their prime working years.
Chances are Millennials can afford their loans. After all, the result of a student loan is a college education! College grads are mostly at the top of the food chain in labor markets. According to the US Bureau of Labor Statistics, the employment/population ratio for college grads has averaged 74.5% since 2004.1 For the total population, it averages just 60.6%. Job growth for college grads was over five times faster than total job growth during this period.2 The unemployment rate for college grads peaked at 5% after the 2007–2009 recession; it peaked at 10% for everyone.3 College grads’ median weekly earnings are about 30% higher than the broader population’s at both the high and low ends of the spectrum.4
Might some indebted Millennials have to delay a home purchase for a few years while they pay this down? Sure! Might those who racked up six figures in debt gunning for careers in academia have a tougher time? Sure! But none of that is a gigantic negative in the next 30 months.
Could student debt eventually spiral into the massive negative the media (and politicians!) say it is? Maybe! But college costs would have to hit the stratosphere, and job prospects would have to crater. Possible, in theory—but not in the next 30 months!
What About Debt?
Nowhere does “not in the next 30 months” help you more than with the endless warnings that America will be bankrupt by some random year, usually decades in the future.
Most of this is based on total outstanding debt—either as a percentage of GDP or as just a gigantic absolute number. Trillions upon trillions of dollars America owes the world. The debt doom-mongers say our government is spending and borrowing us into oblivion, saddling our children and their children and their children with debt they’ll never be able to repay.
Children and children’s children? That’s not in the next 30 months.
This probably sounds too dismissive, so let’s go through the proof. Always demand evidence!
The CBO’s 2014 forecast (them again!) says US net public debt (which excludes all the money America owes itself) will hit 106% of GDP by 2039.5 Once again, the CBO uses straight-line math and a bunch of random assumptions—just fantasy.
But maybe they’re right! What then? Armageddon? Debtpocalypse?
Probably not. There is no evidence in history that debt at 106% of GDP leads to poor economic performance, default or stock market mayhem. America had more than that in the aftermath of World War II. We were fine. Britain had more than twice that amount during much of the industrial revolution—fine there, too. The empire flourished. No bankruptcy there! (Of course, they got to rape, loot and pillage, which may have buoyed the “animal spirits” in ways that no longer apply.) Japan has double that as I type this. Now, the Japanese economy isn’t the greatest, but it isn’t due to debt—it’s more tied to their bizarrely nineteenth-century mercantilistic take on capitalism.
Besides, total debt—whether at an absolute level or as a percentage of the economy—is a pretty arbitrary number. Tells you nothing about solvency. Think about your mortgage. You might have hundreds of thousands, even millions of dollars in mortgage debt! Big numbers! But those big numbers don’t matter—what matters is that monthly mortgage payment. Can you afford it? Yes? Then you can afford that big number over time.
Same with America. Just the same! All that matters is whether the Treasury can afford interest payments. Today, the interest on our debt is more affordable than almost ever—near historic lows relative to GDP and tax revenue, as shown in Figures 4.2 and 4.3. Lower than levels seen in much of the 1980s and 1990s—wonderful times for stocks. Even as total debt has risen in recent years, total interest payments have fallen. Interest rates have been at generational lows, and the Treasury refinanced a huge chunk of maturing debt at these low rates. Meanwhile, tax revenue is up with the growing economy.
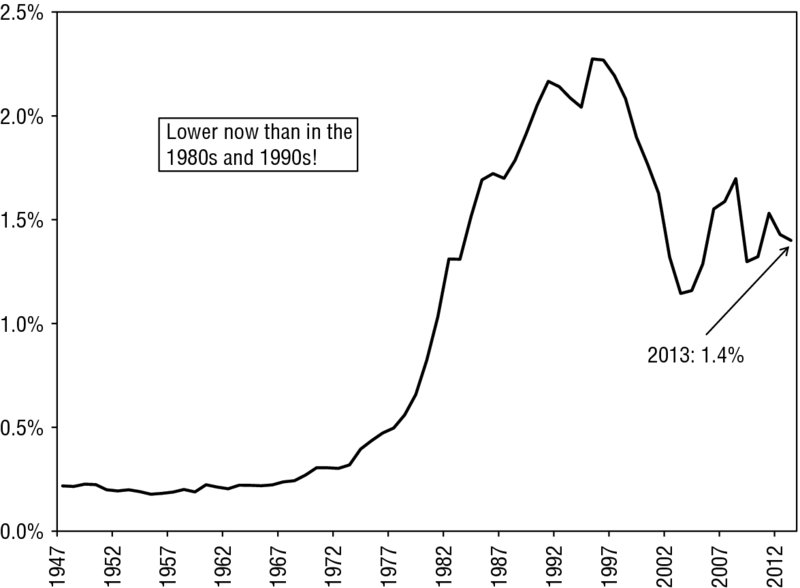
Figure 4.2 US Federal Interest Payments as a Percentage of GDP
Source: Federal Reserve Bank of St. Louis, as of 11/28/2014.
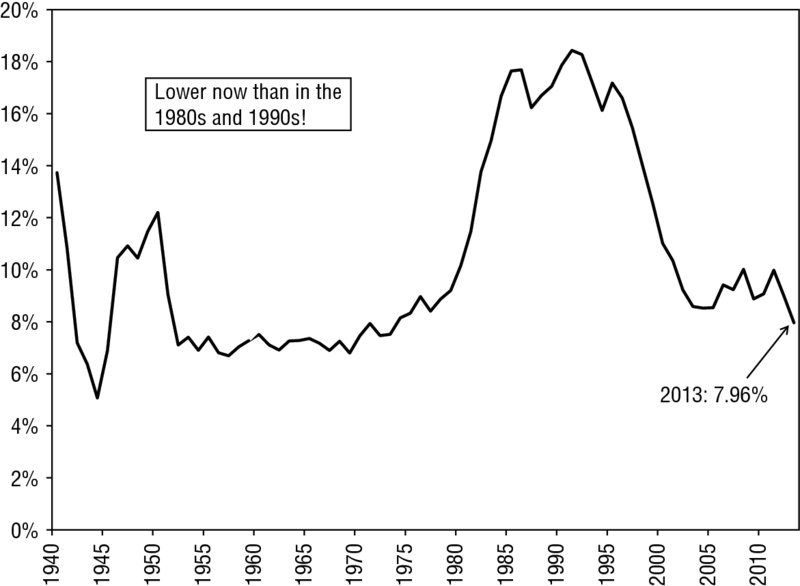
Figure 4.3 US Federal Interest Payments as a Percentage of Tax Revenue
Source: Federal Reserve Bank of St. Louis, as of 11/28/2014.
For debt to become a problem, interest rates would need to rise to nosebleed levels and stay there for years. Rates directly matter for the federal government only at issuance—the primary market. That means they have to stay high as the federal government rolls over a lot of debt. Today, the average maturity is more than five years. Rates need to rise high and stay there long enough to move average payments to those levels. Could it happen? Sure. But not in the next 30 months! That blip of high rates in the early 1980s wasn’t anywhere near big or long enough to sink us. We’d have to get into fiscal trouble of Grecian proportions and mafia duration for the world to see us as a big enough credit risk to demand significantly higher payments. Possible? Sure! But not in the next 30 months.
But What if Debt Causes Runaway Inflation?
Debt “causes” inflation only if you monetize it. Could it happen? Maybe! But not in the next 30 months.
Governments generally monetize debt only if they can’t afford interest payments. If you monetize the debt, you deliberately cause inflation to rise so those interest payments get cheaper—the total dollar amount stays the same, but it’s worth less. There are just more dollars sloshing around.
For the United States to monetize the debt, we’d have to see interest payments on debt skyrocket—we just covered that. Not happening in the next 30 months. Could the United States pile on debt endlessly over time and get to a point where we have to monetize? Maybe! But maybe Congress turns thrifty and at some point decides to let the debt slowly mature, and it falls out of the monetary base. Or, maybe debt keeps rising, but the growth of society pays for it, just like always. Maybe we keep getting more productive. Maybe technology keeps getting better, faster, more powerful, driving advances we can’t even imagine today—and entire new economic frontiers. Again, none of that is about the next 30 months.
But long-term straight-line forecasts can’t account for any of that. Again, those government stat-heads delivering dire warnings of debt doom just chart-out the recent past forward. Analysis that tries to account for technological change requires imagination and an ability to quantify unknowable wonders. That’s no knock on CBO crunchers—just a knock on standard projections.
But What if America Stops Innovating?
It might! But not in the next 30 months!
Most technological advancement comes from an opportunistic business consumer’s realization of the collision of four factors:
- Moore’s Law: The theory that the number of transistors you can fit on a microprocessor doubles about every two years. Intel founder Gordon Moore hypothesized this in 1965, and so far, it has held true far longer than anyone ever envisioned decades back. Moore’s law is why technology has become exponentially more powerful, smaller and awesomer over time; it’s why your smartphone does way more than an Apple IIe or an old IBM PC.
- Koomey’s Law: The theory that energy efficiency in computing doubles every year and a half or so—it takes less battery power to perform the same computations. This, too, has made devices smaller, more powerful and longer-lasting. It’s why your smartphone keeps a charge longer than your old flip phone, even though it’s smaller and does things your flip phone never dreamed of. (If flip phones dream. Maybe they dream of electric sheep.)
- Kryder’s Law: The theory that the amount of data you can fit in one inch of disk drive doubles every 13 months. This is why smartphones a fraction of the size of a 10-year-old laptop can store vastly more information.
- The Shannon-Hartley Theorem: The theory that as long as you can create channels with greater bandwidth—which is theoretically limitless—you can transmit information more clearly and faster. Decades from now, fiber optics will look slow.
Most—if not all—of America’s tech industry now revolves around these four rules, and all are running full-steam ahead. Could they peter out one day? Maybe! But not in the next 30 months. And as these wind down, who knows what new advances will take their place, otherwise driving technology ever forward.
Then, too, as long as America is where the tech companies are, America will be where innovation happens. Most inventions don’t happen at the firms making the processors, batteries, hard disks and wires made possible by those four rules. Innovation comes from the creative users who figure out new ways to use these gizmos. These inventive users tend to flourish near where these components are created. It’s like the adjacency effect in science—the optical phenomenon where two close-together objects affect each other in ways they otherwise wouldn’t. It’s like the very recently discovered fourth state of water. Beyond solid, liquid and gas. Look it up. I’m not kidding. It’s EZ. (EZ water; EZ stands for exclusion zone.) Same with technology! Nearness counts. You get the former employee at a semiconductor firm who has lunch with a nanotechnology geek and dreams up a contact lens that takes pictures.
America has the edge here. Nine of the 10 biggest tech firms by market capitalization are in the U-S-of-A. Could we lose this advantage? Maybe! Nothing lasts forever! Japan once had an edge here, but it doesn’t now. But Japan didn’t erode overnight. It took decades. So maybe America erodes too! But not in the next 30 months. There is a big bugaboo in America right now about firms moving for tax purposes, but this isn’t a hollowing-out. Only the address moves. All the normal operational facilities—the entire R&D—that all stays here. Along with the many R&D centers foreign firms operate here.
But What About Global Warming?
Global warming is a classic case of the media telling investors to look for risk in the wrong places. It is a scientific debate that gets misapplied to economics by politicians, and folks get caught up in the chatter. They fret over which side is right. They get caught up in academics and politics. And they lose sight of—what else!—the next 30 months.
You see this with pretty much every hot-button issue. Government spending. Debt. Most things political. Investors get drowned in rhetoric and ideology, so they can’t see the likely market impact.
Now, I’m not a scientist—I have no clarity on whether global warming is real and, if so, whether it will exponentially increase the frequency of natural disasters. Or raise the oceans and put the entire Eastern Seaboard and Gulf Coast under water in 60 or 70 years. I can’t tell you whether Houston is going the way of Atlantis.
Problem is, neither can the scientists. That’s why the debate remains so loud and distracting! The global warming alarmists rely on “consensus science,” arguing a glut of research shows temperatures have risen (or become more extreme on either end of the thermometer) in tandem with carbon emissions. Policymakers tout this as the defining issue of our time, then use all the science to justify all the laws they wanted to pass anyway, like taxes on certain activities or sectors. Stuff like carbon cap-and-trade—it’s just a tax grab dressed up as environmental policy. Massive subsidies for wind and solar energy firms are just spending boondoggles couched as environmental necessity. It’s all a shell game of environmental concern. Not for the scientists! But for the politicians. Fact is, consensus science has been wrong most of history, and basing investment decisions on the consensus of scientists is too farsighted to work, ever.
So the other herd argues consensus science is just wrong—just because everyone says something is true doesn’t mean it’s right. If the science herd were always right, they say, we’d still think the world was flat. In science, too, being right can mean being lonely. This might make you, as a budding contrarian investor, prone to side with the “global warming isn’t real” crowd. Be careful—that’s bias talking! Allow your sympathies to drift to either side, and you let ideology seep in, and that’s dangerous. Contrarians shun bias. But sometimes, many times, consensus is right. After all, is gravity real or not?
So, how should the contrarian think about global warming? Here’s an easy three-step process:
- Remember you aren’t a scientist. Unless you are a scientist—then you can skip to step two. Otherwise, you are not a scientist and therefore not an expert, and you don’t know anything that hasn’t already been discussed ad nauseam by the scientific crowd—you don’t know anything markets aren’t already aware of.
- Accept that no one knows which side of the debate is right, because neither side has seen the scientific method through—they hypothesize, observe, analyze and deduce, but they lack a control group. The warmists can show rising temperatures and carbon emissions till the cows come home, but they will never have a counterfactual. Same goes for the anti-warmists. None of it proves anything.
- Accept that it doesn’t matter which side is right. Because even if the warmists turn out to be correct, even they admit the world won’t turn into a full-time natural disaster with ceaseless flooding and droughts in the near future. That potential is all very, very far-future. Not in the next 30 months!
What About Income Inequality?
This is another debate and an entirely social one. It isn’t for the market practitioner to be an expert on what’s good or bad for society in 30 years. My standard line when asked about this is: “I don’t do sociology.” What’s great in the far future could be really great, and what’s bad could be terrible, but neither impacts pricing today.
It’s fine to have and discuss opinions about sociological and political matters. Many impact daily life! Questions like, what’s the right long-term structure to educate our children? Vital to our future. But this isn’t my field. I don’t do sociology. Lots of people who chime in about sociology know nothing about it. People with no education, no background, no experience at age 19 think they know everything about sociology—and have a higher likelihood of being wrong. And I’m convinced most PhD sociologists know nothing about sociology either. But that’s another book. This is a book about markets! Your sociology is up to you, and you can believe whatever you want. But whatever your opinions, the issues are outside markets’ sphere and shouldn’t impact stocks now.
With income inequality, to be a contrarian, stay above the fray. This probably sounds callous, but it’s true: If the gap between haves and have-nots really is widening, it doesn’t matter for stocks. Some say inequality is a destructive political force that will be America’s downfall, but if that were true, America would have fallen during the Gilded Age.
Stocks don’t really care who has wealth as long as whoever has it keeps bidding prices higher. Inequality becomes a market issue only if politicians try to “fix” it through some massive redistribution scheme. And maybe they will! But not in the next 30 months.
Now, you’re probably a nice person, so you probably find all that a bit dismissive. Maybe you want more evidence so you don’t have to feel callous for not trying to guard your portfolio against income inequality. Well, here you go!
Those who argue inequality is (a) real and (b) a problem rely mostly on a study by Emmanuel Saez and Thomas Piketty, which claims to show that the highest earners take home an ever-larger share of US income.9 But glaring issues cast doubt on their conclusions. The figures cited most to support their premise are pretax and pre-benefit. They don’t account at all for the progressive income tax system this country has used since 1913 to address the very issue they raise. They also count capital gains on investments as “income,” which the US tax code hasn’t done for decades—and rightly so. Capital gains are a function of wealth. Wealth might come from high income, but it might also come from judicious saving and wise investing.
Another shortcoming: The Saez-Piketty study looks at household income, essentially pitting households with two or more earners against single filers, ignoring demographic trends. Today’s proportion of households with multiple earners is simply lower than in 1980—about when Saez and Piketty show the gap widening. If you’re pitting more divorced and single heads of household against multi-earner families, you’re going to get a bigger gap regardless of how much an individual earns. Then, too, Saez and Piketty don’t account for age. Of course a 24-year-old in his or her first job will earn far, far less than an otherwise comparable 58-year-old who has built up a high salary over an entire career. It’s not just me saying all this, either. Noted economists like the University of Michigan’s Mark J. Perry have done some excellent work on demographics and income. According to Dr. Perry:10
- In 2012, households in the top quintile of incomes had, on average, 2.04 earners. The bottom quintile had 0.45 earners.
- 77.5% of the top quintile were married-couple households, compared to 17% of the bottom quintile.
- 79.5% of the top quintile included one or more earners in their prime working years, ages 35 to 64. Only 47.3% of the bottom quintile had an earner in this age range.
From this angle, it becomes clear this is a sociological debate. Higher divorce rates and more single parents are political issues. Nothing a contrarian should think about in investing. And of course, who do you suspect has higher income on average: drug addicts or non–drug addicts? Sociology.
Inequality would be a problem if the economy were a fixed pie—if the 0.01% having more meant everyone else had less. But household incomes at all levels of society are up over time. Ditto for household net worth. Everyone is making more. Some folks are just making a lot more. Another study, whose authors include the very same Emmanuel Saez, shows social mobility is the same today as it was 50 years ago—opportunities are the same!11 Only the payout for success is bigger. Shouldn’t that provide more incentive? Who knows?
As long as Bill Gates’ billions don’t prevent any other American from striking it rich, widening inequality doesn’t matter. Might there one day be a ceiling? Could Congress legislate America into a fixed pie where Bill’s big slice means the rest of us get less? Maybe! But not in the next 30 months.
What if the Dollar Loses Its Place as the World’s Reserve Currency?
What happens to America if foreign countries start completing transactions in their own currencies? Will the dollar suffer if it’s no longer the king of foreign exchange reserves? Who knows! But it won’t happen in the next 30 months.
Folks have fretted over this one for decades. China’s occasional rumblings about diversifying away from dollars drive jitters anew. The noise spikes any time countries chatter about pricing oil in something other than dollars, as if America benefits from the dollar being a trade intermediary.
But America gets nothing from the dollar being used in international trade. We don’t get a brokerage fee. It’s also a big hassle for the other countries. They don’t trade in dollars because dollars are awesome—they just do it because it happens to be the world’s most convertible currency. Some currencies, like China’s yuan, aren’t directly convertible to many others. If a Chinese manufacturer wanted to sell gadgets to a Polish retailer, the Polish firm just has to convert its zlotys to dollars, buy the gadgets in dollars, and let the Chinese firm deal with the hassle of converting those dollars to yuan.
If the dollar is used less in international trade and finance, it just means more currencies are more directly convertible. That’s good! It probably means more trade happens over time. Great for everyone!
As for currency reserves—the real lightning rod—look closely at the evidence and you’ll see there’s nothing there. The media hype says if the dollar loses market share in foreign exchange reserves, US Treasury bonds will have fewer buyers, interest rates will skyrocket, and Armageddon will ensue. Bad! But not true, and we have proof.
First up, it’s time for the logic test. This fear is based on the assumption that reserve-currency demand is what keeps US borrowing costs low. So ask: How do US borrowing costs compare with non-reserve-currency nations?
Answer: Middle of the pack, at best or worst! Figure 4.4 shows benchmark 10-year government bond rates for America and six other major developed nations since 2009—about when dollar-losing-reserve-currency-status fears amped up. US rates about match Britain’s. Australia is higher. Germany, France, Japan and Canada are all lower. Being the world’s favorite reserve currency doesn’t let America borrow more cheaply than everyone else. Other variables play a huge role.

Figure 4.4 Benchmark 10-Year Government Bond Yields
Source: FactSet, as of 1/5/2015. Select 10-year benchmark government bond yields, 12/31/2008–12/31/2014.
Second, we can look at the actual foreign exchange reserves! The International Monetary Fund publishes them. You can download the full dataset at its website and see how much of each currency is held in reserve each year.12 Do this, and you’ll see two things:
- The dollar’s market share fell from 71% in 1999 to 61% in 2012.
- The total amount of dollars held in reserve jumped from about 980 billion in 1999 to over 3.7 trillion in 2012.
The reserve pie got bigger! So countries diversified. They still buy tons of dollars, but they buy euros, yen, sterling and a handful of others, too.
Losing market share has been just fine for America. Treasury demand is still sky-high. Interest rates are nice and low. The world is turning. Dogs and cats aren’t snorting coke.
As long as the United States has the world’s biggest, deepest and most liquid capital markets, it’s a safe assumption the dollar plays a big role in global currency reserves. There is a dearth of alternatives. The euro is on the rise, but as we learned in the PIIGS crisis, it has stability issues. UK gilts are great, but there aren’t many of them. What about China? As long as the yuan doesn’t trade freely or have market-set interest rates, it isn’t ready for prime time.
Counterintuitively, the same US debt load many fear is exactly why we’re the world’s reserve currency. Many believe cutting debt is the only way to shore up our reserve currency status, but this would just cut supply and force countries to look elsewhere for reserve assets. The solution would compound the supposed problem. Strange, but true! Tiny countries with tiny debt loads can’t be reserve currencies—too illiquid to matter. One of those perverse, overlooked ironies you should train yourself to see.
Could something happen to make foreign governments want to sell off dollar reserves all at once? Sure—anything is always possible! But probable? Not so much. It would take something catastrophic and heretofore unseen. A heated debt ceiling debate in 2011—complete with Standard & Poor’s downgrading America’s credit rating—saw Treasury demand rise, not fall. Budget bickering, a government shutdown and default threats from the US Treasury didn’t dent demand in late 2013. Big bear markets and recessions in 2000 and 2008? Foreign governments didn’t blink. Debt? Japan’s debt is way bigger than America’s as a percentage of its economy, and international yen holdings are rising.
Absent an asteroid hitting earth, this probably remains a very, very slow ebb. Not a disaster, not a surprise. We’ve seen it for 15 years now, and it’s certainly not an issue in the next 30 months.
What the Markets Know
If you take just one thing from these last two chapters, it should be this: When you read the news, watch CNBC or listen to the chatter at your favorite watering hole, and they’re yammering on about something big and bad, always remember the relatively efficient market.
As a contrarian, your best friend is the relatively efficient market. Know it. Love it. Remember it. Send it a birthday card.
The market is your weapon against media hysteria. Because you know how quickly markets work, you know all those short-term data and developments decried as instant doom are priced in. You’ve seen how quickly markets move on surprising earnings reports and economic releases—microseconds. You’ve seen how markets yawn when news isn’t a surprise—they already expected it, and expectations are pre-priced.
And because you know markets only look about 30 months out, you know all those annoying, noisy academic ideological and sociological debates don’t matter for markets right now. Maybe they do matter 20, 30, 40 or more years from now! Or maybe life changes in unimaginable ways and makes all those straight-line forecasts null and void. Or maybe sociological and weather-related issues never become actual economic concerns. But you can’t know any of that exactly today, and neither can markets. So for now, you can just breathe easy! If you can push it beyond the next 30 months, you don’t need to fear.
The herd will always fear myopic and far-future doom. Headlines always need something to chatter about! Just let ‘em. If they’re all doom-filled, you know you don’t need to worry about whatever they’re hyping. How? Because hysteria can’t be the elephant in the room! Everyone sees it! The market sees it! None of it is a surprise ever.
So while the crowd stares at static, it’s time for us to go elephant-spotting. What tools will you need for this living room safari? Flip to Chapter 5 and find out!