CHAPTER 2
For Whom the Bell Curve Tolls
In terms of rites and traditions, not much matches New Year’s. If you ever went on Family Feud and this category came up, you’d have a field day. Champagne toasts! “Auld Lang Syne”! Resolutions! Ryan Seacrest (Dick Clark for graybeards) counting down before a big glittery ball drops on national television!
Here’s another: professional investors’ annual market forecasts. Will they pop up in a game show? No way. But knowing and understanding them can help you make more money than game shows ever can, assuming a 50-show Jeopardy run isn’t in your future.
Parsing professional forecasts can also help you develop one of the most basic principles of contrarianism: thinking different, not opposite. Wall Street strategists are far more gameable than retail investors. As my old research partner Meir Statman and I found in a 2000 study for the Financial Analysts Journal, professional forecasters are wronger stronger and for longer than regular folks. Most individual investors are less stubborn and flip with trends—they won’t stand being wrong for too long before they flip. If they’re skeptical, four months of strong returns can turn them into bulls. If they’re getting optimistic, it just takes one big pullback to flip them back to skeptics. Amateurs often have less confidence in their views. As Meir and I found, when the media swings, individuals swing with them.
The pros are more stubborn. As we wrote then:
Individual investors and newsletter writers form their sentiments as if they expect continuations of short-term returns. High S&P 500 returns during a month make them bullish. The sentiment of Wall Street strategists is little affected by stock returns. We found no statistically significant relationship between S&P 500 returns and future changes in the sentiment of Wall Street strategists.1
Pros don’t flip like retail investors do. Their status breeds self-confidence—they’re darned sure they know where markets are going and are willing to be patient. They don’t give up the ghost, though they do mean-revert. If their forecasts for a year are too dour, clearly behind the mark halfway through, they’ll revise them up—just a bit, and largely so they don’t look ridiculous if the market finishes up strong. Many did this in 2014, pulling up their forecasts midyear when markets had already exceeded their full-year forecast for mid-single-digit returns—interestingly, the market then moved against them, with a third-quarter “stealth correction.” That’s The Great Humiliator (TGH) in action.
Armed with the knowledge that Wall Street pros are wronger stronger and longer—more often than not—we can game them. As we chronicled in Chapter 1, the curmudgeon posing as contrarian would say if all the pros are bullish, you should be bearish—and if they’re bearish, you should bullishly rage on. But as we’ll see, this is too black and white! Professional market gurus are wrong an awful lot, but not because the market always does the opposite of what they say. Understanding how and why they’re wrong—and why the market does what it does instead—is the first step to being right more often than wrong.
In this chapter, we’ll cover:
- Why most pros are mostly wrong most of the time
- What their wrongness really tells you about what markets will and won’t do
- Why nailing a forecast on the head isn’t important
Wall Street’s Useless/Useful Fascination With Calendars
Wall Street’s fascination with calendar-year return forecasts is largely foolish. Calendar-year returns don’t matter. It’s true! Market cycles are what matter, and market cycles don’t care about calendars. Rare is the bull or bear market that turns with the calendar page. No Standard & Poor’s (S&P) 500 Index bull market since 1926 began in January, and only one—1957 through 1961—ended in December. Maybe the next cycle aligns perfectly with the Roman calendar, or maybe it follows the lunar cycle. First time for everything! But nothing fundamentally changes when the calendar flips.
Yet Wall Street is fascinated with calendar years, and pundits like making yearly forecasts. They get headlines and eyeballs (always a good thing for a pundit). They’re splashy and easy for readers to make heads or tails of—just a number! A very specific number for an individual index. This makes them easy to track and grade, giving the pundits the aura of accountability, even if few bother filling out their report cards and almost no one looks at report cards afterward.
Everyone gets in on the action. The big wire houses dedicate whole teams of economists and in-house gurus to the cause. Many fund managers do it with cult-like media following. Smaller pros may do it in their quarterly reports. Bloggers and columnists commonly tell you, to the number, where they think stocks will go.
Individually, none of these forecasts are much use to the average investor. Numerical forecasts aren’t much use for these folks’ clients, either. They’re a sideshow! A pro’s forecasting report card doesn’t determine the returns their clients receive. Performance comes down to positioning. If they’re positioned for a bull market, and it pays off for clients, that matters far more than whether they predicted 7% or 20% in an 18% year.
The trick for professional forecasts is to use them without using them. Nope, that isn’t a typo! If you collect the whole batch of professional forecasts for a year, you get a marvelous snapshot of the general direction and magnitude Wall Street expects. And that gives you a pretty good idea of what the market likely discounts and hence won’t happen.
Professional Groupthink
Professional forecasters tend to fall into groupthink. They’ll never admit it! They all swear their views are unique, smarter, superior. Some surely are. Yet professional forecasts have a remarkable tendency to cluster.
There are always outliers. Usually a few pros get it right each year, whether they’re right for the right reasons or just plain lucky. But the bulk tend to fall in a pretty tight range, giving the market (The Great Humiliator) an easy target—a big chunk of experts to humiliate in one fell swoop, what TGH “discounts” into current prices.
The pros don’t deliberately cluster, per se. But they all use the same information, and they tend to interpret it in similar ways. What they agree on—the consensus—is the crowd, the herd or whatever you want to call what the market discounts in pricing and what the contrarian must avoid. Fundamentalists all look at the same Federal Reserve policies, economic pluses and minuses, interest rates, valuations and politics, and they all make the same assumptions about what’s good and what’s bad for stocks—and most are pretty, well, conventional, one way or another. They all have the same tendency to mean-revert—betting on the long-term average by assuming small or down years follow big years. The technical analysts all use the same charts, patterns and rule sets. It’s all the same widely known information the rest of the herd chews over daily. Dow Theorists follow Dow Theory. Those following Robert Shiller share the same broad interpretation of the wonky smoothed 10-year price-to-earnings (P/E) ratio he spearheaded (aka CAPE—Cyclically Adjusted P/E).
As a result, everything the pros agree on is priced. Their expectations for how events and developments will impact stocks? Priced! Perceived risks discussed in reports and articles? Priced! Market reality is exceedingly unlikely to occur as they expect. Even if certain events follow their predictions to a T, the market reaction probably won’t.
Contrarians get this. They know most investors will share the pros’ expectations. The media reports professional forecasts far and wide, and that influences most folks’ outlooks. Investing-as-a-science folks will often agree with the gurus who use similar methodology, logic and theory. Technicians usually side with the pros who use the same chart patterns and rules. Contrarians also know the curmudgeons will expect the opposite direction.
How the Contrarian Uses Professional Forecasts
Contrarians know the bulk of professional forecasts are priced. Won’t happen. But what, exactly, is priced? The actual number? If the consensus says 6%, would TGH hit them with 8%?
It might. But probably not! Wouldn’t be nearly fun enough!
Here’s the secret: The actual number isn’t so important. Markets look more at the general bucket. A 6% forecast is really just a prediction for returns somewhere in the low to mid-single digits. The difference between a 6% and 8% forecast largely is without meaning. If that’s where the bulk of professional forecasts fall, that’s your clue the market probably won’t land in that bucket. It might! TGH might decide to attack the curmudgeon anti-herd instead of the main herd—it has before (we’ll get to that). But more often than not, the market will end up doing something very different than what the bulk of professional forecasters expect.
Tracking the pros is easier than you think. Just takes some Googling and basic Excel work—and if you don’t know Excel, you can Google that too! (One of the Internet’s many miracles is its vast volume of technical tutorials.)
So with minimal time and perseverance, you can do what we do at my firm. Though I warn you, few readers ever will because it is counter-sensical. Every year, my firm’s Research staff rounds up all the professional forecasts for major countries’ benchmark indexes—S&P 500 for the US, DAX for Germany, Nikkei for Japan. You get the gist. For each country, we throw all the numbers into a simple chart. Histogram, if you want to get technical.
On the horizontal axis, we break the return spectrum down into 5% ranges: 0% to 5%, 5% to 10%, 10% to 15% and so on. Then, in each range, we stack up every forecast that lands in it. It’s like stacking Lego bricks with numbers on them.
What you usually end up with is a bell curve formation, with the fat part showing you the range where forecasts are most tightly clustered. If forecasts are clustered in the 0% to 5% and 5% to 10% ranges, that tells you most folks think markets will be up a little bit—single digits. Again, differences without distinction. If they’re all in the low negative and low positive single digits, you know most expect a flattish year. If they’re in the 10% to 20% brackets, folks expect a decent bull year. And if they’re in the –10% to –20% range, most expect a bear market.
Once you identify the direction and magnitude the crowd expects, you know what probably won’t happen. It’s even easier to narrow than you think! In broad terms, markets really do only four things—go up a little, up a lot, down a little or down a lot. Four outcomes! Maybe five if you count “flat.” Though, that’s happened exactly once in the S&P 500’s history—1947. As Casey Stengel said, you can look it up.
You can cross one of these broad outcomes off the list of potentials just by looking at the curve. Whichever of those four ranges the cluster lands in, you eliminate it.
This gives you three other choices. If everyone expects stocks to go up a little, TGH could surprise them with down a little, but it could also blow them away with up a lot or make them look foolish with down a lot. Curmudgeons, of course, would disagree with this. If the pros say up a little, curmudgeons assume down. If the pros say up a lot, curmudgeons plan for the apocalypse. Sometimes the curmudgeons are right! But banking on their assumptions won’t work with any sort of repeatability. TGH likes to thwack them, too.
To figure out which outcome is most likely, you must figure out whether the pros are overlooking opportunities or risks—we’ll cover this in the next few chapters. Listen to what the talking heads chatter about. What do they think are risks? What do they like? That tells you what’s probably priced. Where aren’t they looking? What are they misinterpreting? That’s where you find real risks and opportunities. Then look for things the crowd might be missing. And look globally! Are most folks overlooking bad monetary policy in multiple major countries? The existence of bad monetary policy isn’t enough—if everyone sees it, it is probably already baked into stock prices. You’re looking for things very few others discuss. Are new tariffs and restrictions about to make trade nosedive, yet no one notices? Are nasty regulations about to pound profits—and not yet understood by most (as with 2008’s mark-to-market accounting, implemented within weeks of the 2007 market peak)?
Of course, the sheer existence of these unseen risks isn’t enough to make stocks fall a lot. Markets move on probabilities, not possibilities. You have to weigh the probability of whatever unseen risks you spot actually coming true and whacking the world. Being out of stocks is one of the biggest risks long-term growth investors can take. If they’re wrong, and they’re on the sidelines in a big bull year, that’s a ton of lost ground to make up.
Even the Best Fall Sometimes . . .
As with pretty much every forecasting trick, there is a “but.” If it works well, eventually people catch on, they use it, and it gets priced and doesn’t work anymore—at least for a while, until they forget. That happened several years ago with this trick. It worked too well! Then it didn’t. But then the not working got priced. So now it works again. Someday, folks will catch on again, and as awareness that the sentiment bell curve is unpriced spreads, it will again be priced.
This isn’t unusual. I’ll get to this more in Chapter 5, but most investors have very short memories. I wrote a book about this very thing in 2011: Markets Never Forget (But People Do). True then, true now. When something doesn’t work for a while, folks forget it, and it regains its mojo. I call this the “elephant in the room”—the thing that’s always there, always has been there, but isn’t always seen. If an elephant is in your living room, that’s a big deal! When you first see it, you probably fall over! It’s an elephant! But after a while, if he stays, you might get used to him. Elephants are gray, so he probably blends in. You walk by and don’t notice. That gives him power to surprise you again if he starts moving. It’s the same with markets. If investors become too aware of something, whether it’s a trick or a risk, it loses surprise power. It’s just there, part of the long-term backdrop, nothing special. But once folks forget, it packs a punch again.
For several years, gaming professional forecasts was my secret trick, and it worked marvelously. In the old days, it was easy—we’d just use the professional forecaster surveys BusinessWeek would publish every December. That one page was all you needed to assess Wall Street sentiment—it was a good enough sample. Gaming one page let you game the herd! These days, with that publication no longer printing that page of assembled forecasters and owned by Bloomberg, rounding up professional forecasts takes more effort—scouring Bloomberg, Barron’s and other outlets. Doable, but harder than in the simple days of gaming one page in a magazine.
The following pages show professional forecasts and actual returns since 1996. These aren’t new—1996 through 2003, in Figure 2.1, are straight from my 2006 book, The Only Three Questions That Count. As I mentioned there, they all use forecasts from that one page of BusinessWeek. The charts from 2004 on are new to you, but they’re all from my firm’s research archives and use the same methodology—just with broader sourcing after Bloomberg Businessweek ceased printing that page.
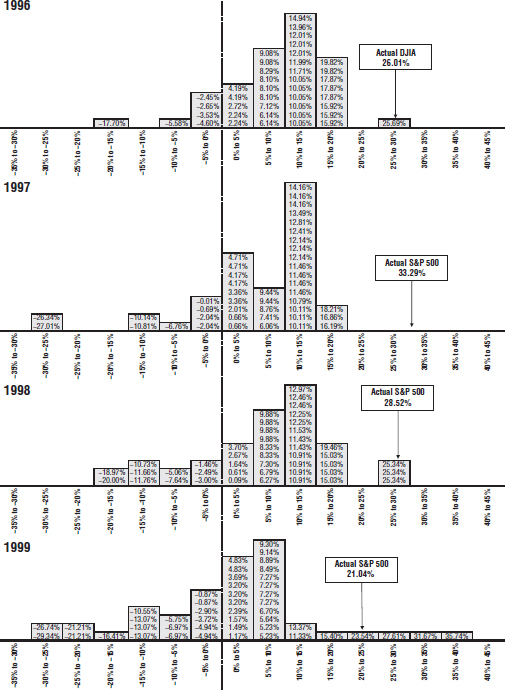
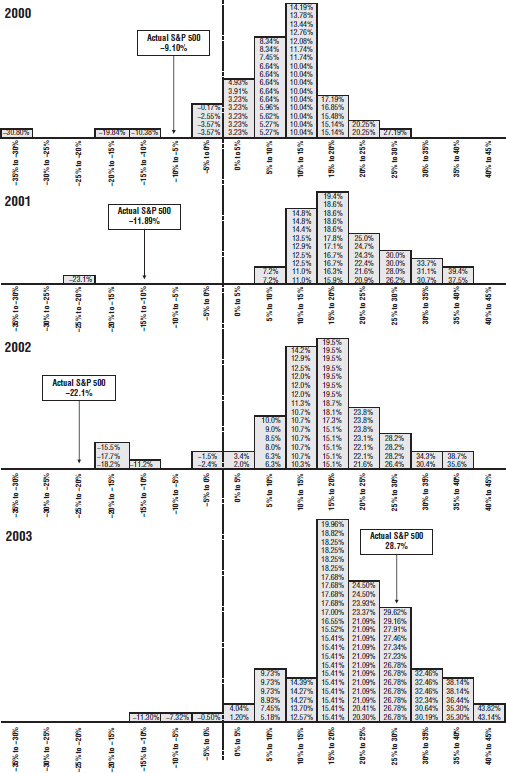
Figure 2.1 1996–2003
Sources: BusinessWeek, FactSet, Fisher Investments Research.
As you’ll see, from 1996 through 2002, the actual return fell far outside what most expected. In 1996, 1997, 1998 and 1999, the pros said up a little. Stocks did up a lot. In 2000, the pros got more bullish, but stocks fell. They got even more bullish in 2001 and 2002, but stocks fell even further. Those seven years, the market’s actual return fell near-perfectly outside the curve. Fully off the chart three of those times!
But in 2003, the pros called for up a lot, and that’s what the market did. The S&P 500’s total return, 28.7%, fell smack in the middle of the curve. When this happens, it’s tempting to brush it off. It’s random! My trick works! It can’t not work! But that’s pride talking—a deadly sin in investing. When the little voice in your head starts trying to rationalize wrongness, run away. Turn it off. Stop rationalizing, start thinking rationally. You (and I and everyone else) will be wrong often. The greats are wrong about a third of the time! That’s a lot of wrongness! If you rationalize, you can’t learn from these eventual errors. Learning from your mistakes keeps you a contrarian.
That’s what I did after 2003. Something had to be amiss, there had to be some fundamental reason the pros were right. I didn’t sweat it that hard—again, positioning matters, and we were full bull ahead. Plus, because professional forecasters are big-time mean-reverters, it went without saying they’d predict a big up year in 2003 after 2002’s nightmare.
But by the end of 2004, it was abundantly clear the bell curve trick needed to hibernate (Figure 2.2). That year, most forecasts clustered in the high single digits and low double digits. The S&P 500’s actual return fell smack in the middle, 10.9%. Then, too, Wall Street caught on! Some of the pros started publicly admitting they were now using something like this to game the herd, waiting till everyone else had made their forecasts so they could pick something outside the mainstream and have a better shot at being right. They were all tired of being wrong and wanted some of the glory for themselves. So like all new capital markets technology, it spread around, got popular, got priced in. Everyone was looking at the elephant, so it was time to look somewhere else.
Figure 2.2 2004
Sources: BusinessWeek, FactSet, Fisher Investments Research.
As you’ll see in Figure 2.3, it stayed broken for several years. Most of 2005’s forecasts were in the single digits. The S&P 500 delivered 4.9%. In 2006, predictions concentrated in the low to mid-teens. The actual? 15.8%. In 2007, forecasts clumped in the single digits, and the S&P’s 5.5% made them look smart.
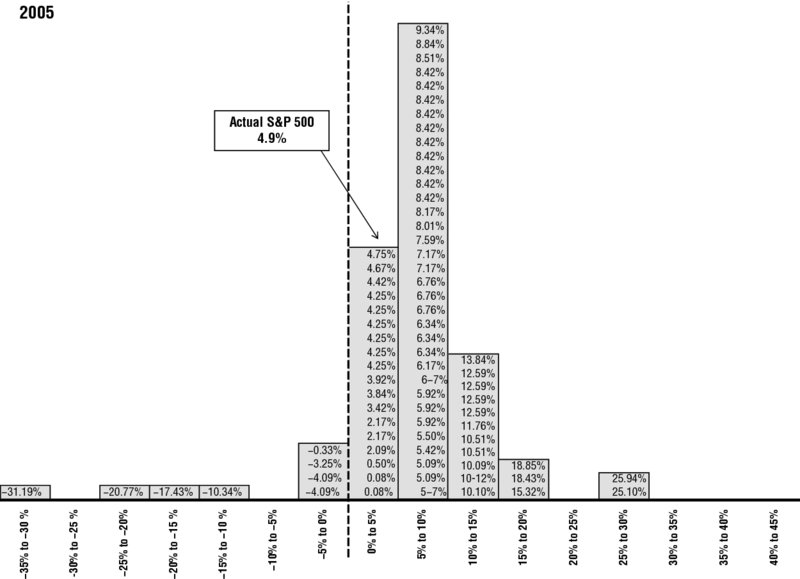

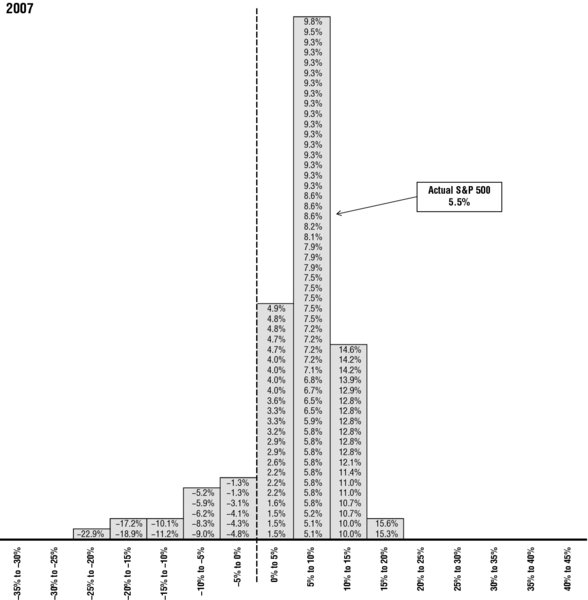
Figure 2.3 2005–2007
Sources: BusinessWeek, FactSet, Fisher Investments Research.
In 2008, the pros were wrong (Figure 2.4). Most forecast S&P 500 returns between 10% and 20%. I was wrong, too. We all got TGHed. After 2008, it would be tempting to say, Hey! It’s working again! But that’s another mistake—correlation without causation! There has to be a why.
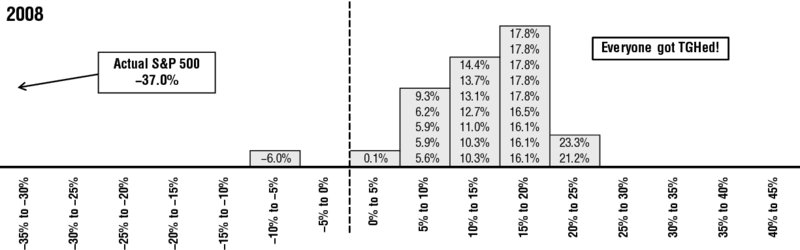
Figure 2.4 2008
Sources: BusinessWeek, FactSet, Fisher Investments Research.
The why behind professional forecasters’ wrongness in 2008 was simple and didn’t reveal whether the bell curve trick was working again. We all just missed the impact of the mark-to-market accounting rule before it was too late (as discussed in Chapter 1). As the year wore on and banks kept writing down assets, few could fathom that the Fed and Treasury would respond so inconsistently if more banks went under. That’s why stocks and the economy tanked, a huge bad that had not been priced.
I knew that going into 2009—I knew there was probably nothing magical about the pros being wrong the prior year. I also knew we were probably closer to the bear’s end than the beginning, so it would be foolish to position my clients’ portfolios for more bear market. Not when stocks bounce so high off bear market lows! So when a bunch of professional forecasters called for returns over 20%, I didn’t blink at joining them. Yes, they were all mean-reverting after a big down year—just like 2003—but even mean-reverters can be right sometimes. The chance of a down year was almost nil. Had to be a big up year—though many individual investors thought the opposite—and it was.
But something else happened in 2009. Even though a bunch of pros were right, the S&P 500’s actual return fell outside the bell curve’s biggest hump.
It happened again in 2010. (See Figure 2.5.) Then, forecasts clustered in the single digits, which just seemed wacky less than a year into a bull market, and with fundamentals firing on all cylinders. Only five of the gurus we tracked saw a down year, with only two predicting a nasty one.
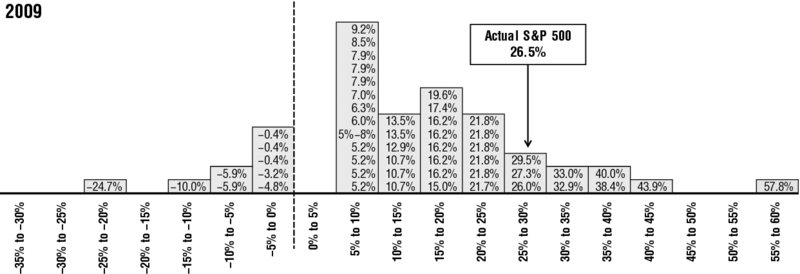
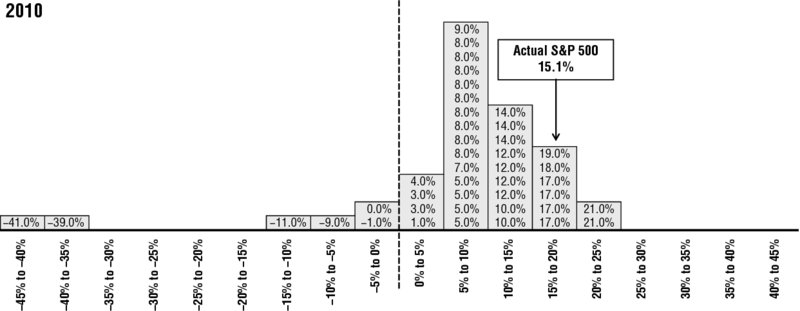
Figure 2.5 2009 and 2010
Sources: BusinessWeek, FactSet, Fisher Investments Research.
That was a good sign: They were still mean-reverting! Assuming a blah year had to follow a great one because, um, averages! Seemed to me they weren’t using the old bell curve trick anymore. They were grouping in an irrational place, and they seemed ripe for wrongness, ripe to be TGHed.
Here, the curmudgeon would say, with dozens of pros calling for up, it has to be down! But the economy was coming back, Emerging Markets were blazing, post-midterm gridlock seemed assured with the Democrats losing favor, and headlines were deeply pessimistic. Bad news was everywhere. Good news was ignored, couched as something that couldn’t last, or dressed up as bad. Slowish growth was a sign of a “lost decade.” Monetary and fiscal stimulus boosting demand was really just storing up impossible debt burdens for the future, or hyperinflation, or, or, or. With a wall of worry that big, big down looked least likely.
With the pros muted and the pundits dour, stocks seemed primed to go up more than most expected. And they did! Like 2009, the actual return—15.1%—wasn’t fully outside the curve, but it was outside the hump and moving toward more extreme.
How to Beat the Street
With returns now falling outside the bell curve’s hump again, it’s pretty well clear the pundits are all back to their old groupthink ways. Bad for them. Good for you!
Of course, eliminating the pros’ forecasts is only the first step toward figuring what stocks will do. Again, it simply narrows possible outcomes from four to three. I don’t have a crystal ball, so I can’t tell you what you’ll need to look at next year, the year after that or 20 years from now. But I can show you what I did the past three years. You can learn the approach, then apply it in any year you want—you simply need to know how to see and how to think.
In 2011, forecasting started with sentiment—see the below box which highlights my observations in the February 2011 issue of Forbes. The pros again hovered between the mid-single digits and low double digits, and the bull market was still in its early stages—ordinarily, prime pickins. But broader investor sentiment was wacky. Retail investors—my clients—and journalists seemed split.
Half thought 2011 would be amazing. Disaster hadn’t happened in 2010. No double-dip recession. Greece was going down the tubes and Ireland had to get a bailout, but the widely feared euro collapse never happened. After a correction midyear, stocks rallied hard. So the public’s mood improved some, with formerly cautious forecasters morphing to outright bulls—they just extrapolated the recent trend forward without an actual thought to the future. Never a rational move—and often something TGH likes to punish.
But better fundamentals didn’t sway all the steadfast doom-and-gloomers. They stuck to their bearish guns despite the many signs of improvement; 2011 would be the year the cratering eurozone periphery would really take down the world, or the US would double dip, or China’s luck would run out. The “perma-bear” contingent was larger. It also had more credibility after 2008—lots of “I saw it coming! I was right!” even though they were all bearish for the wrong reasons. Didn’t matter. Media bought the narrative. Perma-bear Nouriel Roubini was a global celebrity. Their influence, along with newly minted acrophobes scared by stocks’ rapid rise off the bottom, made a big down year unlikely. No fun for TGH!
So we eliminated the pros’ picks (Figure 2.6) and the two extremes. That left flattish. Now, this probably sounds bizarre for a young bull market, but it’s actually fairly normal. It was year three—often time for a pause, like 1994. All the signs said flattish returns were most likely—up or down a wee bit.
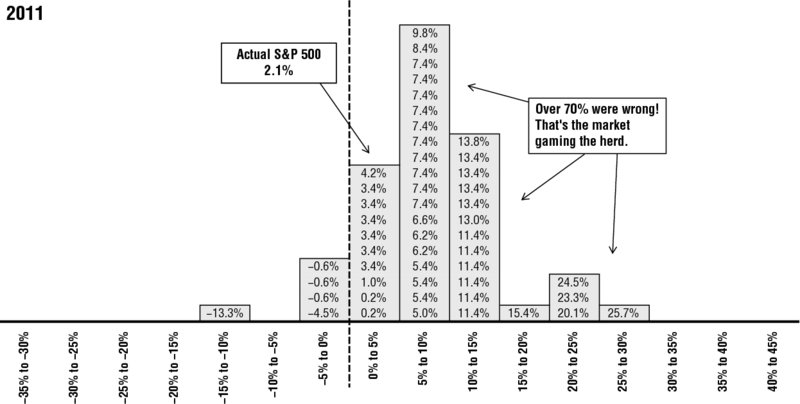
Figure 2.6 2011
Sources: Bloomberg Businessweek, Barron’s, FactSet, Fisher Investments Research.
The year itself was a roller coaster. Stocks started off nicely, then went through a nasty correction in summer—but gained a lot of it back, finishing up just a hair (after having been down –11.3% in early October).4
The year 2012 was more cut-and-dried (Figure 2.7). Once again, the herd was clustered in the single digits, with the average and median professional S&P 500 forecast at 7.3%. But a fair amount expected small negative returns—they were spooked after 2011’s wild ride. A handful saw low double-digit-positive years, and only one was wildly bullish. With 2011’s pause out of the way, economic fundamentals still strong, election-year gridlock keeping legislative risk low and sentiment building a big wall of worry, stocks seemed poised to surprise to the upside—and they did!
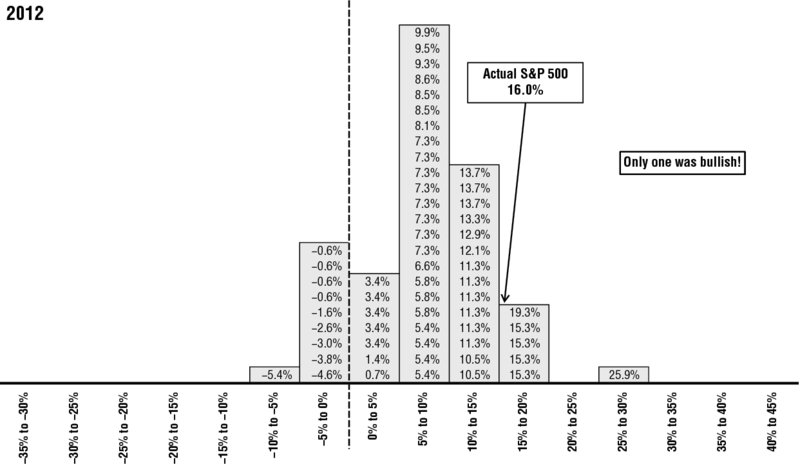
Figure 2.7 2012
Sources: Bloomberg Businessweek, Barron’s, FactSet, Fisher Investments Research.
In 2013 (Figure 2.8), the pros clustered between 5% and 15%—they expected an average year. When everyone expects average, that makes markets want to be extreme to shake them out of boredom—extreme up or extreme down. But there wasn’t any reason for stocks to tank. Bull markets usually run on until they lose steam or get walloped by a huge, unseen negative. Sentiment was still pretty dour, so losing steam didn’t seem likely—bulls lose steam when sentiment is super euphoric after climbing the proverbial “wall of worry.” Nor were there any wallops, as far as we could see. Just the same old cud folks had chewed over and over since the bull began—a big fat wall of worry. That meant a big fat year was most likely. So did the improving global economy, still-growing earnings, continuing gridlock and all the other good news folks continued ignoring. Stocks didn’t disappoint—they doubled the pros’ projections.
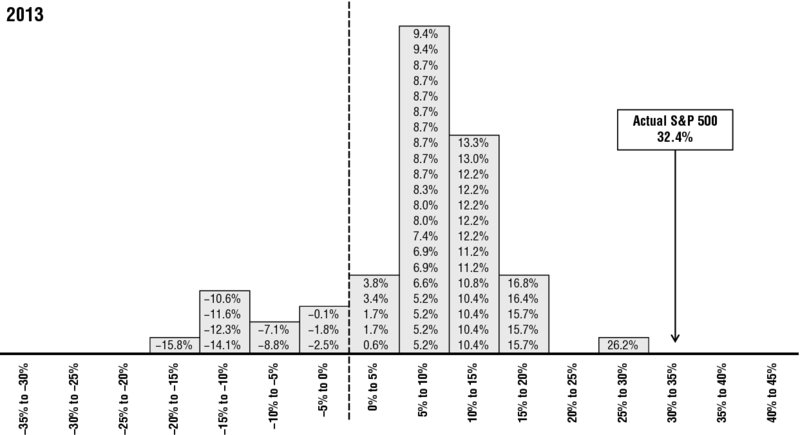
Figure 2.8 2013
Sources: Bloomberg Businessweek, Barron’s, FactSet, Fisher Investments Research.
Professionals clustered even tighter in 2014 (Figure 2.9), as the dug-in bears got less bearish and fear of heights made the bulls less bullish. After a gangbusters 2013, the bears became tired of being wrong. They’d spent years calling for 2008’s crisis to return, and it hadn’t. Most stopped believing them—boy-who-cried-wolf syndrome, as I explained it in Forbes. Meanwhile, the bulls were convinced stocks came too far, too fast in 2013. Only two predicted full-year returns above 10%.
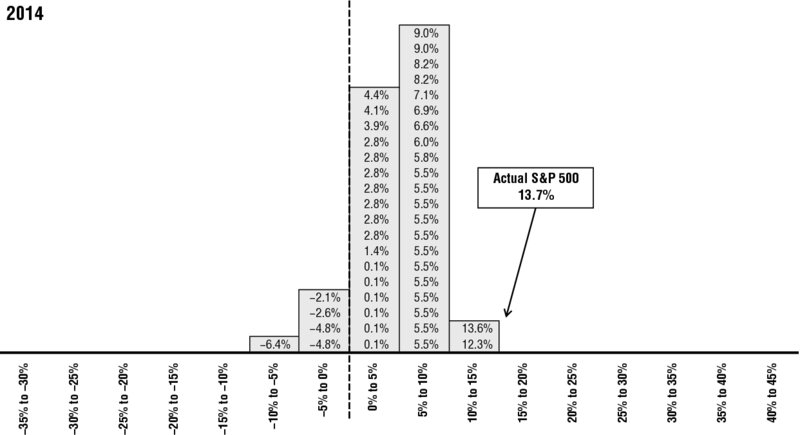
Figure 2.9 2014
Sources: Bloomberg Businessweek, Barron’s, FactSet, Fisher Investments Research.
The average S&P 500 forecast was about 6%, which meant you could discount low positive US returns. As I told Forbes readers in the January 20 issue: “When sentiment clusters like that my research shows stocks almost always do much better or much worse. Expect better!”5 I elaborated in the following issue: “To my study of history, that 19-percentage-point spread [between the highest and lowest forecast] is what is now discounted into pricing. Hence the market is most likely to continue booming, up 20%-plus, or officially correct, down more than 10%. All or nothing, embarrassing basically everyone. The downside happens if new, undiscussed big bad forces emerge. Shy of that the surprises are all on the upside. For now, believe in that.”6
In the end, no big bad shocker emerged. Nor did stocks officially correct, though an autumn dip came close. The S&P 500 finished up 13.7%, higher than the crowd anticipated, but not as high as I expected—TGH wanted to poke me, too!7 Again, gaming professional forecasts doesn’t tell you exactly where stocks will go, just where they likely won’t. That worked fine in 2014, even if we didn’t get that booming 20%-plus year. Besides, a portfolio positioned for a 15% year shouldn’t look different from a gangbusters year. A bull market is a bull market. The expected direction, not magnitude, should drive positioning.
Different, not opposite. That’s the key to using professional forecasts—and the key to being a contrarian. And as we’ll see in the following chapters, thinking differently can be as simple as asking, “Why are you thinking about that?”