
Chapter 11
Applying Data in Your Business: Decision Making
In This Chapter
![]() Identifying strategic business questions to improve your business
Identifying strategic business questions to improve your business
![]() Finding and analysing the data to help answer those questions
Finding and analysing the data to help answer those questions
![]() Communicating and acting upon what the data tells you
Communicating and acting upon what the data tells you
I believe data should be at the heart of strategic decision making in businesses, whether those businesses are huge multinationals or small family-run operations. Data can provide insights that help you answer your key business questions such as ‘How can I improve customer satisfaction?’ Data leads to insights; business owners and managers can turn those insights into decisions and actions that improve the business. This is the power of data.
In this chapter I look at the process for applying data to your decision making – from identifying your key business questions to finding data, analysing it and incorporating insights from the data into the business.
 This process is broken down into ten steps and I explore each step. Don’t be tempted to skip steps or jump ahead to juicier parts – the strategic steps are as important (if not more) than the data itself. It’s best to follow the steps in order. This ten-step process of applying data to business decision making is one that I have used with clients time and time again. I find it’s a simple blueprint to follow and I hope it helps you navigate your big data journey.
Unless you’re a tech wizard (or someone in your company is), it’s likely you will need some expert help at some or all of these stages, such as a data consultant and data analyst. While there is some financial outlay involved, in most cases this is earned back via the long-term business improvements gained from data insights.
Starting with Strategy
If you’ve read any other chapter in this book already (or read anything anywhere about data), you can probably understand that it’s easy to get overwhelmed by the possibilities that big data provides. It’s easy to get lost in the noise and hype surrounding data. Starting with strategy helps you ignore the hype and cut to what’s going to make a difference for your business.
Instead of starting with what data you could or should access (which is a recipe for failure and instant overwhelm), start by working out what your business is looking to achieve. In a nutshell, you need to work out what your strategic goals are – for example, increasing your customer base.
I recommend you read Chapter 10 before embarking on defining your strategic goals as it underlines the importance of strategy and gets you thinking about what it is you want to achieve.
Introducing the SMART strategy board
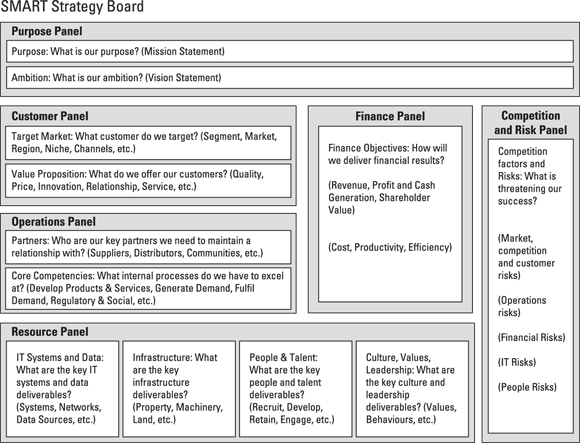
To help my clients take a step back and identify their strategic goals, I developed the SMART strategy board, shown in Figure 11-1. You can use the SMART strategy board to consider your strategic objectives for each key area of your business. Once you understand your objectives, you can then highlight key strategic questions that will help you achieve those objectives. (I get to that in ‘Identifying Your Unanswered Questions’ a bit later in the chapter.)
© Bernard Marr
Figure 11-1: The SMART strategy board.
There are six panels in the SMART strategy board:
- The purpose panel
- The customer panel
- The finance panel
- The operations panel
- The resource panel
- The competition and risk panel
 You can’t identify what data you need if you’re not clear about your strategy. The value of data is not the data itself – it’s what you do with the data. Having really clear objectives helps you get the most out of data.
Completing the SMART strategy board
So that you can complete the board, look at each of the individual panels in turn.
The purpose panel
This sets the scene and provides an inspiring framework or overall context regarding your corporate strategy, or what your business is aiming for or seeking to achieve. You can do this by detailing your mission and vision statement – each doing a distinctly different job. Your mission statement is a clear, concise statement of purpose setting out why your organisation exists. It should include your target audience, what products or services you provide to that audience and what makes your product or service unique. Your vision statement also defines purpose, but from the perspective of what you want your business to be in the future.
The customer panel
Here you need to consider how much you currently know about the customers your strategy is targeting. There are two parts to consider – target market and value proposition. Considering your strategy (including your mission and vision), you ask questions including: what is your target market? Are you planning to appeal to a particular segment? If so, why, and what do you know about that segment? Your value proposition is what you’re going to offer your target market. Why are these customers going to buy from you?
The finance panel
This prompts you to think about how much you currently know about the financial implications of your strategy. How does your strategy generate money? What is the business model and are you confident it’s accurate? What assumptions have you made about the revenue, profit and growth of your business as you implement the strategy? How much will it cost to produce and deliver your product and services? Do you know for sure or is it a guess?
The operations panel
The operations panel prompts you to consider what you actually need to do internally to deliver your strategy. There are two components: partners and core competencies. First you need to consider which suppliers, distributers, partners or other intermediaries are crucial in delivering your strategy. Do you currently work with these people or will you need to create the relationships? If the relationships already exist, how healthy are they right now? You also need to consider what core competencies you need to excel in if you’re going to execute your chosen strategy. Are there any gaps? If so, how easy is it going to be to fill those gaps?
The resource panel
There are four components of the resources panel: IT (information technology) systems and data; infrastructure; people, talent and cultures; and values and leadership. For each, you should consider what resources you need in order to deliver your strategy.
The competition and risk panel
Here you consider what competition you will be up against as you seek to deliver your strategy and what risks you may face along the way. Considering your aspirations, who is your main competition and why? What is potentially threatening your success? Are there any specific market, customer, competition or regulatory risks that could derail your strategy? What are the operational, financial or talent risks you face?
Honing in on the Business Area
Having looked at each area of the strategy board, you now need to identify which areas are most important to achieving your overall strategy. If you could only work on improving one or two of these areas, which would you choose?
For most businesses, the customer, finance and operations panels are the key areas. Often these are the core of the business, so it’s important to consider how they impact on each other and how they work together. So, if you identify the customer panel as being your most important, you’ll need to consider the financial and operational implications of any decision.
Identifying Your Unanswered Questions
After you identify your objectives and consider each area of the strategy board, you need to identify the unanswered questions that relate to each panel. For example, what do you need to know in each area of the business to be able to achieve your goals? Throughout the book, I use the phrase strategic questions. What I really mean is SMART questions.
You need to know what questions you need answers to before you dive into data – big or otherwise. Focusing on SMART questions allows you to forget about big data and focus on SMART data. By working out exactly what you need to know, you can hone in on the data that you really need.
For each panel on the board, except the purpose panel, identify a few SMART (or strategic) questions. When you know the questions you need answered, it’s much easier to identify the data you need to access in order to answer those key questions (I get to data in the next section). Your data requirements, cost and stress levels are massively reduced when you move from ‘collect everything just in case’ to ‘collect and measure x and y to answer question z’. Check out the nearby sidebar for a few sample questions.
Understanding the power of questions
When you start with a simple question and seek to find and analyse only the data that can directly answer that question, then you move away from the overwhelming idea that you have to have all the data and the panic that you’re going to need to collect and analyse everything, to a much more manageable and sensible enquiry. That’s the power of SMART questions.
SMART questions help you and your people to:
- See the wood from the trees regarding what’s important and what’s not.
- Understand the relevance of the data sought because SMART questions indicate to everyone what your company’s biggest concerns are.
- Open communication and guide discussion.
- Make better evidence-based decisions.
The do’s and don’ts of SMART questions
When identifying your questions, do:
- Identify a small number of SMART questions for each panel (between two and five).
- Engage key personnel from each panel in the creation of the SMART questions to facilitate buy-in.
- Make your SMART questions clear and concise.
- Use your SMART questions to guide your data needs. Focus only on the data that answers your questions.
Here are some common pitfalls to avoid:
- Getting carried away and listing everything it would be vaguely interesting to know. Not only is this expensive data-wise, but it’s unlikely to help you achieve your strategic goals.
- Lumping unrelated questions in together (maybe so it looks like you’ve got fewer questions!). Instead, keep each question really tightly focused.
- Asking certain questions because you know you have the data already. This is a false economy if those questions aren’t going to help achieve your goals. Don’t think about the data until you set out your questions.
Finding the Data to Answer Your Questions
The next step is to identify what data you need to access or acquire in order to answer your SMART questions.
It’s really important to understand that no type of data is inherently better or more valuable than any other type. The key is to start with your strategy and establish your SMART questions so that those questions guide you to the best data for you.
To work out what data you’re going to need, you should consider each of your SMART questions separately. Go through the various panels from the SMART strategy board (refer to Figure 11-1) and describe the ideal data sets that would help you answer each SMART question (see Chapter 5 for examples of how businesses are using data). You will probably need to consider more than one data set.
Make a note of which data sets you intend to use or could use. A good data consultant will be able to help you with this. Describe the data for each data set and make a note of its location and who owns it. Consider whether the data you need is internal or external and structured or unstructured (see Chapter 4). If external, who owns it? How much do you need? How would it be analysed? You can then choose the best data options to pursue based on how easy the data is to collect, how quick and how cost effective.
There is a logical hierarchy of where you should first look when identifying the data that will answer your SMART questions:
- Internal structured data. This is easiest to find and easiest to analyse. It is also probably the least expensive to acquire.
- Internal semi-structure.
- Internal unstructured.
- External structured.
- External unstructured.
Forgetting what you have or what’s out there
What I mean by this is: Don’t concern yourself with all the metrics and data that currently exist. Don’t worry about what data you can and can’t get your hands on at this stage (I get to that in the next sections). The data possibilities are endless … and distracting.
What you should be doing at this stage is focusing on identifying the ideal data for you – the data that could help you answer your most pressing questions and deliver on your strategic objectives.
Thinking big and small
The trick with data is to focus on finding the exact, specific pieces of data that will benefit your business. Instead of collecting or accessing as much data as possible, your aim should really be to gather as little data as possible while still reaching your objectives. This might mean you don’t need much big data at all, but can instead gather insights from smaller data like your transaction records or customer feedback surveys.
Many people in business are too focused on external unstructured data – this is the sexy stuff (if any data can be called sexy!). But this is a mistake. If you can effectively answer your SMART questions from internal structured data why on earth would you waste valuable time seeking the answers anywhere else?
In reality, most businesses need a combination of datasets in order to answer their questions – some big, some small, some internal, some external. I’ve found it’s this combination of small, in-house data and external big data that is especially powerful.
Identifying What You Already Have or Have Access To
Internal data accounts for everything your business currently has or could access. A lot of the time this isn’t considered very exciting, and people tend to skip over what they have in favour of external data. But I think this is a huge mistake. Internal data can be a gold mine, even if you need to combine it with some external data to get a fuller picture.
Once you’ve identified the data you need, it makes sense to see if you’re already sitting on some of that information, even if it isn’t immediately obvious.
Does it exist in some form somewhere?
Internal data includes private or proprietary data that is collected and owned by your business and that you control access to. Examples of internal data include:
- Customer feedback
- Sales data
- Employee or customer survey data
- CCTV (closed-circuit television) video data
- Transactional data
- Customer record data
- Stock control data
- HR (human resources) data
 This data may be in a range of formats, some of it neat and tidy and some of it messy. Keep in mind that some work may be needed to tidy the data to make it ready for analysis before you can get started.
Internal doesn’t always mean cheap
Internal data is usually less expensive than external data, but that isn’t always the case. For example, if all your past customer records are on microfiche, although it’s internal and you own it, it would be very costly to get all that data converted to digital format. It may be that there is an alternative external solution that could prove cheaper in the long run.
If you need external data
So you’ve worked out what you have and haven’t got access to. You may find you also need some external data. External data is the infinite array of information that exists outside your business (see Chapter 4). External data is either public or private, meaning either it’s data that anyone can obtain or it’s owned by a third party. Your data consultant will be able to help you identify the best external sources for your needs, but there’s a list of the top free external sources in Chapter 15.
Working Out if the Costs and Effort Are Justified
Many business people think big data is simply beyond their budget or it’s the domain of multi-million- (or billion-) pound businesses. The answer is yes, of course big businesses have the resources (money and talent) to tackle big data. But that doesn’t mean smaller businesses can’t. Massive increases in storage and computing power, some of it available via cloud computing, means the costs are declining. Some of the technology used to capture data (such as sensors) is now incredibly cheap and easy to source. Big data has never been cheaper.
Once you have identified your ideal data sets, you need to work out how much it will cost you to work with the data. For each data set, you need to set out how much it will cost you to capture or retrieve the data, how you plan to analyse the data, the costs of that analysis and how much it will cost to store the data safely.
Although the cost of data is falling all the time, it can still add up if you get carried away. This is why it’s crucial to focus only on the data that you really need.
Only after you know the costs, can you work out if the tangible benefits outweigh those costs. At this stage it’s helpful to make a solid business case (a business plan, if you like) for using data in your business. In this respect, you should treat data like any other key business investment. You need to make a clear case for the investment that outlines the long-term value of data to the business strategy. Making a proper business case gives you the best chance of successfully using data in your business as you can get buy-in from all areas of your business. Turn to Chapter 10 for more information on creating a solid business case for big data.
If you find that the cost of a particular data set is very high, you need to be really sure the answer you will derive from the data is strategically important enough to warrant the time, money and effort. Of course, you also need to weigh up the potential cost to the business if you don’t go ahead (for example, if you don’t increase your customer base). If you believe the costs outweigh the benefits, then you may need to look at alternative data sources.
Collecting the Data
Much of this step comes down to building big data competencies and infrastructure, which sounds scary but really just means setting up the processes and people who will gather and manage your data. Here I’m just relating this step to decision making, with a couple of examples on what worked for one of my clients. Circle back to Chapters 8 (competencies) and 9 (infrastructure) for more detailed information on what is required.
Deciding who will collect it
Once you know what data you need, your next step is to identify who will collect it. You may be buying access to an analysis-ready data set, in which case there is no need to collect data as such. But, in reality, most data projects require some amount of data collection.
Who collects this data will depend very much on your questions and what data you’re looking to create or capture. In Chapter 9 I explore the various ways of creating and capturing data (such as surveys, asking people to rate products, using transaction data). Some of this can be captured in-house relatively easily – for example by your website or by your customer service people. Some will require external help and you’ll find guidance on tapping into external service providers in Chapter 8.
Deciding when it will be collected
Is the data changing rapidly? Is it collected frequently and how recent is it? These are all things you need to consider at this stage. There is no rule of thumb for when to collect data except for when it will best answer your SMART questions.
 The retail client in the ‘Choosing SMART questions’ sidebar earlier in the chapter wanted to increase sales. For that client, the best solution was to collect data continually to understand how many customers pass the shop and to be able to run experiments to see which window displays were most effective in attracting customers into the shop.
Deciding how it will be collected
Data collection tools include sensors, video, GPS (global positioning systems), phone signals, social media platforms … the list goes on. What tool or tools you choose depends on your strategic questions and who is collecting the data and when. As a starting point, I set out my top ten data collection tools for small businesses in Chapter 16.
Back to the retail client from the ‘Choosing SMART questions’ sidebar that was looking to improve sales. What we did was install a small, discreet device into the shop windows that tracked mobile phone signals as people walked past the shop. Everyone, at least everyone passing these particular stores with a mobile phone on them (which nowadays is almost everyone), was picked up by the sensor in the device and counted, thereby answering the first question: How many people actually pass our shops? The sensors also measured how many people stopped to look at the window and for how long, how many people then walked into the store, and the company’s internal sales data would record who actually bought something. By combining the data from inexpensive, readily available sensors placed in the window with transaction data, we were able to measure conversion ratio and test window displays and various offers to see which ones increased conversion rate. Not only did this fashion retailer massively increase sales by getting smart about the way it combined small traditional data with untraditional big data, but it used the insights to make a significant saving by closing one of its stores. The sensors were able to finally tell them that the footfall reported by the market research company prior to opening in that location was wrong and that the passing traffic was insufficient to justify keeping the store open.
Analysing the Data
Data and analytics go hand in hand. You need to analyse the data in order to extract meaningful and useful business insights. After all, there’s no point coming this far if you don’t then learn something new from the data. As such, the field of analytics is growing in line with the growth of data.
In Chapter 2 I explore the four V’s of big data: volume, velocity, variety and veracity. Analytics provide the fifth, and perhaps most important, V of big data: value. Analytics allows you to identify patterns and this knowledge is crucial to improving the way you do business.
You need to understand what’s possible before you can confidently decide what analytic techniques are best able to deliver answers to your questions. The bottom line is this: data is just information and there are only a set number of ways that information exists and/or can be presented.
There are five key formats in which business data exists (see Chapter 5 for more information):
- Text data (including numbers)
- Sound data (audio files and music)
- Image data (photographs and graphics)
- Video data (combination of audio and visual)
- Sensor data
The most common types of analytics are as follows (there’s more on analytic technology in Chapter 6):
- Text analytics
- Speech analytics
- Video/image analytics
The past few years has seen an explosion in the number of platforms available for big data analytical tasks. Some are free to use, like Hadoop, but it’s very technical to set up and not specialised towards any particular job or industry. To use it well in your business, you need a platform to operate it from, such as Cloudera or Microsoft HDInsight. I recommend getting specialist advice (ideally from a data consultant) on which platform is best for your business.
In-house analysis versus external analysis
Some platforms require nothing more than a working knowledge of Excel, meaning most employees can dip their toes into big data analysis. However, in many cases, data requires a more experienced analytical hand.
Because of this, people often believe that in order to start using big data, they need to bring in expensive data scientists as full-time employees. That’s not necessarily true – a good consultant can get you set up and an external analyst can help you understand your data long before you need to bring in a full-time data scientist. But, if data is going to be a core, ongoing part of your business, then it’s worth considering employing an in-house analyst or data scientist.
The advantages of in-house analysis include increased control over the project, greater flexibility (for example, if you identify a new strategic question, you can run with it fairly easily) and keeping a tighter rein on the costs of analysis by paying a set salary.
The flip side is that in-house analysis could be a false economy. An external analysis firm may be better set up to provide the analysis you need, meaning it’s able to do it more quickly, easily and cheaply. Outsourcing analysis may not be as expensive or difficult as you think. Of course, the downside to using external providers is that you have less overall control than if the analyst is a direct employee.
There’s no right or wrong answer here. Talk to your data consultant about what’s the best solution for your project.
It’s very easy to be seduced by some of the really cool analytic capabilities that currently exist. Don’t be led astray by the marketing blurb – your job is to find the best, most accessible and inexpensive technique possible, regardless of how sexy it is.
Chapter 8 has more information on partnering with external providers and recruiting in-house talent.
Combining data to improve and validate insights
Like data itself, the value is not just in one data set over another; the real value comes from the combination of data sets and the combination of analytics tools to analyse that data (like the retailer I worked with who ran analytics on a combination of sensor data, traditional sales data and video data).
I think it’s always better to have two data sets than one and, if possible, you should have three. Three data sets allow you to triangulate or verify the data from different perspectives. So if one data set is structured internal (for example, sales data) and another is unstructured internal (for example, customer comments) and another unstructured external (for example, Facebook data), then you will almost certainly get a much richer picture of what’s happening so you can answer your SMART questions more effectively and accurately.
Presenting and Distributing the Insights
Big data and analytics may well pave the way to some really cool innovations, greater customer understanding and real-time monitoring of what’s actually happening in the business. But unless the results are presented to the right people in a meaningful way, then the size of the data sets or the sophistication of the analytics tools won’t really matter and the results will not inform decision making and improve performance.
Big data or any data analytics is only useful if you make sure the right people get the right information, in the right format, so they can make the right decisions more often.
Presenting insights isn’t as cool as analytics, but it is important. And anyway, these days there are more interesting ways to present data and exciting tools to help you do it.
Communicating and visualising insights
People don’t want to search for the insights locked within the data. They want their insights provided to them, nicely packaged in a way that helps them understand the messages and make decisions that improve the business.
Huge written reports or long-winded verbal explanations are a sure-fire way to bury insights. Instead, wherever possible, present insights from your data using visuals, such as graphs (bar graphs and line graphs) and charts (pie charts and scatter charts). Visualising the data through graphics can not only make the data more accessible and meaningful but also can better illustrate the relationship among the data.
Big data analytics have created a wave of new visualisation tools capable of making the outputs of the analytics look pretty and making them quicker and easier to understand. Many of these tools are open-source, free applications (see Chapter 9 for examples).
Visualisation is not the only goal – beautiful graphics can still be meaningless! Make sure your insights shine through with these top tips:
- Where appropriate use short narratives to introduce what you’re showing and highlight the key insights. Numbers and charts may give only a snapshot; narrative allows you to embellish on key points.
- Use clear headings to make the important points stand out. This way, even at a quick glance, the key points will be obvious.
- Link the information to your strategy. If your visualisation presents data that answers a SMART question, then include the SMART question in the opening narrative and maybe even the headline.
Keeping in mind the target audience
Too often in business, reports are disseminated to everyone just in case they’re useful. Instead, consider who really needs the results in order to make better strategic decisions and tailor your data visualisation to their needs. This is a two-step process:
-
Identify your target audience.
Who your audience is depends on your SMART questions (it could be you if you’re the business owner, or it could be your HR team, your marketing team or a combination). Ask yourself who is going to see these results. What do those people already know about the issues being discussed? What do they need and want to know? And, what will they do with the information?
-
Customise the data visualisation.
Based on the answers to your SMART questions, be prepared to customise your data visualisation to meet the specific requirements of each decision maker.
Dashboards and infographics
Some analytics that you run will be one-offs, answering a specific SMART question or questions. The results can then be reported via data visualisation or through the new trend of infographics.
However, you might have other data sources that you want to continuously measure, particularly if they relate to ongoing strategic, tactical or operational issues. If they need to be reported regularly, then the best way to do that is to create a management dashboard or key performance indicator (KPI). Dashboards and KPIs provide a concise visual display of relevant ongoing results, helping your key decision makers to keep the business on track toward its objectives.
 There are two kinds of dashboards: operational and strategic. Operational dashboards monitor day-to-day processes and outputs to make sure expectations and performance are met consistently. They provide information that allows you to fix issues before they become problems and incrementally improve performance. Strategic dashboards, on the other hand, look to the future and seek to identify obstacles and challenges that may occur on the way to the strategic destination.
Infographics is an area that has grown alongside big data and analytics. As the ability and opportunity to analyse more and more data has grown, so too has the need to find ways to communicate and report the results in ever-more snazzy ways.
An infographic – a hybrid of information and graphics – is a one-page visual representation intended to express a lot of information, data or knowledge quickly and clearly. An infographic of a detailed report, data analysis or employee survey, for example, can tell the whole data story through a one-page visual map. After all, everyone has time to look at one page!
Figure 11-2 is an infographic I created about big data.
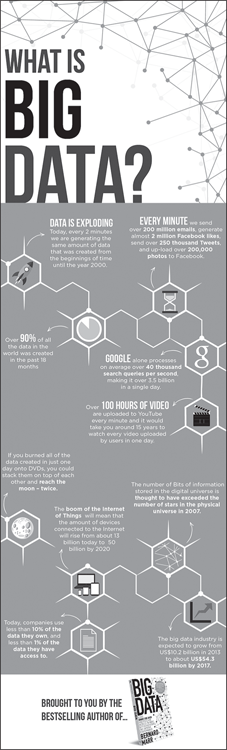
© Bernard Marr
Figure 11-2: An infographic: What is big data?
There are three distinct parts of a successful infographic:
- Visually attractive: Using colour, graphics and icons
- Useful content: Using time frames, statistics and references
- Imparting knowledge: Using facts and deductions
A good infographic should look good, engage the reader by simplifying content and provide meaningful answers and insights into important SMART questions.
Whether you decide to report results through traditional reporting with some data visualisation techniques or whether you opt for management dashboards and/or infographics will very often depend on your in-house expertise. But one thing’s for sure, if you want to be a SMART business, you must develop these competencies either in-house or outsource to a trusted provider. Either way, data analysis and data visualisation are two sides of the same coin.
Incorporating the Learning into the Business
Clearly I find the whole big data process exciting and fascinating, but this step is probably the one I find most rewarding. This is where you get to turn data into action. In this step, you need to apply the insights from the data to your decision making, making the decisions that will transform your business for the better.
All these insights are not worth anything if you don’t use that knowledge to improve your business.
Making the right decisions
Once you have done all that you can with the data, and you’ve communicated your insights to the key people in the company, it’s time to review the evidence so that everyone in the business can move toward more fact-based decision making and leverage data to meet your objectives.
You can use the insights gained from the SMART process to improve your decision making, your customer experience, your employee brand and your business performance and to gain competitive advantage. You can solve problems, react to opportunities, enhance product quality and improve efficiency. The power of data is in how you use it. For more on building a culture of data-based decision making in your business, check out Chapter 13.
Finding questions for the future
Some of the strategic questions you’re asking will be one-offs; some will be ongoing issues that you want to keep an eye on. And some of the answers you discover may lead to entirely new questions that you want to explore in future.
Naturally, your focus in this process should be on your initial strategic questions. But, once you have identified and answered those strategic questions, you may find that the data also points to interesting new opportunities or questions. If you have the appetite and resources to take the data further, then go for it.
The trick is to stay vigilant and be aware of any new questions or opportunities that your data exposes. For some businesses, data even leads to an entirely new business model. There’s more on this in Chapter 13.