CHAPTER ONE
THE STOCK MARKET CAN WE WIN AT THIS GAME?
The investor’s chief problem—and even his worst enemy— is likely to be himself.
BENJAMIN GRAHAM, FATHER OF VALUE INVESTING,
SECURITY ANALYSIS, 1934
INDIVIDUAL INVESTOR PERFORMANCE VS. THE MARKET
MANY MODERN-DAY investors have become like crazed gamblers, risking their nest eggs and retirement money on visions of a chance at 20 percent-plus returns on their investment portfolios. Most of them don’t even take the time to read a financial statement, yet they scamper to brokerage firms and mutual funds, surrendering every spare cent they can on a stock market system few of them understand. Greed, advertising, and peer pressure have lured them into a terrifying real-life game with sky-high stakes of fortune or poverty.
That’s gambling.
Have investors forgotten that stocks do not exist just to give us a lottery ticket to future riches? Stocks finance the agendas of business and their corporate executives. It’s a system run by professionals who spend a lifetime mining riches, at times contrary to the letter of the law. In the end, when the vein is dry, the gold is in their account; the fool’s gold is what’s left in our portfolios.
12Who’s Winning, Really—the Cold, Hard Facts
When it comes to making investment decisions, as Benjamin Graham said, the individual investor is often his or her own worst enemy. In June 2001 the research firm Dalbar Inc., of Boston, released a study entitled “Quantitative Analysis of Investor Behavior.” The study examined real investor returns from January 1984 through December 2000. It found that the individual equity mutual fund investor realized an annual return of 5.32 percent compared to 16.3 percent for the S&P 500 index. In addition, the study found mutual fund investments were retained for an average of only 2.6 years.1
The severe underperformance relative to the S&P 500 index and the frequent trading indicate very poor timing on the part of the individual investor. Dalbar previously conducted similar studies in 1994 and 1998. The 1998 study found that the return of the S&P 500 was five and one half times greater than the return earned by the average investor. All three studies showed that the typical mutual fund investor earned inferior returns to the S&P 500 as well as the average mutual fund.
Money magazine published a study by Charles Trzcinka, professor of finance at Indiana University, in June 2002. This fascinating analysis described the difference between the returns that mutual funds report and those of the average investor in the funds. According to Professor Trzcinka, the average mutual fund gained 5.7 percent during the four-year period of the study between 1998 and 2001, while the average investor earned only 1.0 percent. The study analyzed the returns of more than 6,900 U.S. stock mutual funds and adjusted for money that was shoveled in and yanked out during the period.
The table that follows enumerates some of the details of this unique study. The large disparity between the fund’s stated returns and the amount investors actually realized was a surprise even to Professor Trzcinka. According to the professor: “The sheer magnitude of the difference we discovered 13between the total returns earned by mutual funds and the results captured by the average shareholder is shocking and tragic.”2
Dalbar attributes the chasm between mutual fund and individual performance to the active investor’s destructive behavioral patterns, which include a phenomenon known as herd mentality. These patterns involve waiting for a fund to have a few good years and then pouring in a flood of cash just before the fund reaches its peak. The investor then proceeds to ride the fund to near bottom and sells out. This is precisely opposite to the conventional investment wisdom of buying low and selling high.
Both the Dalbar and Trzcinka studies reached the same conclusion. The Dalbar research indicated that investors under-performed the market by approximately 67 percent. The Trzcinka study, covering a different time period, indicated investors underperformed the funds they were invested in by about 82 percent. According to an Economic Policy Institute briefing paper, it will take the average household over thirty years to recover the wealth lost in 2000 and 2001 from market declines!3 With these miserable statistics, does it make sense for the individual investor to be playing this dangerous game of stock market investing?
14The Journal of Finance published a study in 2001 that was appropriately titled “Massively Confused Investors Making Conspicuously Ignorant Choices.”4 Befuddled investors spend thousands of dollars purchasing stocks by mistake because they confuse company symbols. According to Harvard researcher Michael Rashes, investors often know so little about the stocks they buy and sell that they simply guess at what they think the ticker symbol might be and begin trading. Most would agree that this is not the best investment strategy.
Assuming investors correctly identify the desired stocks, they still must bear enormous market risk. Consider the period March 2000 through May 2002. It was common for technobuffs to lose 40 percent or more of their portfolio value. The family of Janus Funds, a favorite of individual investors, was extremely hard hit. Janus Fund lost 46 percent; Janus Twenty fell 61 percent; and Janus Worldwide dropped 49 percent during this period.
Many investors took a fatalistic approach. The common mind-set became “What can I do? Everyone is losing money in the market. Well, I’m not going to worry. I have ten years to make it back.”
Losing money in any market is neither inevitable nor universal. Moreover, depending upon the timing, the investor may not have the luxury of waiting ten years to “make it back.” Short-term losses can have devastating long-term impacts if money is needed for living expenses and is no longer there. The next ten years are just as subject to declines as the last ten. Attempting to beat the market always means taking on risk and can lead to the gut-wrenching possibility of further loss.
The primary objective of an intelligent investment strategy should be to preserve capital and build on it at a consistent, moderate rate in both bull and bear markets. But don’t15 expect to hear this kind of advice from the professional money managers on Wall Street.
PROFESSIONAL INVESTMENT MANAGERS VS. THE MARKET
Investment performance is a zero-sum game. For every investor who beats the market, another one underperforms it. You would expect that the hardworking, skilled professional investors with substantial resources at their command would gain at the expense of the unskilled individual investor and consistently beat the market averages. But this is not the case.
The Professional Investment Manager vs. a Blindfolded Monkey
In 1985 Dr. Burton G. Malkiel’s epic book, A Random Walk Down Wall Street, rocked the professional investment world. Dr. Malkiel, a professor of economics at Princeton University, concluded it was difficult, if not impossible, for the average active professional money manager to consistently beat an index of stocks, which by definition is unmanaged. His book was not a welcome addition to the library of financial literature—at least not from the perspective of Wall Street. Stockbrokers, investment analysts, portfolio managers, and other financial professionals pride themselves on their abilities to make money by implementing their exceptional understanding of the logic and rationality of the stock markets. It’s what a good part of the investment industry is based upon—the marketing of expert advice.
Dr. Malkiel detonated this myth by exploring the limitations of active financial management. An academician, he used his scholarly tools to demonstrate that individual stock prices move randomly and are totally unpredictable in the short run. He reasoned that investors would be better off buying an unmanaged index of stocks in lieu of using a professional or 16trying to manage the funds themselves. According to Malkiel, “A blindfolded monkey throwing darts” could theoretically pick stocks as well as a financial professional.5
The disappointing performance of actively managed mutual funds by Wall Street professionals is well documented. Charles Ellis reports, in Winning the Losers Game, over 75 percent of professionally managed funds underperformed the S&P 500 index for the twenty-five-year period ending in 1997.6 Max Isaacman, author of How to Be an Index Investor, cites one analysis that showed an astounding 96 percent of professional money managers did worse than the S&P 500 index.7
Another study conducted by Ira Weiss, an accounting professor at Columbia Business School, reviewed U.S. fund performance for thirty-six years through December 1997. He found that diversified funds gained an average of 12 percent less per year than the S&P 500 index.8
Mutual fund organization Morningstar conducted research that indicated for the ten years ending December 31, 1998, the Wilshire 5000 index of most regularly traded U.S. stocks outperformed a collection of selected high-performing funds by an average of 7.2 percent.9
Mutual fund investors who chase after managers who beat the market odds are likely to be disappointed. A top-performing manager one year is not likely to excel in the following year.10 In the absence of consistency, the excellent performance turned in for one period can be attributed to nothing more than sheer luck.
Investment newsletters reinforce the same message, even as they add their own layer of analytical complexity to that of the funds they select. A study by the Hulbert Financial Digest found that between August 1987 and the end of 1998, the average fund newsletter’s model portfolio provided a return of 7.3 percent—only one half of the 14.1 percent return on the 17 Wilshire 5000 index. Only six out of fifty-five advisers did better than the market. All claimed, at least implicitly, to provide market-beating returns with their complex multilayered approaches, but precious few delivered on that promise.11
One reason it is extremely difficult for fund managers to beat the market is the drag on performance created by trading costs and the expenses of running a fund. Another reason is that it is virtually impossible to beat the market over time without taking on additional risk. This is why indexing (matching overall market performance) has grown so rapidly, and now accounts for an estimated 23 percent of institutional equity investing in the United States, even though it offers no protection against loss.12
A HISTORICAL PERSPECTIVE ON THE MARKET
In•vest•ment n. the outlay of money usually for income or profit. Merriam-Webster’s Dictionary
What Happened to the Blue-Chip Stock Era?
To this day my father, 77, still works for the same company, lives in the same house, and has been married for almost fifty years. The son of a coal miner and a survivor of the Depression, Ed Winslow Sr., sticks to insured investments, absolutely refusing to get into stock market gambles. You can tell by his suit, his punctuality, and his unswerving level-headedness that he has a savings account, a life insurance policy, and a retirement plan. He hasn’t changed his philosophy one iota—not even during the roaring bull market of the late 1990s.
Throughout his life, Dad invested one way—U.S. government-backed bonds, FDIC insured CDs, and bank accounts; and, as he got older and more adventurous, U.S. agency-backed mortgages. Of course, before investing in anything, his first priority was paying off the mortgage and being debt free.
18So he’s still at it, now working part-time as an accountant and making conservative investments. The global economy is changing like a kaleidoscope around him—the times have changed—but he sets his steady course, unaffected.
How did we go from the secure, sleepy years of Eisenhower to today’s dazzling casino of options, futures, and stock market gambles? Can we even refer to ourselves as “investors”?
Stocks and mutual funds don’t match Webster’s definition of investment. The description would have to be tweaked to include the disclaimer that your dollar does indeed offer the potential for profit—even great profit—but only at a high risk of loss. If there is a possibility of losing money, we are talking speculation, not investment.
There are no guarantees that stocks will offer profitable returns in the future—even in the long run. It only takes one gigantic loss to collapse a dream. Many ordinary Americans trusted Enron with their retirement dreams. Tragically, they ended up with a nightmare.
When the biotech craze started in the late 1990s, everyone— investors and analysts alike—saw huge potential. Ordinary middle-class Americans, motivated by a fear of being left out and hoping to make some fast bucks, bought into the get-rich-quick promises of this industry. All told, billions of dollars were poured into brand-new companies with no more than a concept and a rough business plan. Most of these companies, giddy with newfound wealth, burned through the investors’ money with outrageous salaries and outlandish benefits, and either went out of business or were picked up for pennies on the dollar by more savvy corporations.
Wall Street and its investors were not focused on current profits but on the potential for future profits. Many small pharmaceutical19 and biotechnology companies had little or no current sales but had a “promising” product in the pipeline that was expected to have a shot at commercial success.
Earnings and profitability might have been years away and for that matter might never occur. Nevertheless, corporations hired public relations firms to put a positive spin on whatever was happening, even when the financial statements indicated there was nothing to crow about. Promised day and night by news, television, the Internet, mail, and cold calls from strangers about the fabulous wealth to be gained in the stock market, who wouldn’t be green with greed?
Well, there is no free lunch. If you are a conservative investor, you must avoid individual stocks and equity mutual funds. It’s of the utmost importance to protect your principal while earning a return on your investment. If your principal is at risk, you are not an investor, you’re a gambler.
How Long Is Long Enough?
It’s interesting to review past market returns as a basis for estimating future returns. For the 101 years ending in 2000, the world stock markets were up an inflation-adjusted 5.2 percent annually with the U.S. figure at 6.7 percent.13 But who lives 101 years? And at what point during that 101 years do you cash out your portfolio to pay for college tuition, retirement shortfalls, prescriptions, or nursing home care?
The money manager’s mantra, especially when the market drops, is “Hold on, don’t panic; the good times are coming back, we’re investing for the long term.” What investor hasn’t heard this? It’s an article of faith that a representative sample of stocks, if held for the long run, can’t fail to pay off. Under the buy-and-hold theory, investors owning stocks always expect to do better relative to other investments, versus—perish the thought—going stockless!
The number one rule in Michael Sivy’s book, Rules of Investing, is that on average “you can’t lose with blue-chip stocks if20 you plan to hold them for twenty years.”14 Jane Bryant Quinn, in Making the Most of Your Money, says: “I like stocks if the holding period is 4 or 5 years. I love stocks for holding periods of 10 years or more.”15 This common advice is spread throughout every form of media. The magazine Women in Business had an article about what to do when bad news strikes your stocks. According to the article, the first rule was not to panic. “You will most likely want to maintain your long-term, buy and hold outlook. In fact you may even want to buy more shares.”16
But are ten or even twenty years long enough? The answer may surprise you.
No one knows what the future holds, but the chart below illustrates how the bear market of 1973–1974 wiped out all of the spectacular gains of the 1960s and took the market back to 1961 levels.
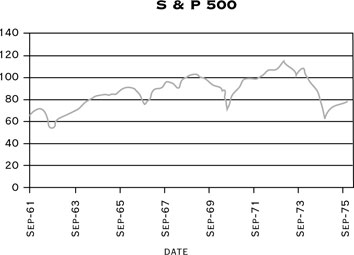
The bear market of 1929–1932 wiped out all of the gains of the previous 33 years. An investment at the top of the market in 1929 had to be held until 1954 before showing a hint of profit. History shows us that the market can be extremely volatile and is definitely not for the faint of heart.
21Using the past performance of the stock market as a basis for predicting future performance is commonly done, even though the world is a much different place than it was just ten years ago. The ups and downs of the market can be expected to become even more dramatic in the future as the pace of change grows faster and faster. When news, good or bad, is instantaneous, so is the investor’s reaction.
Fickle Figures of Fate
There is a statistical anomaly that occurs when year-to-year results are reported for volatile up-and-down stocks and mutual funds in today’s market. This quirk of mathematics makes the gains seem bigger and the losses smaller than they really are. For example, a 50 percent loss requires a 100 percent gain to recover.
Consider a stock or fund that reports being up 20 percent the first year, down 20 percent the second, up 40 percent the third, and down 40 percent in year four. At first glance it appears that the investment will break even at the end of four years, but this is not the case. The end results of these performance figures are quite surprising:
The above calculation shows that an investment of $1,000 would actually end up being down by approximately 19 percent.22 This investor would have experienced a wild roller-coaster ride, with exhilarating ups and breathtaking downs, only to end up below where he or she started four years earlier.
Now consider the actual figures reported by the NASDAQ composite index, which reached a level of 5048.62 on March 10, 2000. This was a whopping 256 percent increase from its closing level of 1419.12 on October 8, 1998, in merely nineteen months. Exciting times indeed! However, the fall from the high of 5048.62 to 1423.19 on September 21, 2001, equals 72 percent, which coincidentally also took approximately one and one half years. The 256 percent gain sounds like it more than offsets the 72 percent loss, but the money in your wallet is just as thin as when you began.
The investor who bought in at the low in 1998 and held for the three years had a quick ride to nowhere. A $100,000 investment would have increased to $356,000 and gone right back down to the $100,000 level, all within a three-year period. The 256 percent increase was wiped out by the decrease of 72 percent. When the professional money manager starts to tout percentage increases by year, beware!
Historically, buying and holding a mutual fund or stock over a long period of time used to be the time-tested thing to do. As every investor today knows, that clearly is no longer true. Such a strategy certainly didn’t help the NASDAQ index investor between 1998 and 2001.
The new investment strategies and products discussed later in this book allow for the capture of all or a portion of a gain in an up cycle while providing principal protection in a down period. This is the only way it makes sense to have an investment that is tied to corporate stock and the market.
Why? What has changed?
23Integrity Losing Out to Illusion
For the last decade, the new bottom line for the corporation has been to increase the stock price in as short a time as possible. It is the measure, the countermeasure, the golden rule, and the ruthless rod by which a corporation will thrive or die. Image, marketability, and great expectations are what drive a stock price higher—not necessarily real production numbers and actual service. The purveyors of that image are the very few, at the very top, who reap obscene monetary benefits by creating a utopian aura of corporate health, growth, prosperity, and vision.
While common investors were basking in the glow of their inflated portfolio, Arthur Levitt, former chairman of the Securities and Exchange Commission, foresaw the dark undercurrents of market manipulation. He noted in a 1998 speech that executives were facing pressure to deliver steady earnings each quarter. “Managing may be giving way to manipulation; integrity may be losing out to illusion,” he warned.17
How is the illusion created?
Dubbed “earnings management,” the practice of tailoring earnings to meet market expectations has become part and parcel of doing business on Wall Street.18 In other words, today’s executive woos us with a kind of financial wizardry. Numbers are coaxed and massaged and manipulated until they present the desired picture. Losses are reported with the connotation: “Let’s put the bad times behind us; a great future lies ahead.” Huge losses can be hidden beneath a complex accounting game.
Aided by the hard-earned dollars of millions of Americans, today’s large corporation has become a wealthy wonderland for some CEOs and their inner circle, who charge admission to their illusory world via purchases of common stock. Most average investors don’t even bother reading the annual reports and their massaged numbers. They are captivated by the magical mantra constantly drumming in their ears—the market always
24goes up in the long run. We are like the three monkeys. We see not. We hear not. We speak not.
“Greed,… for lack of a better word, is good,” says Gordon Gekko, a fictitious corporate executive in the 1987 movie Wall Street. Gekko’s speech caught the spirit of an era that continues barreling along today. In theory, when the self-interest of top executives is aligned with the investors, companies should do well. The profit motive is the driver and is needed at all levels, including individual investors and management, for the system to work. It’s the underlying fuel for our economic system. But when it gets out of control and becomes raw unrestrained greed, a continuing uninterrupted cascade of scandals can result, ranging from insider trading to outright fraud.
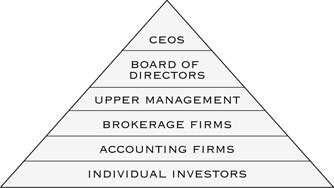
The Crushing Weight of the Pyramid
The pyramid ranks the parties in order of their potential returns from the stock market game. At the top of the pyramid is the party that takes on the least amount of investment risk but receives the highest potential rewards. The average investor on the bottom of the pyramid takes on the greatest amount of risk but receives the lowest return.
25Motivated by greed and potential profit, individuals have bought into the scheme in droves. According to Morningstar, the number of mutual fund accounts leap-frogged from 8 million in 1976, to 46 million in 1986, to 227 million in 1999. Individual brokerage accounts, hopping on for the ride, soared. We have given our unwarranted trust and blind faith to a system that holds our financial future captive solely on the basis of a long-held belief that common stock is the best long-term investment choice we have at our disposal. So we hold our breath and hope for the best.
INFORMATION, TRADING COSTS, AND TURNOVER
Information Overload
We are inundated with millions of pieces of data each day. The advent of the Internet makes it possible to have data and information at our fingertips in a matter of seconds. There is so much to absorb that scientists are studying ways humans can deal with the stress of an overworked brain. Preliminary findings suggest that the burnout sensation that comes with information overload results from fatigue in specific brain regions. Burnout is the signal that says you can’t take in more information in this part of your brain until you’ve had a chance to sleep.19 Metaphorically speaking, as a nation we are suffering from real-time market overload exhaustion.
We didn’t have to worry about information overload a century ago. People were grateful for any kind of information or news they could get. Sometimes it would take days to get news from certain countries. Timely corporate investment news such as earnings reports would be disseminated through brokers. There were no email alerts, online quotes, and real-time trading viewed on CNBC. Naps were an enjoyable pastime, not a neurological necessity.
26Commission-Free Trading
As the speed and quantity of investment information has accelerated, the costs of trading have plunged. Today, an investor can buy or sell any number of shares of stock for as little as ten dollars per transaction or less. These same transactions, done through a full-commission broker, might cost thousands of dollars.
Excessive Portfolio Turnover
The combination of cheap trading costs and availability of superfast information has encouraged many investors to speculate in stocks, enabling a lot of buying and selling that in the old days would have been cost prohibitive. Now the trading cost is negligible compared to the transaction size. The increased turnover resulting from the shorter time period investors hold stock isn’t of any help to the average investor. In fact, studies show that the more investors trade, the less they earn.20
Increased turnover creates higher volatility and risk. The convenience of getting online, and at the push of a button trading a stock, gives the whole investment process the feel of a computer game, which is fine entertainment if the money is simulated. But we’re talking real money. This is money being saved for the new car, the kids’ college education, the daughter’s wedding, and our own retirement.
Today’s investor is at a crossroads. The strategy of buying stock and holding it for a long period of time has worked in the past. Many of us have made and lost money, some of it substantial, in the stock market. Even a quick review of recent history shows a trail littered with wild ups and downs. But the big question is: What does the future hold?
One of the keys to understanding the market, and our place in it, is to look at the psychology that drives it—and us.