
Chapter 9 Data Quality and Information Compliance
When the quality of your data is suspect, how can you trust the results of any analysis based on that flawed data? In the business intelligence/data warehouse user community, there is a growing confusion as to the difference between data cleansing and data quality. Although many data cleansing products can help in applying data edits to name and address data or help in transforming data during an extract/transform/load (ETL) process, there is usually no persistence in this cleansing. Each time a data warehouse is populated or updated, the same corrections are applied to the same data.
In reality, improved data quality is the result of a business improvement process that looks to identify and eliminate the root causes of bad data. A critical component of improving data quality is being able to distinguish between “good” (i.e., valid) data and “bad” (i.e., invalid) data. But because data values appear in many contexts, formats, and frameworks, this simple concept devolves into extremely complicated notions as to what constitutes validity. This is because the validity of a data value must be defined within the context in which that data value appears. For example, there may be many ways in which customers refer to a corporation, but there is only one legal name under which the corporation is officially registered. In most contexts any of the corporate aliases may be sufficient, whereas in other contexts only the legal name is valid.
This chapter centers on the importance of defining data quality expectations and measuring data quality against those expectations. We will also look at the general perception of data quality and what the savvy manager needs to know to distinguish between data cleansing and data quality.
The Business Case
In Chapter 2, where we discussed the value of information, we determined that a critical aspect of information value is dependent on the quality of data. This is not merely a blanket statement—according to the 2001 PricewaterhouseCoopers Global Data Management Survey, fully 75% of the respondents (senior-level executives) had experienced significant problems as a result of defective data.1 These problems included:
• Extra costs to prepare reconciliations
• Delays or scrapping of new systems
• Failure to collect receivables
• Inability to deliver orders
• Lost sales
On the other hand, increased levels of data quality accounted for reduced processing costs, reduced reconciliations, and increased sales. According to the Data Warehousing Institute’s report Data Quality and the Bottom Line, poor-quality customer data costs U.S. businesses $611 billion a year2 (and this is referring just to customer data—consider how much all other kinds of poor quality data can cost).
More Than Just Names and Addresses
What is particularly interesting is that some of these assessments of the commercial costs of poor data quality are based on relatively simple metrics related to incorrect names and addresses. Although I don’t want to minimize the value of correct names and addresses, the realm of invalid data spans much more than the question of whether the catalog is being sent to the right person at the right address. In other words, data quality is more than just names and addresses.
In fact, the question of data quality is not one of standardized addresses, but rather of “fitness for use.” This relatively simple phrase hides an extremely complicated concept. In practicality, almost everyone has a different understanding of what data quality is; each definition is geared toward the individual’s view of what is good and what is not. This leads to the conclusion that there is no hard and fast definition of data quality. Rather, data quality is defined in terms of how each data consumer desires to use the data, and to this end we must discuss some dimensions across which data quality can be measured.
Data Quality Dimensions
Although there are potentially many dimensions of data quality dealing with data models, data domains, and data presentation, the ones that usually attract the most attention are dimensions that deal with data values, namely:
• Accuracy
• Completeness
• Consistency
• Timeliness
Accuracy
Accuracy refers to the degree to which data values agree with an identified source of correct information. There are different sources of correct information: a database of record; a similar, corroborative set of data values from another table; dynamically computed values; the result of a manual workflow; or irate clients. Inaccurate values don’t just cause confusion when examining a database—bad data values can result in increased costs and provide particularly nasty problems when they surface in an analytical environment.
Completeness
Completeness refers to the expectation that data instances contain all the information they are supposed to. Completeness can be prescribed on the basis of a single attribute or can be dependent on the values of other attributes within a record or even be defined with respect to all values within a column. Missing values can wreak havoc on analytical applications, especially when looking at aggregate functions, such as summation, or more complicated analyses.
Consistency
The data quality dimension of consistency can be curiously simple or dangerously complex. In its most basic form, consistency refers to data values in one data set being consistent with values in another data set. Yet what does consistency really mean? If we follow a strict definition, then two data values drawn from separate data sets may be consistent with each other, yet both can be incorrect. Even more complicated is the notion of consistency with a set of predefined constraints. We may declare some data set to be the database of record, although what guarantees that the database of record is of high quality?
More formal consistency constraints can be encapsulated as a set of rules that specify consistency relationships between values of attributes, either across a record or message or along all values of a single attribute. An example for a health-care environment might specify that “if the operation is hysterectomy, the patient may not be male.” These consistency rules can be applied to one or more dimensions of a table or even across tables. This becomes particularly important during the data integration and aggregation stages of importing data into a large repository.
Currency/Timeliness
Currency refers to the degree to which information is current with the world that it models. Currency can measure how up to date information is and whether it is correct despite possible time-related changes. Timeliness refers to the time expectation for accessibility of information. Timeliness can be measured as the time between when information is expected and when it is readily available for usage.
Data Quality Expectations
In the most general sense, we will use a qualitative definition of data quality and refine that definition on a case-by-case basis. In essence, the level of data quality is determined by the data consumers in terms of meeting or beating their own defined expectations. In practice, this means identifying a set of data quality objectives associated with any data set and then measuring that data set’s conformance to those objectives. This is not to say that the tools used for static data cleansing of names and addresses or products that link data records based on specific data fields are not useful, yet the use of these tools does not define a data quality solution. Instead, the best way to get a handle on an organization’s data quality is to define a set of expectations about the data, measure against those expectations, and continuously improve until those expectations are met or beaten.
Unfortunately, there are no objective means for defining data quality expectations. That means that it is up to each organization to measure the cost effect of low data quality, to assess the current state of the organization’s data, and to develop data quality rules that can be used for ongoing improvement. We will explore a business rules approach to continuous data quality in the section on Business Rule–Based Information Compliance. In that approach, we have objective measures that relate directly to percentage conformance with the defined rules.
Types of Errors
A quick review of some common error paradigms is in order to remind you of the degree to which the quality of information can devolve. In this section we look at some common sources of errors.
Attribute Granularity
The granularity of an attribute refers to how much information is embedded within that attribute. A good example is a customer name attribute whose value incorporates first, middle, and last names all in one field. The inclusion of multiple name components within a single field may be relevant in analyses attempting to resolve multiple instances of individuals that appear throughout a collection of data sets, for example.
Finger Flubs and Transcription Errors
Many data errors can creep in right at the introduction into the processing stream. At a data entry or transcription stage, individuals or systems are likely to introduce variations in spellings, abbreviations, phonetic similarities, transcribed letters inside words, misspelled words, miskeyed letters, etc. In one data environment, where many of the company names used an ampersand (&) character as part of the name (e.g., Johnson & Smith), a frequent error was the appearance of a 7 instead of the ampersand (e.g., Johnson 7 Smith). This is an apparent shift-key problem, because the “&” is the “7” key shifted.
Floating Data
Imprecision in metadata modeling may result in lack of clarity as to whether certain kinds of data go into specific fields. One example I reviewed recently contained columns for “address1” and “address2,” referring to the first and second lines of a party’s address. Apparently, there was no standard as to what went into the first line and what went into the second line, because suite/apartment/floor information floated into address1 and street number/name/type floated down into address2 (the typical standard prescribes the opposite).
Another common error is data placed in the wrong field. In a similar example, the street address field was insufficiently sized, so the entry person just continued entering street address data that subsequently floated into the city field.
Implicit and Explicit Nullness
The question of nullness is interesting, because the absence of a value may provide more fodder for making inferences than the presence of an incorrect value. The ability of modern relational database systems to impose “not null” constraints on columns may actually create problems that it attempts to solve. The question becomes: If I do not have a value for a specific column that requires a value, what value should be assigned?
The result of this conundrum, as you have probably encountered, is the appearance of a variety of nonstandard values meant to represent different kinds of null values. One example I encountered in a recent data assessment uncovered the frequent use of “X” in many columns. When I discussed this with the subject matter expert, he immediately told me that those fields are not null, and so the data entry person just input the “X” to make sure the transaction would be accepted. Other examples of explicit nulls are shown in Figure 9.1.
Semistructured Formats
Data records in regular databases are formatted in a structured way; information in free text is said to be unstructured. Somewhere in the middle is what we call semistructured data, which is essentially free text with some conceptual connectivity. Understanding that connectivity allows for intelligently extracting information embedded within the semistructure. A good example might be a death notice, which typically contains specific information about individuals and their particular roles and relationships.
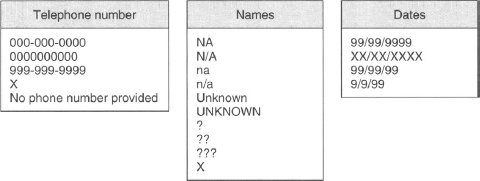
FIGURE 9.1 Different kind of explicit nulls.
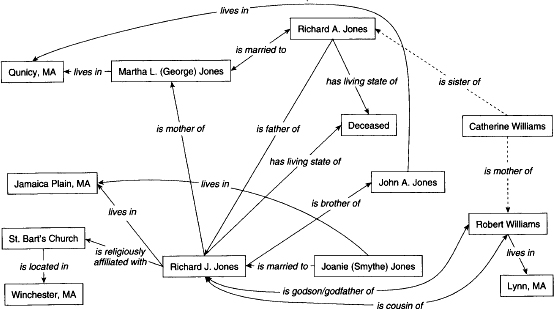
FIGURE 9.2 Analysis of a death notice.
Here is an example, whose relationships are exposed in Figure 9.2:
Richard J. Jones, Of Jamaica Plain, Suddenly, Apr 23. Beloved husband of Joanie (Smythe) Jones. Devoted son of Martha L. (George) Jones of Qunicy, and the late Richard A. Jones. Devoted brother of John A. Jones, nephew of Catherine Williams of Lynn, Cousin of Robert Williams of Lynn. Funeral Mass in St. Bart’s Church, Winchester, at 10 a.m. Relatives and friends invited.3
When the attribute granularity is coarse, what should be a structured piece of data may have morphed into semistructured form. This is particularly visible in data sets containing “comments” fields, where the data provider is able to insert rambling chunks of free text with no hope of automated extraction.
Strict Format Conformance
We naturally tend to view information in patterns, and frequently data modelers will reverse this order and impose a pattern or set of patterns on a set of attributes that may actually prevent those fields from being properly filled in. For example, our expectation that telephone numbers always consist of a three-digit area code, a three-digit exchange number, and a four-digit line number may be generally correct, but it is not correct if we are entering European or Japanese telephone numbers, nor is it necessarily correct if we are viewing U.S. telephone numbers from your office desk in Tokyo. The imposition of strict format compliance may capture correctly formed data a large part of the time and prevent the proper capture the rest of the time!
Transformation Errors
Errors may be introduced during the extraction and transformation process. If the transformation rules are not completely correct or if there is a flaw in the transformation application, errors will be created where none originally existed. For example, in an interesting case, a database of names was found to have an inordinately large number of high-frequency word fragments, such as “INCORP,” “ATIONAL,” “COMPA.” It turned out that the field had been reconstructed from data extracted from a legacy database, which had a limit on the size of an attribute, forcing the data modeler to use more than one actual field to make up one virtual field. During the integration process the merging application inserted a space between each of a set of concatenated fields from the source, and because some of the original data spanned two physical fields, the insertion of the space created a collection of fragments that did not appear in the original data.
Overloaded Attributes
Either as a reflection of poor data modeling or as a result of changing business concerns, there is information that is stored in one data field that actually contains more than one data value. Examples of this are prevalent in the financial industries, where companies are moving from an account-oriented view to a customer-oriented view. Typically, account names are the official names associated with a financial account, and they may include many combination forms with many associated context terms. The context terms represent business relationships that may need to be exposed in a customer or party’s database. Here are some examples.
1. John Smith and Mary Smith
2. John and Mary Smith
3. John Smith in Trust for Charles Smith
4. John and Mary Smith UGMA Charles Smith
5. John and Mary Smith Foundation, John and Mary Smith Trustees
In each of these examples, we actually see more than just entity names—we may see bound relationships (e.g., the appearance of a male and a female name together, implying a marriage relationship) and business-related attributions (e.g., UGMA = Uniform Gift to Minors Act account) embedded within a single field.
Data Cleansing
A large part of the cleansing process involves identification and elimination of duplicate records; much of this process is simple, because exact duplicates are easy to find in a database using simple queries, or in a flat file by sorting and streaming the data based on a specific key. The difficult part of eliminating duplicates is finding those nonexact duplicates—for example, pairs of records where there are subtle differences in the matching key. The processes used for approximate matching are the same as used for other entity linkage and integration applications (householding is a good example); this is treated in greater detail in Chapter 10 in the section on Record Linkage and Consolidation.
Do not undervalue the importance of data cleansing, because it drives a significant portion of the preloading data preparation. The data cleansing process consists of phases that try to understand what is in the data, transform that into a standard form, identify incorrect data, and then attempt to correct it.
Parsing
The first step in data cleansing is parsing, which is the process of identifying meaningful tokens within a data instance and then analyzing token streams for recognizable patterns. A token is a conglomeration of a number of single words that have some business meaning; with customer data, these tokens may refer to components of a person or business name, parts of an address, or a part of some other domain-specific data item. For example, we might refer to a “title” token that represents a list of frequently used titles, such as “Mr.,” “Mrs.,” and “Dr.,” and any time we see a word that is in our “titles” list, we can refer to that word as a title for subsequent pattern analysis.
The parsing process segregates each word and then attempts to determine the relationship between the word and previously defined token sets and to form sequences of tokens. Token sequences are submitted to a pattern-matching application that searches for similar patterns. When a pattern is matched, a predefined transformation is applied to the original field value to extract its individual components, which are then reported to the driver applications. Pattern-based tools are flexible, in that they can make use of predefined patterns and absorb newly defined or discovered patterns for ongoing parsing.
Standardization
Standardization is the process of transforming data into a form specified as a standard. That standard may be one defined by some governing body or may just refer to the segregation of subcomponents within a data field that has been successfully parsed. Standardization is a prelude to the record consolidation process and is used as a means of extracting specific entity information (e.g., person, company, telephone number, location) and assigning it semantic value for subsequent manipulation.
Standardization will incorporate information-reduction transformations during a consolidation or summarization application. For example, consider these two customer records:
1. Elizabeth R. Johnson, 123 Main Street
2. Beth R. Johnson, 123 Main Street
Our intuition upon eyeballing this pair of records allows us to infer an entity match, because there seems to be enough heuristic data to take that leap: We know that “Beth” is a short version of “Elizabeth,” and the street address is a match. Heuristics such as matching a nickname to a full-version name (and others like these) can be collected as business rules (see Chapter 7) as simple transformations that can be generally applied to parsed names.
There are many different data types that fall into a semantic taxonomy that provides some intuitive set of content-related standardization rules. For example, first names in many cultures have variant forms, nicknames, etc., that all can relate any name to at least one standard form. For instance, “Bob,” “Rob,” “Bobby,” and “Robbie” are all different forms of the name “Robert”; “Liz,” “Lizzie,” and “Beth” may all be forms of the name “Elizabeth.”
Once a name is identified that has a number of variants, the standardization process may augment a data value with a chosen standard form to be used during the linkage stage. Note that standardization is not restricted to names or addresses. Other abstract data types that can be standardized include business words, telephone numbers, industry jargon, product codes, and transaction codes. And it doesn’t even matter if the standard form is applied in a manner that is not consistent with real life. For example, “Beth Smith” might not be named “Elizabeth,” but we can assign the standard “Elizabeth” to the records anyway, because this standardization is being used purely as a means to a different end: linkage and cleansing.
Abbreviation Expansion
An abbreviation is a compact representation of some alternate recognized entity, and finding and standardizing abbreviations is another rule-oriented aspect of data cleansing. There are different kinds of abbreviation. One type shortens each of a set of words to a smaller form, where the abbreviation consists of a prefix of the original data value. Examples include “INC” for incorporated, “CORP” for corporation, and “ST” for street. Another type shortens the word by eliminating vowels or by contracting the letters to phonetics, such as “INTL” or “INTRNTL” for international, “PRGRM” for program, and “MGR” for manager. A third form of abbreviation is the acronym, where the first characters of each of a set of words are composed into a string, such as “USA” for “United States of America” and RFP for “request for proposal.” Abbreviations must be parsed and recognized, and then a set of transformational business rules can be used to change abbreviations into their expanded form.
Correction
Once components of a string have been identified and standardized, the next stage of the process attempts to correct those data values that are not recognized and to augment correctable records with the corrected information. Obviously, if we can recognize that data is in error, we want to be able to fix that data. There are a few different ways to automatically correct data, and these all rely on some sort of intelligent knowledge base of rules and transformations or some heuristic algorithms for recognizing and linking variations of known data values. It is important to realize that the correction process can only be partially automated; many vendors may give the impression that their tools can completely correct invalid data, but there is no silver bullet.
In general, the correction process is based on maintaining a set of incorrect values and their corrected forms. As an example, if the word International is frequently misspelled as “Intrnational,” there would be a rule mapping the incorrect form to the correct form. Some tools may incorporate business knowledge accumulated over a long period of time, which accounts for large knowledge bases of rules incorporated into these products; unfortunately, this opens the door for loads of obscure rules that reflect many special cases.
This approach is flawed, because the effect of accumulating correction rules based on analyzing certain kinds of data (usually names and addresses) will bias the corrective process to that kind of information. In addition, a large part of one organization’s data is different than any other organization’s data, and consequently the business rules that govern the use of that data are also different. Relying on the business rules from other organizations will still add value, especially if the data content is similar, but there will always be some area where humans will need to interact with the system to make decisions about data corrections.
Last, data can be perceived as incorrect only when there are rules indicating correctness. Inaccuracy or imprecise data values may exist within a set, yet there is no way to determine that invalidity without a source of correct values against which to compare. Relying on other sets of correctness rules can lead to a bad problem: What might already be good data may inadvertently be changed to something incorrect. An example of this in address correction is the famous East-West Highway in suburban Washington, D.C. Because the expectation with addresses with the word “East” at the beginning is that the word is being used as a direction prefix and not as part of the street name itself, some applications inappropriately “correct” this to “E. West Highway,” which is not the name of the road.
An even worse problem is the perception that the data is correct although it really is not. Sometimes, the only way to identify incorrect data is for an analyst to review the data directly.
Updating Missing Fields
One aspect of data cleansing is being able to fill fields that are missing information. Missing values may carry more information than one might suspect; the absence of a value may be due to one of the following reasons.
1. It is known that there is really no value for this field.
2. It is known that there is a value that should go into a field, but for some reason the value is unknown at this point, and it is not clear if the value will ever be known.
3. It is known that there is a value for this field, and at some point in the future that value will be obtained and filled in.
4. There is no applicable value for this based on some constraint dependent on other attribute values.
5. There is a value for this field, but it does not conform to a predefined set of acceptable values for that field.
This is just a short list of the kinds of null values that exist; I have heard some say there are at least 30 different kinds of nulls! Depending on the null type, there may be ways to impute the missing value, although some approaches are more reliable than others. For example, we might try to fill in a person’s sex field based on his or her first name, but this will not necessarily work with a person with a transgender name.
In some other cases, the reason for the missing value may be due to errors in the original data, and after a cleansing process, we may have enough information to properly fill out the missing field. For unavailable fields, if the reason for the omissions has to do with the dearth of data at the time of record instantiation, then the consolidation process may provide enough information leverage to make available data that had been previously unavailable. For unclassified fields, the reason for the inability to classify the value may be that erroneous data in other attributes has prevented the classification. Given the corrected data, the proper value may be filled in. For unknown attributes, the process of cleansing and consolidation may provide the missing value.
It is important to understand, though, that without a well-documented and agreed-to set of rules to determine how to fill in a missing field, it can be (at the least) counterproductive and (at the worst) dangerous to fill in missing values. Maintain strict caution when automating the replacement of absent values.
Business Rule–Based Information Compliance
As described in Chapter 7, a business rules system is designed to capture the knowledge of all the assertions, constraints, guidelines, policies, regulations, etc., that drive a business. In a business rules system, knowledge about a business process is abstracted and separated from its explicit implementation. Rules expressed in a predefined formalism can be integrated with a rules engine to create an application to implement the business process.
Information compliance is a concept that incorporates the definition of business rules for measuring the level of conformance of sets of data with client expectations. Properly articulating data consumer expectations as business rules lays the groundwork for both assessment and ongoing monitoring of levels of data quality.
A Data Quality Rule Framework
Our framework for articulating quality expectations looks at how that data is used and how we can express rules from this holistic approach. This can be decomposed into the definition of metadata-like reference data sets and assertions that relate to values, records, columns, and tables within a collection of data sets.
There are many explicit and implicit rules embedded in the use of reference data, and we capture a lot of these rules through a formal definition of nulls, domains, and mappings. Once we identify known collections of data and assign meaning to them, we begin to get a better understanding of what information is being used in the organization, who is using it, and how that information is being used. Although the values that make up the domains and the mappings may have actually been derived from transactional data, once we categorize the data sets as domains and the relations as mappings, and especially once we ascribe some meaning to the collections, we can move those sets into the reference data arena.
Assertions revolve around specifying some business constraint on the relationship between the abstract data instance and the values bound to individual data attributes. Defining these assertions captures the contextual knowledge that governs true data quality by imposing a semantic metadata layer on top of the data format description.
Domains
By assigning an attribute a data type, we indicate that it draws its values from a specific set of allowed values. Further, we expect that any value is taken from a value set that has some structural (i.e., syntactic) rules and explicit semantic rules governing validity. Either way, these expectations restrict the values that an attribute takes. Whether these rules are syntactic or semantic, we can define an explicit set of restrictions on a set of values within a type and call that a domain. Some examples of domains include U.S. states, country currency codes, credit card numbers (they have a predetermined length and there are semantic rules governing validity based on a high-level parity calculation), and colors.
Mappings
We also look at relationships between pairs of values that are taken from different domains. A mapping is a relation between domain A and domain B, defined as a set of pairs of values {a, b} such that a is a member of domain A and b is a member of domain B. There is an intuitive meaning to this mapping relationship. A familiar example of a mapping is the relationship between ZIP code and city. Every ZIP code belongs to a named area covered by a small post office or postal zone.
Null Conformance
There are different data quality rules regarding nulls. One is whether or not an attribute allows nulls at all. Another kind of rule relates previously defined null representations. If nulls are allowed, the rule specifies that if a data attribute’s value is null, then it must use one of a set of defined null representations.
Value Restrictions
A value restriction describes some business knowledge about a range of values, such as “test score is greater than 200 and less than 800.” A value restriction rule constrains values to be within the defined range.
Domain and Mapping Membership
Domain membership asserts that an attribute’s value is always taken from a previously defined data domain. For example, an online catalog vendor may specify a domain of fabric colors and then assert that all sweaters that can be ordered online must be of one of the named colors. A mapping membership rule asserts that the relation between two attributes or fields is restricted based on a named mapping. An example enforces the mapping from U.S. state name to its corresponding two-letter postal abbreviation.
Completeness and Exemption
A completeness rule specifies that when a condition is true, a record is incomplete unless all attributes on a provided list are not null. An example in the financial world would specify that if the security being traded is a stock option, the trade is incomplete unless a strike price and expiration date are provided. An exemption rule says that if a condition is true, then those attributes in a named list should not have values. For example, if the customer’s age is less than 16, then the driver’s license field should be null.
Consistency
Consistency refers to maintaining a relationship between two (or more) attributes based on the content of the attributes. A consistency rule indicates that if a particular condition holds true, then a following consequent must also be true. An example in a credit analysis application might say that the amount allowed for a monthly mortgage payment must be no more than 35% of the monthly gross income.
Continuous Data Quality Monitoring and Improvement
We iteratively improve data quality by identifying sources of poor data quality, asserting a set of rules about our expectations for the data, and implementing a measurement application using those rules. In operation, a set of rules is instantiated at each point in the information flow where data quality conformance is to be measured. Each data instance is tested against all associated rules; if no nonconformities are detected, the data instance is deemed to be valid; otherwise, it is said to be invalid. Data instances that fail the rules give us clues as to the sources of the nonconformance, which are then isolated and remedied.
Given a set of rules that define fitness for use and a mechanism for determining conformance of data instances to those rules, we have a measurement framework for data quality. Each data instance tested against a rule set can be scored across multiple dimensions. As we define more rules, we build a rule base that defines the basic expectations of data fitness against which each data instance (record, message, etc.) is measured, thereby providing an ongoing process for improved data quality.
Management Issues
Data quality is probably the most critical aspect of the business intelligence (BI) process, and it is a problem that needs to be addressed. Yet the scope of the data quality problem is so large that people frequently do not even know where to begin. But be assured that some investment must be made (preferably at the start of the project) in ensuring high levels of data quality.
Pay Now or Pay (More) Later
The most critical management issue associated with data quality is the lack of true understanding of its importance. No BI program can be successful if the data that feeds that program is faulty. And we have already discussed the claim that 70% or more of the effort associated with implementing a data warehouse project is spent in data integration and addressing data quality problems as the implementation nears completion. Not only that, some projects are completely killed because the data is so bad that the users refuse to allow the system into production.
This would lead the savvy manager to believe that the organization is going to have to pay for data quality eventually, and the cost-efficient way to do this would be to build data quality into the program from the start instead of a panicked attempt at reconciliation moments before the entire project is debudgeted. Spend the time and money on properly capturing and validating data before it enters the BI environment instead of trying to fix it later or during the ETL process.
Personalization of Quality
The distribution of data processing over the past 20 to 30 years has also led to the distribution of the data itself, with the corresponding turf grabs and data fiefdoms. Because team members may psychologically equate their individuality within the organization with their job performance, there is a natural tendency to hide potential problems instead of exposing themselves to job risk, and the management of data is not excluded from this. I refer to this as the “personalization of data quality,” where the exposition of data quality problems is viewed by the employee as a personal attack, to be avoided at all costs.
Proper identification of data management roles and responsibilities and performance incentives created for ensuring high-quality data can be coupled with the business rule approach to remove the stigma of “poor quality” from the person entrusted with data management. This depersonalization will lead to smoother transition to an integrated knowledge environment.
Data Ownership and Responsibilities
A similar issue to personalization of quality lies in the organizational delineation of data ownership. The “owner” of data can be defined in many ways, including creator, funder, consumer, business partner, and aggregator, but when the topic of data quality is introduced, it is crucial to determine in whose bailiwick the responsibility for data quality lies. One interesting way to define a data owner is as “the person who can determine just how clean the data needs to be and how to prioritize the cleansing effort.” A formal structure for data ownership and a responsibility chain should be defined before the data integration component of implementation.
Correction versus Augmentation
Another important distinction is between the repetitive application of the same corrections to the same data each time that data set is extracted from its source and brought into the BI environment, and a true data quality improvement process. Correcting bad data is treating the symptom, whereas data quality improvement cures the problem. For this reason we typically don’t recommend automatically correcting data immediately; rather, we suggest augmenting invalid records with encoded information about its invalidity and then letting the data consumer determine how to address that issue.
To Learn More
The summary here is pure and simple: Bad data costs money. A BI program that is missing an integrated data quality validation and improvement discipline will at best provide decreased value to the consumer and at worst fail miserably. Integrating ongoing information compliance measurements and improvement processes will lead to a high-value information asset.
To learn more about data quality, see Enterprise Knowledge Management: The Data Quality Approach, David Loshin, San Francisco, Morgan Kaufmann, 2001. Another good book is Improving Data Warehouse and Business Information Quality, Larry English, New York, John Wiley & Sons, 1999.
1. Retrieved May 5, 2003 from www.pwcglobal.com/extweb/ncsurvres.nsf/DoclD/E68F3408A463BD2980256A180064B96A
2. “Data Quality and the Bottom Line,” Wayne Eckerson, Chatsworth, CA, The Data Warehousing Institute, 2002.
3. This obituary is adapted, and takes its form, from those that are regularly published in large-city newspapers.