
Antitrust and Harm to Competition
Because we conclude that Apple violated Article 1 of the Sherman Act by orchestrating a horizontal conspiracy among the Publisher Defendants to raise ebook prices, and that the injunctive relief ordered by the district court is appropriately designed to guard against future anticompetitive conduct, the judgment of the district court is AFFIRMED.
—U.S. Court of Appeals, Second Circuit, in its decision on the case U.S. v. Apple, Inc.1
Learning Objectives
- 1.Describe benefits to society of competitive markets.
- 2.Interpret collusion among firms as anticompetitive harm.
- 3.State conditions under which competition foreclosure is harmful.
- 4.Describe profit-seeking in single-market and multimarket contexts.
- 5.Measure economic damages associated with anticompetitive conduct.
When a business causes harm to society generally, the government often lowers the boom via fines, injunctions, and forced payment of economic damages. We mentioned oil spills earlier, but another important general context is antitrust law, with the government going after big companies like Apple for being monopolistic—taking too much control of an industry—to the detriment of the customer. The subject of antitrust business liability is fascinating and has attracted much attention from both legal and economics scholars.2
When is a business too big, in a given industry? If it is too big, what is the economic loss to society? To answer the first question, one must step beyond the confines of earlier chapters in this book—which are mostly walled by the assumption of open and competitive markets, with many buyers and sellers. To answer the second question, a key fact is that big businesses typically try to maximize profit in some form, and in so doing raise prices and lower quantities supplied, relative to what they might be in a perfectly competitive market. But how much are prices jacked up, and how much are quantities cut back, in a situation of monopoly or cartel or oligopoly? Those remaining questions require some economic model of customer demand and production possibilities. At the least, an economist who estimates economic damages caused by antitrust or monopolistic activity must understand in substantive terms how the company and industry in question work. Systematic coverage of these issues would fill a book different than this one, particularly if multiperiod or dynamic losses are considered.3
This chapter focuses on a central theme in antitrust economics—ill-gotten profit. Businesses that aspire or conspire to boost profit by quashing competition can run afoul of both criminal and civil law and be liable for economic damages. Firms that “foreclose” competition by barring other firms from a market and firms that collude to raise prices charged to customers can cause a loss of economic efficiency in pursuit of profit. Penalties in such cases can be costly to offending firms, often far exceeding the funds needed to compensate customers for their losses.
There is no end to the ways that firms can seek to limit the depressing effect of competition on their profits, and a discussion price-fixing and barriers to entry illustrates economic principles useful in understanding other sorts of potentially anticompetitive conduct such as bundling, retail price maintenance, and mergers between firms.4
Benefits of a Competitive Marketplace
Competition can be cut-throat, causing many businesses to perish each year. For example, cheap online prices for consumer goods have left many brick-and-mortar retail stores struggling to compete, leading to the closure of some shopping malls and major retailers like Borders Books. On a smaller scale, jostling by local restaurants for a limited set of customers often leads restaurants to close.
Some business owners lose fortunes and career dreams to competition and their loyal customers lose a preferred set of goods and services. Competition causes some losses, but these are often paired with gains elsewhere. For example, a failed restaurant owner may find a job at another restaurant, with less pay that may nevertheless match their skills or “human capital” in the restaurant business. The loss of an ice cream shop—adored by some older patrons, may be caused by the opening of a frozen yogurt shop—popular among younger patrons.5
For most goods and services, a competitive marketplace provides benefits to society as a whole, allowing consumers to enjoy lower prices and greater spending power than would be possible if businesses were to collude and set price to some monopolistic profit-maximizing level. Competition also benefits firms that may otherwise be blocked from entering an industry dominated by a few businesses. Governments and courts in the United States, the United Kingdom, Europe, and elsewhere have developed laws that protect competition. Such laws provide criminal penalties for blatant collusion by would-be competitors, as well as civil remedies—including payment of economic damages—for more subtle forms of anticompetitive conduct by firms. In the United States, these laws include the Sherman Antitrust Act of 1890 and the Clayton Antitrust Act of 1914.6
Most adults and many kids know what a market is, by practical experience. In the world of antitrust law and economics, the definition of a “market” can be key to arguments about who did what to whom. For the purposes of this chapter, a market is an institution that facilitates the distribution of goods7 to society, via buyers’ payment of money for sellers’ goods, at a known price. A competitive marketplace is one in which there are many buyers and sellers, with no one buyer or seller able to significantly influence price. In such a market, each buyer and seller is a price-taker—choosing an amount to buy or sell at the given market price. Earlier, Chapters 2 through 4 discussed markets for consumer goods, labor, and financial instruments like government bonds. Implicitly, those discussions assumed that market participants are price-takers, and that market price is at its competitive market equilibrium level—such that there is neither a shortage nor a surplus of goods or services in the marketplace. Chapter 2 also presented some basic market principles, the 7th of which is: “Markets are a socially desirable way to allocate society’s resources and distribute its goods, most of the time,” a result also known as the First Fundamental Welfare Theorem of economic theory. To better understand the virtues of competition and the woes of anticompetitive conduct, it’s useful to model the benefits of a market in competitive equilibrium.
Equilibrium is a natural outcome of perfectly competitive markets, whereas disequilibrium—with a surplus or shortage—is a jarring outcome that tends to vanish over time due to the actions of market participants faced by surplus or shortage. Competitive equilibrium, the situation of equilibrium in a competitive marketplace, is an outcome that need not hold all the time in any market, but which resembles competitive market outcomes most of the time. Antitrust and anticompetition laws, discussed later, are one reason that competitive equilibrium is so commonplace: Coordination by firms that might undermine competition comes with the risk of criminal penalties, embarrassing court injunctions, and payment of economic damages.
To model competitive equilibrium, suppose there is a single good (or service), with every unit of the good identical to every other unit, and with every unit sold at the same price. Let P be the price at which the good sells, and suppose that each buyer pays P for each unit of good bought. The price P is an equilibrium price if, at that price, the total amount of good that sellers want to sell equals the total amount of good that buyers want to buy. With many buyers and sellers, no one buyer or seller is able to change the prevailing market price P, and instead each buyer and seller is a price-taker.
Demand, in the competitive market model, is represented by the quantity QD(P) demanded of the good at each possible price P. On the other “side” of the market is supply, with QS (P) the quantity supplied of the good at each possible price P. Commonly, the quantity demanded of a good falls as price goes up, making QD(P) a downward-sloping function of P. This is a price–quantity relationship called the law of demand. Also common is that the quantity supplied of a good rises as price goes up, making QS (P) a downward-sloping function of P, a relationship called the law of supply.
Example 6.1 Pulp Fiction Market
To illustrate the principles of supply and demand, suppose that “pulp fiction” Trade Paperback fiction books sell in a marketplace, with each new book sold at the same price, with no sales tax or shipping fees. At prices ranging from $14 through $19, Table 6.1 shows quantities demanded and supplied, each expressed in the units: thousands of books.8
Table 6.1 Demand and supply, pulp fiction
Price |
Quantity demanded |
Quantity supplied |
14 |
400 |
200 |
15 |
350 |
250 |
16 |
300 |
300 |
17 |
250 |
350 |
18 |
200 |
400 |
19 |
150 |
450 |
At price P = $14, the quantity demanded is QD(14) = 400 thousand books, and the quantity supplied is QS(14) = 200 thousand books. As price rises beyond $14, quantity demanded falls and quantity supplied rises, as shown in Table 6.1 via changing values in successive rows of the table.
The laws of demand and supply, in a competitive market, ensure that an equilibrium price exists and is unique, so long as some additional conditions are satisfied. In particular, suppose that the demand and supply quantities QD(P) and QS(P) are each continuous functions of P, for each positive price. Suppose also that the quantity demanded exceeds the quantity supplied for all sufficiently low prices and that the quantity supplied exceeds quantity demanded for all sufficiently high prices. In other words, each of the following conditions hold:
- I.QD(P) > QS(P) for all P sufficiently small,
- II.QD(P) < QS(P) for all P sufficiently large.
Condition (i) is reasonable since at very low prices sellers get little if any profit, while buyers get a great bargain. Condition (ii) is reasonable since at very high prices sellers get a big profit while buyers struggle to afford any amount of the good. At some special price P that is neither very high nor very low, quantities supplied and demanded equal each other
QD(P) = QS(P) (6.1)
This special price is unique due to the laws of demand and supply and is the market equilibrium price.
Figure 6.1 illustrates the competitive equilibrium market outcome (6.1) as the crossing point of the demand and supply quantity lines or curves, with each curve relating price P to quantity Q. At the crossing point of the two curves, price is Pc and quantity is Qc, the competitive equilibrium price and quantity in the marketplace.
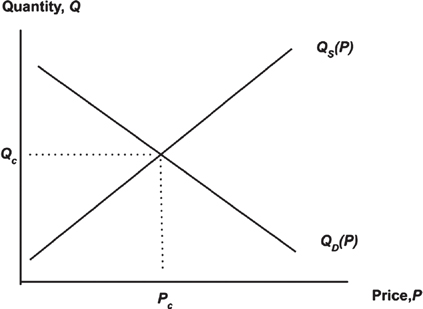
Figure 6.1 Competitive markets, quantity on price
Figure 6.2 illustrates the same market outcome shown in Figure 6.1, but with the axes on the graphs reversed, so that price appears on the vertical axis and quantity appears on the horizontal axis. In this figure, the curve labelled D is the demand curve and the curve labelled S is the supply curve.9
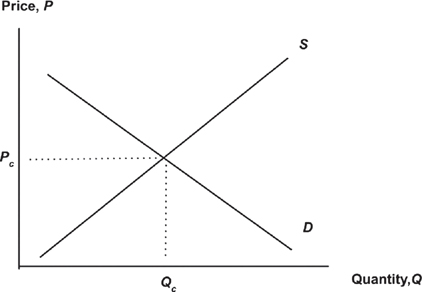
Figure 6.2 Competitive markets, price on quantity
In Figure 6.2, market equilibrium is the crossing point of the downward-sloping demand curve and the upward-sloping supply curve. In equilibrium the market “clears”—meaning that there is no excess or shortage of goods in the marketplace—due to the balancing of demand and supply via equation (6.1). Figure 6.2 shows this balancing as a crossing point and Table 6.1 shows the same sort of balancing as a special row in which quantities demanded and supplied are equal: This is the row where price equals $16 and quantities each equal 300 thousand.
Competition provides a balancing point or equilibrium for market activity and also provides opportunities for buyers to get a good value and sellers to get a good profit. The benefit to buyers, from buying in a competitive market at the equilibrium price, can be measured by the sum of the net benefit to buyers of each unit bought, with net benefit being the difference between a buyer’s willingness to pay and the price actually paid. If, say, the 10th unit of a good is bought by someone willing to pay as much as $5 for the good, but only paid a price of $3, then the net benefit of the 10th unit is $5 − $3 = $2. Tallying these net benefits across each unit sold10, Figure 6.3 shows the total net benefit as the triangle-shaped area under the demand curve and above the equilibrium price line. This total net benefit to buyers is also called consumer surplus.
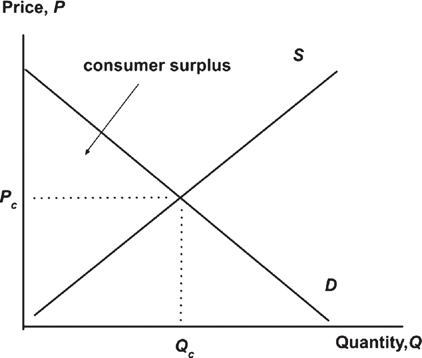
Figure 6.3 Consumer surplus
Consumer surplus measures the benefit to buyers from purchasing goods at the equilibrium price. A different measure, called producer surplus, measures the benefit to sellers from selling goods at the equilibrium price. Producer surplus equals the combined profit of firms selling the good, with profit defined as a firm’s revenue minus its variable cost.11 Figure 6.4 shows producer surplus as the area above the supply curve and below the equilibrium price line.12
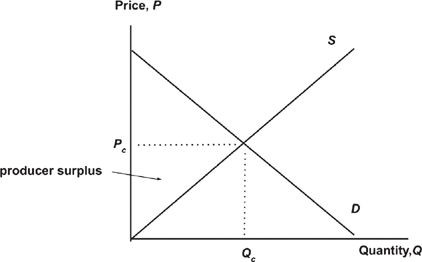
Figure 6.4 Producer surplus
The combined benefit of market equilibrium, to buyers and sellers, is total surplus and is the sum of consumer surplus and producer surplus. It is useful to define total surplus at equilibrium price and, for comparison purposes, at other prices too. To this end, for a price P that is higher than Pc, note that in the market model there is an excess of goods for sale in the market: QD(P) < QS(P), and the quantity actually traded must be QD(P)—the smaller of quantities demanded and supplied. Here, consumer surplus (CS) is the area under the demand curve and above the price line and producer surplus (PS) is the area above the supply curve and below the price line, as shown in Figure 6.5.
With price P above equilibrium price, total surplus is lower than when price is at equilibrium, by an amount called the welfare loss—as shown in Figure 6.5 as a triangle-shaped area near the crossing of demand and supply curves.
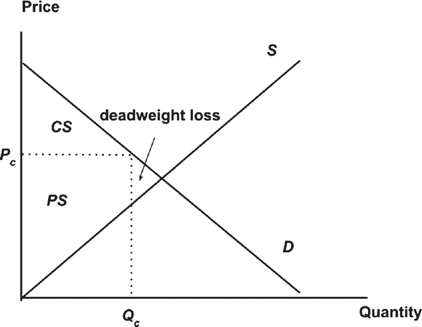
Figure 6.5 Deadweight loss
Competitive equilibrium is socially beneficial in the sense that it provides society a total surplus that is greater than would be available if price were to exceed the competitive equilibrium price.13 This social benefit, or market efficiency, relies on the existence of many buyers and sellers in the marketplace, each a price taker. If instead some seller can influence the market price, they may drive price away from equilibrium, in pursuit of profit. The result would be a loss of market efficiency. This efficiency loss is central to economic arguments against price-setting efforts by firms.
Collusion
Sometimes sellers of some good or service collude to boost profit, but only at their legal peril. By comparison, firms in a perfectly competitive market are playing by the rules of economic efficiency and are therefore unlikely targets of antitrust enforcement. Collusion could mean a sneaky agreement written up in a back room somewhere, but might also be a more innocent-sounding professional interaction.
A professional association of dentists provides an online e-mail discussion group for its members. Over time, dentists begin discussing online the kinds of medical insurance they accept and the prices they charge to insurers and patients. They come to an agreement about what “best practices” are in terms of insurance acceptance and prices charged.
In Example 6.2, dentists seem to be doing a good thing: Who doesn’t want their dentist to follow “best practices”? But if profit-seeking dentists discuss pricing as well as root canals, that may lead to a collective understanding or agreement that’s bad for customers and their insurers. If the dentists agree on a fixed set of prices that each dentist will charge, in the pursuit of profit, that’s collusion. There’s nothing wrong with dentists wanting to make a buck—they should be compensated for their hard work, high expenses, and having to look at peoples’ teeth all day—but it’s wrong to sap competition of its power to limit profits.
The quick buck to be had by collusive price-fixing is a source of economic inefficiency. The Sherman Act, enacted in year 1890, is a part of U.S. antitrust law that provides criminal penalties and tripled damage awards for price-fixing offenses. The severity of the Sherman Act’s correctives for collusion may reflect the serious economic inefficiency that collusion entails, as well as the ease with which it may otherwise be carried out.
The risk of collusion among sellers is greater when there is a small number of sellers, a situation called oligopoly. Oligopolists may have some control over the price at which they sell goods, unlike price-taking firms in perfect competition. An ability to set prices is not anticompetitive per se, and oligopolists can in fact compete with each other—to a degree—by setting their individual prices so as to get as much business and profit as possible. Price setting by competing oligopolists may not be as economically efficient as price taking by a large number of sellers but may be as efficient as possible in a market where it’s infeasible to have many sellers. A key aspect of price competition by oligopolists is that it is non-cooperative conduct, meaning that the firms are not cooperating or colluding and are instead competing for a limited set of customers and sales.
Competition among oligopolists can result in a pattern where all firms charge the same price. The fact that price is the same for each firm does not mean that the firms are colluding or cooperating to “fix” prices.
Example 6.3 Gas Station Twins
Suppose a small town has two gas stations, duopolists14 named Station 1 and Station 2, each selling the same regular unleaded gas. Each gallon of gas provided by a station costs the station $2, and each station must charge the same price for gas, else the community will buy only from the cheaper station. The community demands a quantity QD(P) of gas. Demand is lower at higher prices and quantity demanded at price P is
with quantity QD(P) measured in thousand gallons of gas weekly. Each station charges $2 per gallon of gas, earning zero profit—just barely surviving—and at this price quantity demanded is ![]() thousand gallons per week. The market reaches non-cooperative duopoly equilibrium at price P = 2 and quantity Q = 10.4.
thousand gallons per week. The market reaches non-cooperative duopoly equilibrium at price P = 2 and quantity Q = 10.4.
In Example 6.3, the fact that two sellers provide identical goods means that they have to sell at the same price else consumers will only buy from the cheapest, and each seller has an incentive to undercut the other’s price, so price gets driven down to the minimal level at which profits are zero. Cut-throat competition is at play here, and the fact that each seller charges the same price is not evidence of collusion or cooperation among firms. Instead, the market reaches non-cooperative equilibrium.
Cooperation, among firms, can be good or bad for customers. If cooperation causes firms to be more productive, the result is better for customers than if each firm does its own thing. In Example 6.2, cooperation among dentists can include sharing of professional dentist knowledge and experience, and this can improve the quality dental services.
If “cooperation” means that would-be competitors collude to jack up prices, it’s probably bad for customers, causing a loss of consumer surplus. In Example 6.4, the gas station owners might collude and raise price above $2, make a profit, and split it. With profit defined as a difference between revenue and monopolist’s cost, if profit is a hump-shaped function of quantity, increasing and convex for lower quantities and decreasing and convex for higher quantities, then profit is greatest at some quantity Q* where the slope of the profit function is zero, as illustrated in Figure 6.6.
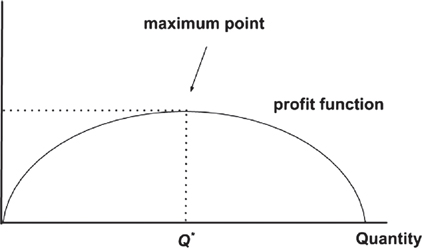
Figure 6.6 Profit maximization
At maximum profit, the additional (or marginal) profit from the last unit produced is approximately zero, owing the zero slope of the profit function at the maximum point. With profit defined as revenue minus cost, at maximum profit the additional (or marginal) revenue from the last unit produced is about equal to the additional (or marginal) cost of that unit. For the gas stations in Example 6.3, their combined revenue is price times quantity and their combined cost is marginal cost times quantity, with P related to Q via the demand curve and with a marginal cost of $2 per gallon. Revenues, cost, and profit, expressed in thousands of dollars, are then
revenue = 50Q - 50Q2 (6.3)
cost = 2Q (6.4)
profit = 48Q - 5Q2 (6.5)
Table 6.2 shows revenue, cost, and profit, as well as marginal revenue, marginal cost, and marginal profit, each expressed in thousands of dollars, for various quantities (expressed in 1,000s).
Table 6.2 Profit of colluding gas stations
Quantity |
Price |
Revenue |
Cost |
Profit |
Marginal revenue |
Marginal cost |
Marginal profit |
1 |
45 |
45 |
2 |
43 |
45 |
2 |
43 |
2 |
40 |
80 |
4 |
76 |
35 |
2 |
33 |
3 |
35 |
105 |
6 |
99 |
25 |
2 |
23 |
4 |
30 |
120 |
8 |
112 |
15 |
2 |
13 |
5 |
25 |
125 |
10 |
115 |
5 |
2 |
3 |
6 |
20 |
120 |
12 |
108 |
–5 |
2 |
−7 |
As shown in Table 6.2, profit is greatest when quantity Q = 5, and at that value marginal profit—the increase in profit when going from 5 to 6 units—is $3,000, this being the difference between marginal revenue and marginal cost.
The relationship between profit maximization and marginal analysis becomes more exact if the search across quantities Q includes all positive numbers—including fractions. To that end, let MR(Q) be the marginal revenue curve, which is the Newton–Leibniz calculus derivative—the slope of the tangent line—of the revenue curve, and let MC(Q) be the derivative of the marginal cost curve. In Example 6.3, the revenue curve is (6.3), the cost curve is (6.4), and their derivatives are
MR(Q) = 50 – 10Q, (6.6)
MR(Q) = 2. (6.7)
With quantity demanded being the “inverse demand” curve (6.2), the demand curve itself is D(Q) = 50 - 5Q, and the marginal revenue curve MR(Q) looks like the quantity demanded curve but twice as steep, as illustrated in Figure 6.7.
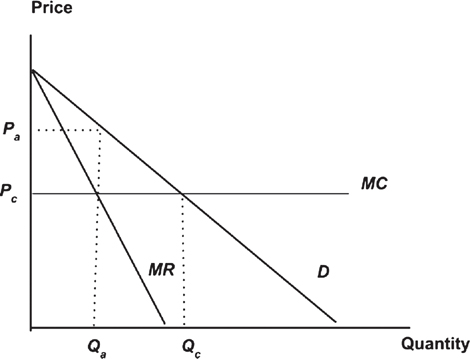
Figure 6.7 Monopoly market
Figure 6.7 depicts the price-fixing collusion outcome in the gas station market, with anticompetitive quantity Qa and a price Pa, which, according to the demand curve, is the highest price at which the colluding firms can sell their offered quantity Qa. Also shown is the competitive outcome, discussed earlier, labelled here via price PC and quantity QC.
Equating marginal revenue with marginal cost, the colluding gas stations’ profit-maximizing quantity is15 the decimal value Q = (50–2)/10 = 4.8, which is pretty close to the whole-number value Q = 5 that maximized profits in Table 6.2. Applying (6.5), profit at Q = 4.8 thousand gallons is 115.2 thousand dollars, which compares to a profit of 115.0 thousand dollars at Q = 5. Also, at Q = 4.8, price is P = 50 – 5Q = 26. That is, colluding gas stations would charge a whopping $26 per gallon of gas, compared to $2 per gallon with no collusion.
If firms cooperate they can restrict both the price and quantity of the goods they sell. If they set an agreed-upon price, quantity is determined by demand, and conversely if they set an agreed-upon quantity, then demand determines the price that buyers are willing to pay. For example, if demand is represented by (6.2), then at a set price P ≠ $2 the quantity demanded is 9.6 and a set quantity Q = 5 buyers are willing to pay P ≠ $1 for each of the 5 units.
Collusion among firms is a kind of multilateral conduct—involving more than one entity. Multilateral conduct, by two or more firms in the same or related industries, is anticompetitive if each of the following conditions holds:
A1. Firms cooperate, restricting the price or quantity of goods they sell.
A2. Cooperation causes price to exceed the non-cooperative equilibrium price.
A3. The market has a barrier to entry of additional firms.
In Example 6.3, anticompetitive conditions A1 and A2 hold since the gas stations fix prices to maximize their joint profit. This coordination may lead to a quick buck short-term, but without some barrier to entry—condition A3—the profit opportunity may be competed away by new firms entering the market. In a small town, limited resources can cause a barrier to entry, and price-fixing by gas stations is anticompetitive even if the gas station owners do not themselves create such a barrier.
In Example 6.2, dentists that agree on a “best practice” for pricing their services might may satisfy anticompetitive conditions A1 and A2. Whether or not there is a barrier to entry (A3) depends on the membership of the dentists’ association: If all dentists belong to the association, then there are no outsider dentists to “enter” to industry, so a barrier to entry exists. On the other hand, if the association only has a few members in each region, with plenty of nonmembers in each region, then there is no barrier to entry and the members’ planned pricing policies will lose out to competitors if prices rise beyond the competitive level.
If no natural barrier to entry exists, profitable coordination among firms may require the creation of some barrier, as in Example 6.4.
Example 6.4 Pricey e-books
In year 2013, a U.S. District Court found that Apple Inc. had orchestrated a conspiracy among book publishers to raise the price of e-books,16 which are digital or electronic books. The alleged conspiracy was a response to $9.99 pricing of e-books available on Amazon’s Kindle e-book marketplace, a price far below print book prices and an unavoidable part of publishers’ wholesale–retail contracts with retailer Amazon. Publishers reportedly secured from Apple a different retail agreement, based on an “agency” business relationship, allowing publishers control of retail prices, then renegotiated their Amazon contracts to an agency model also. Subsequently, prices rose—not just for e-books but print books also. The reported switch to agency did not provide more revenue per e-book for publishers short-term, but wrested pricing control from Amazon and afforded publishers a defense against the perceived threat of dominance by Amazon.
In Example 6.4, the reported agreement is an example of multilateral conduct that involves cooperation in the sense described by anticompetitive condition O1 above. If, further, facts show that publishers’ successful bid to contract with e-book retailers on an agency basis raised consumer prices for e-books and print books too, then condition O2 likely holds in the market for e-books and print books. Conditions O1 and O2 need not be anticompetitive without some barrier to entry in the marketplace (O3), and for the book publishing industry such a barrier may be associated with high “fixed” costs of recruiting top writers and successfully marketing books.
Foreclosure
Naked collusion, among firms, sounds bad and is—for society as a whole. Other sorts of firm conduct are anticompetitive sometimes, but not always. An example is foreclosure. Unless you’re an avid reader of antitrust literature, you might be thinking that foreclosure involves a lender bank foreclosing on a borrower’s house—taking it way. In antitrust, foreclosing is done by some firm, or group of firms, and what’s being taken away is access to a market by would-be competitors or potential buyers. A bank foreclosing on a homeowner is ominous but not anticompetitive. A firm foreclosing competition in a market sounds anticompetitive,17 and is—under special conditions. One such set of conditions is the following:18
F1. Foreclosure creates a barrier to entry of competing firms into a market, making it hard to compete, even in the long term.
F2. The barrier to entry results in a higher price and lower quantity, compared to a competitive marketplace.
Some market foreclosures create a barrier to entry, but the barrier may be short-lived, and so fail foreclosure condition F1. For example, the U.S. Postal Service has the exclusive right to put mail into peoples’ home mailboxes. It’s a felony for others to do so. The Postal Service is part of the government that itself created a barrier of entry by firms to peoples’ mailboxes. While the barrier to entry reduces potential competition, in recent times mail delivery firms have overcome the barrier via doorstep delivery.
Other market foreclosures create long-lasting barriers to entry, but do not elevate price or depress output. In particular, natural monopoly is a situation where one firm can scale up its operation, improve efficiency, and drive out all competing firms by selling at a price so low that competitors cannot afford to stay in business. Natural monopoly can be a natural and socially beneficial outcome in industries that have increasing returns to scale.19 The U.S. Postal Service and the National Aeronautics and Space Administration (NASA) were arguably natural monopolies for a long time, until recently.
Some market foreclosures really are anticompetitive, creating long-lasting barriers to entry that result in a higher price and lower quantity. An example is predatory pricing: the lowering of price by one or more firms to drive competitors out of business. A related form of predatory conduct is “dumping,” where a firm supplies a great deal of product to the market, triggering a fall in price, and driving out competition. Short term, predatory pricing and dumping are good for buyers since they provide more goods at cheaper prices. The bad news comes later, as quantity falls and price rises.
Price and quantity are two “instruments” that firms can use to foreclose competition. Contracts among firms are another such instrument.
Example 6.5 Google’s Android Problem in Europe
In July 2018, European authorities fined Google $5.1 billion for anticompetitive conduct in the mobile phone market. The offending conduct reportedly prevented rival developers of Internet search engines from making their search software available mobile phones running Google’s Android operating system. Getting an app, such as a search engine, onto newly manufactured mobile phone can be hard if the phone’s operating system developer doesn’t play along, creating a barrier to entry—foreclosure condition F1 stated earlier. Since Google search is free to consumers, Google’s conduct could not raise the price of search but might raise the price of other firms’ ads posted among search engine results, in which case Google may have increased ad prices and restricted their quantity, implying condition F2 in the market for ads.
Antitrust policy, in economic terms, tries to stop market foreclosures that can reasonably be expected to raise price and lower quantity. Offending conduct includes predatory pricing and dumping and also includes some mergers between firms. A mergers necessarily foreclose a competitor since there are two firms pre-merger and one firm postmerger, and the merger deal creates a “barrier to entry” in the sense that the deal cannot easily be undone or reversed. But not all mergers lead to higher prices and lower quantities.
There are many firms that operate as monopolies or oligopolies, but most do not get the way by wrongfully foreclosing a market to competition. For example, in a small town there may be only a few restaurants, but those restaurants may have no power to create a barrier to entry in the market for dine-out meals. But the potential for anticompetitive conduct lurks there too. A small town may have only a few liquor stores, and a city ordinance may require all alcohol—including beer and wine—to be sold only at liquor stores, whose number is strictly limited. The ordinance, which may have been lobbied for by liquor stores, forecloses the sale of beer and wine at local grocery stores, and may elevate prices of those products. This sort of foreclosure requires the cooperation of local government and may be hard to correct via antitrust authorities at the state and federal level.
Multimarket Antitrust Economics
Anticompetitive conduct by sellers in a single market is bad for buyers. Most markets are linked to others via labor markets that provide workers for production in the market of interest and via “vertical” and “horizontal” linkages. Vertical links include “upstream” markets for inputs, other than labor, into the production process, and possibly “downstream” markets wherein firms make purchases from the market in question. Horizontal links include …
For a firm in a market that is vertically linked with other markets, the firm may have limited ability to control the price or quantity of a good it sells. If so, it may be impossible for a firm to “cooperate” with other firms in the same industry, by fixing price or quantity to maximize their combined profit. In a multimarket context, with vertical links, the ultimate decision-making authority for price or quantity may lie with firms in an upstream industry, and if firms in that industry are competitive, then their dictates to downstream firms may not significantly harm competition even if downstream prices differ from competitive equilibrium price.
Example 6.6 Cheap Eats
Ten fast-food restaurants in a city have the same menu and same prices, each restaurant being a franchise of the same parent food company—such as McDonald’s or Burger King. Restaurant owners have franchise contracts with the parent company and the contracts include a “resale price maintenance” clause that requires restaurant to sell its menu items at prices dictated by the parent company.
In Example 6.6, franchise restaurants are linked via their contracts with the parent company, and while the contracts represent a sort of coordination among the horizontally linked firms, the restaurants do not actually have any control over the prices they charge. With set prices, demand determines the amount that diners are willing to buy, and restaurants sell that amount to maximize profit. Resale price maintenance can provide a stable price that protects franchise restaurants from financial uncertainty and also provide a reasonable return on the owner’s investment in the business. For consumers, the prices paid may not be the same as they would if markets were in competitive equilibrium, but if there is a bunch of restaurant brands, each competing for business, then pricing via resale price maintenance may be only modestly anticompetitive, if at all.
Multimarket economics, with linked markets, is more complex than single-market economics and can seriously complicate the issue of anticompetitive harm. Franchises of a brand like McDonald’s or Burger King cooperate—via contracts with the parent company—to restrict price, and so satisfy the anticompetitive condition A1 stated earlier, but cooperation may or may not cause franchise menu price to exceed competitive equilibrium price, so condition A2 may or may not hold. Without a barrier to entry by competing fast-food restaurants, any excess profit won by franchises would likely be competed away, but there are no significant barriers to entry into the fast-food restaurant industry, so condition A3 doesn’t appear to hold. In other words, the conduct of the fast-food restaurant franchises in Example 6.6 isn’t obviously anticompetitive from an economic standpoint.
Cooperation among firms within a given industry, caused by their linkage to firms in another industry, could be anticompetitive, but unlike single-market price-fixing collusion such coordination is not obviously anticompetitive. Consistent with this view, U.S. courts tend to apply a “rule of reason” approach to determining if such coordination is anticompetitive, whereas single-market collusion to fix price and artificially create profit is necessarily or “per se” illegal.
Potentially anticompetitive multimarket conduct includes the “bundling” or “tying” of goods that, in principle, could be sold in separate markets. If, say, each maker of laced shoes were to design their shoes so that they could only work with specially made proprietary laces, then firms that made regular laces might be unable to sell their laces directly to customers. If the special laces were really no better than regular laces, from the customer’s standpoint, then the buyers may lose some benefits of market competition without gaining any shoe quality. This sort of bundling may be economically inefficient and, by padding the wallets of shoe company owners, anticompetitive.
In a multimarket setting, there are more possibilities for market foreclosure than in a single market setting. On such possibility, in vertically linked markets, is that some sellers in an “upstream” market contract with some buyers in a “downstream” market, such that the buyer cannot buy from competitors in the upstream market. For example, a supplier of soft drinks to restaurants may require the restaurants to serve only that firm’s products, such as the “Pepsi” group, and not a rival’s, such as the “Coke” group. This sort of exclusive dealing arrangement likely forecloses some of the downstream market to some upstream supplier. Of course, each upstream supplier may make such deals. Depending on how the downstream market is defined, there may or may not be a barrier to entry caused by vertical market foreclosure and downstream customers may or may not be made worse off by such foreclosure.
Economic Damages
Businesses that harm competition may be liable for economic damages. As discussed earlier, anticompetitive conduct by firms in a market can cause a loss to buyers. The government can recoup some or all of such losses born by society via fines on those responsible, with fines going to government coffers. Fines may reflect the extent of economic damage to society, with the goal of compensation, and may include additional dollar amounts intended to deter future anticompetitive conduct by other firms. The government can compel restitution by making firms disgorge some of their profits in other ways: for example, by making firms donate goods to public and nonprofit groups.
In the United States, the federal government’s Department of Justice and Federal Trade Commission investigate many antitrust cases each year, as do state governments. Fines and disgorgement in antitrust and anticompetition cases can include dollar amounts that represent economic loss to society. Other cases involve private lawsuits against firms brought by their customers, with damage awards that include economic loss to customers, or brought by would-be competitor firms whose operation was precluded or foreclosed by the alleged anticompetitive behavior of the firms being sued.
To the extent that firms gain an unjust profit from anticompetitive conduct, their profits represent an economic loss to customers, via a loss of consumer surplus. The amount of this ill-gotten profit is also measure of economic loss or damages. Business records, including accounting profit and loss statements and tax returns, shed light on a firm’s actual profits, but may not suffice to assess the excess profit associated with anticompetitive conduct.
For each unit of good sold, the addition to profit caused by allegedly anticompetitive conduct is Pa – Pc, with anticompetitive price Pa and competitive price Pe as defined earlier. The profit is positive if the conduct under study elevates price in the marketplace. The total amount of overcharge is then a relevant measure of buyers’ loss
overcharge = (Pa – Pc)Qa (6.8)
where Qa is the quantity of goods sold at the anticompetitive price.
To apply the formula (6.8) for economic loss, some values for the formula’s inputs are needed, as is a clear definition of the market in which the relevant good is sold. Business records, from the firm(s) under scrutiny, and possibly customer records, shed light on relevant values for the actual and allegedly anticompetitive price Pa and quantity Qa. More challenging is to identify a relevant value for the competitive price Pc. At the time of the alleged anticompetitive conduct, the observed market price is Pa, whereas Pc is unobserved and represents the price that would have prevailed “but-for” the alleged conduct.
The overcharge (6.8) represents a loss to buyers in a given market, but in markets for inputs like steel, an overcharge can lead to higher prices in finished products like cars. In principle, if suppliers in an input market cause anticompetitive harm in that market, then they also cause harm in “downstream” markets and could be liable for economic damage to output sellers. However, the offending “upstream” makers of inputs do not profit from downstream firm losses, only from the loss of surplus by upstream buyers. Upstream firms inadvertently harm downstream firms, a sort of negative externality that may not have a clear remedy in antitrust law.
Past prices, before some allegedly anticompetitive price hike, may reasonably represent the competitive market price Pc , provided that no other anticompetitive forces were in play then.
Example 6.7 Collusion at the Pump
For the twin gas stations in Example 6.3, suppose that in week 1 they are in non-cooperative equilibrium but in week 2 decide to collude and charge the monopoly price. The competitive outcome is non-cooperation and the anticompetitive one is cooperation. With this interpretation, from earlier calculations Pc = $2, Pa = $26, and Qa = 4.8 million gallons of gas weekly, in which case the profit generated by collusion in week 2 is
(Pa – Pc)Qa=(26 – 2) (4,800,000)=$115,200,000.
Since price inflation tends to raise all prices over time, a past price at, say, time s may underestimate its expected value at a later time t and some adjustment for inflation may be needed when estimating Pc via historical prices. In other words, a “but-for” competitive price ![]() in an allegedly anticompetitive period t can be computed from past equilibrium price
in an allegedly anticompetitive period t can be computed from past equilibrium price ![]() together with annual “but-for” inflation rates πs+1,...,πt for years s + 1,...,t, as follows
together with annual “but-for” inflation rates πs+1,...,πt for years s + 1,...,t, as follows
Pc,t = Pc,s × (1 + πs+1) × (1 + πs+2) × ... × (1 + πt)(6.9)
provided that information on the relevant inflation rates is available.20 Inflation data may be available from another location, within the same market, that was not subject to the allegedly anticompetitive conduct. If this other location happens to have a comparable equilibrium price level Pc,t, then this value may be used, as a sort of “yardstick,” without the need to apply inflation rates to a past price level via (6.9).
The overcharge (6.8) is also a loss of some consumer surplus, but may not be all of it. Extra loss of consumer surplus exists as a component of deadweight loss. In Figure 6.8, the triangle-shaped area X is this extra loss of consumer surplus.
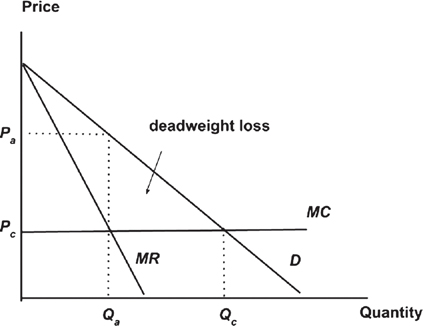
Figure 6.8 Monopoly deadweight loss
The part X of deadweight loss is the area under the demand curve and above competitive price for quantities in the range [Qa,Qc]. If the demand curve is a straight line, as in Example 6.6, the area X is that of triangle: (1/2) × base × height, with base = Qc – Qa and height = Pa – Pc, in which case
In Example 6.6, Qc – Qa = 10.4 – 4.8=5.6 million gallons of gas and Pa – Pc = 26 – 2 = $24, in which case, applying formula (6.10), X = ![]() 5,600,000 × 24 = $67.2 million. Compared to the overcharge of $115.2 million, the extra loss of consumer surplus is less, but still big.
5,600,000 × 24 = $67.2 million. Compared to the overcharge of $115.2 million, the extra loss of consumer surplus is less, but still big.
The extra loss X, of consumer surplus, can in principle be added to the monopolist’s overcharge to get a combined measure of economic loss, but would require additional data. Business records and/or customer records may provide a measure of the competitive quantity Qc that would have been sold, but for the alleged anticompetitive harm, facilitating the use of (6.10). However, the extra loss X involves a reduction Qc – Qa in output that is due in part to buyers’ behavior when faced with a price hike. To the extent that the quantity reduction is a buyer response to the seller’s price hike, courts may consider buyers partly responsible for the extra loss X. If so, it may be inappropriate to add together the overcharge (6.8) and extra loss (6.10). The extra “loss” X might be listed separately, if at all.21
Whether or not the extra loss X of consumer surplus counts toward the calculation of economic losses or damages in an antitrust case, there is some economic interest in the competitive market equilibrium quantity Q* that would have existed but for the alleged conduct. For example, if the two gas stations in Example 6.6 raised their listed prices and the quantity purchased rose, rather than fell, a reason might be a spike in demand, not collusion between station owners to collect monopoly profits. A proxy for the “but-for” quantity Qc in the period of alleged loss may be the past quantity supplied by accused firms or the quantity supplied in a neighboring or comparable “yardstick” market during the loss period. 22
Customers of a given firm can be harmed by anticompetitive conduct, as can other firms whose opportunity to complete for customers is excluded or foreclosed upon by such conduct. In Example 6.5, firms providing Internet search engines—and online ads—are reportedly foreclosed upon by a barrier to entry created by a dominant firm (Google). Economic damages, in such cases, can include the loss of earnings or profit associated with foreclosed business. A simple measure of economic loss to foreclosed firms is the market share s* that such firms would have enjoyed but for the barrier to entry, multiplied times the forecloser’s profit
foreclosed’s loss = s* × (forecloser’s profit) (6.11)
In Example 6.2, if the foreclosed firms would have had 50 percent of the Internet search business but for the forecloser’s conduct, and if the forecloser’s profit is $$$2 billion, then the loss (6.11) to foreclosed firms is 0.5 times 2 billion, which is $1 billion.
Application of the market foreclosure loss formula (6.11) requires a value for the “but-for” market share s*. If a market exists in which the accused firm operates but has not foreclosed competition, s* might be estimated by the share that other companies have in that other market. Or, if there is market share information prior to foreclosure, the preforeclosure share of competitors could be used. Without such comparables, an economist may still be able to estimate s* using a model of supply by the accused firm and potential competitors. To apply such a model, an economist would need information about each of the suppliers, including their production costs.
A limitation of the market foreclosure loss formula (6.11) is that it relies on the forecloser’s profits that are likely elevated by the foreclosure itself. Without the foreclosure, competing firms may have enjoyed some market share s*, but the total earnings or profit of all firms would likely have been less than the actual profit of the foreclosing firm. In other words, (6.11) likely overstates losses to the foreclosed. An alternative approach is to develop a “but-for” measure of profit, call it profit*, and estimate losses via
foreclosed’s loss = s* × profit* (6.12)
For an economist who has identified a “but-for” industry supply curve, profit* is the area above that supply curve and below but-for equilibrium price Pc, over the range of quantities (0,Qc. One possibility is that the competitive outcome yields zero economic profit, and in that case, there is zero loss (6.12) associated with market foreclosure.
In a multimarket economy, economic damage calculation may require an analysis of linkage between markets. For example, in vertically linked markets, an upstream firm’s foreclosure of a downstream consumer’s access to a rival upstream firm’s products may reduce the demand for the rival’s products. The rival’s profit loss may or may not qualify as economic damages, but if it does, then its value depends on the rival’s business costs and the extent of demand shift. An in-depth analysis of such topics could fill a book on its own, but hopefully this chapter has provided the reader an introduction to some essential themes related to business liability and antitrust economic damages.
- 1.The U.S. government “forecloses” the market for mail delivery to home mailboxes by making such deliveries a federal felony crime, except for employees of the U.S. Postal Service.
- a.Why do you think that the U.S. government forecloses the market for mailbox deliveries?
- b.It’s not a federal felony crime to take items from a home mailbox, only to put things in the mailbox. Why might that be so?
- c.Do you think that the government’s foreclosure of mailbox delivery is bad for the consumer? Explain.
- d.If the government removed the ban on commercial delivery of mail to mailboxes, what would be the likely economic consequences?
- 2.Explain the effect on economic efficiency of a barrier to entry created by a firm to keep out competitors.
- 3.A natural monopoly, like a provider of electricity to a community, is economically efficient even though it forecloses competition via low prices. Explain.
- 4.In the market for hotel services, what barriers exist to entry by new firms? Do these barriers create a problem for the consumer of hotel services? Explain.
- 5.Suppose that there is a single firm in a market, and that there are no barriers to entry by other firms. The firm that operates in the market has little, if any, economic profit, and the firms on the “fringe” have no interest in entering the market. In this market, with a monopolist and competitive fringe, is the monopolist’s conduct anticompetitive? Explain.
- 6.In a small town, there is a single dry cleaning service. The dry cleaner faces a daily demand curve D(P) = 100 - 2P and marginal cost MC = $3 for each service provided.
- a.The dry cleaner’s marginal revenue curve is MR(P) = 100 – 4P. Find the profit-maximizing price and quantity.
- b.How much profit does the dry cleaner make?
- c.If the monopolist does not foreclose competition by potential rivals in the dry cleaning market, is the monopolist’s profit anticompetitive? Explain.
- 7.Two firms collude to raise price and profit in the market they serve. What is the likely effect of collusion on quantity supplied the market?
- 8.Suppose that you want to start a business selling mobile (or “cell”) phone cases or covers to consumers, via a kiosk or vendor cart at a local shopping mall.
- a.Is the market for cell phone cases nationwide and are there many sellers or few?
- b.Given the listed prices for cell phone cases at Walmart, Best Buy, and online, what range of prices could you reasonably get for selling at the mall?
- c.After a few months of earning little profit from your business, suppose you contract with a company run by your cousin, to sell the country’s only cell phone cover having a patented piezoelectric pressure-sensitive glow effect: you squeeze the phone and it glows. You sell the product at the mall, and also online with great success, under a 10-year exclusive contract you secured from the manufacturer. In what sense might your conduct be anticompetitive?
- 9.A hospital buys special medical equipment from two companies, A and B, that are the only ones that deliver and install equipment in the town where the hospital is located. In year 2018, each company charged $10,000 per unit of equipment installed, but in year 2019 the price increased to $20,000.
- a.Is the doubling of price, from year to year, proof that companies A and B cooperated or colluded to raise price in year 2019? Explain.
- b.If the hospital decides to buy no medical equipment in year 2019 due to high prices, do they incur an economic loss from the price hike?
1A case before the U.S. 2nd Circuit federal appellate court, decided in year 2015, reference numbers 791 F.3d 290 (2015).
2For an example of how antitrust law and economics are commonly discussed, see the periodical Antitrust produced by the American Bar Association and also relevant articles in the academic journal The Journal of Law and Economics.
33For the reader interested in economic damages in monopoly, cartel, and other antitrust cases, a good starting point is Chapter 7 of the book Quantitative Techniques for Competition and Antitrust Analysis (Princeton University Press, year 2010) by Peter Davis and Elaina Garces. Other relevant works are listed at the end of this book.
4For more discussion on themes discussed in this chapter, see Gilbert (2018).
5The process by which one business replaces another and thereby benefits society as a whole is sometimes called creative destruction, a term attributed to the economist Joseph Schumpeter.
6For more on the relation between antitrust law and economics, see Chapter 1 of Gilbert (2018) and references therein.
7Markets provide both goods and services to society, but for brevity I’ll just say “goods” instead of “goods and/or services” when discussing markets.
8According to an article by Juliet Milliot, appearing in Publishers Weekly on October 5, 2018, there were about 266,000 Trade Paperback books known to have been published in the first 9 months of year 2018.
9The function QD(P) is sometimes called the inverse demand curve and QS(P) is called the inverse supply curve.
10The 1st, the 2nd, and so on, through Qc total units that are traded in equilibrium.
11A firm’s costs include variable costs and other costs that are fixed—at least in the short run. For some business decisions, fixed costs are “sunk” and do not affect the best possible decision.
12In a competitive market, the supply curve S(Q) reflects seller costs and is commonly interpreted as a “marginal cost” curve—showing the additional variable cost S(Q) that results from the last of Q units are produced. Subtracting from price P the marginal cost S(Q), for each unit produced, and adding the resulting unit-specific profits across units 1, 2,…,Qc, the result is producer surplus—the triangle-shaped area in Figure 6.5.
13For prices P below equilibrium Pc, quantity demanded exceeds quantity supplied and the quantity actually traded is QS(P). Total surplus in this situation equals the area under the demand curve and above the supply curve, over the range of quantities 0 to QD(P). This area is of the same sort shown in Figure 6.5 and is smaller than the equilibrium outcome’s surplus by a triangle-shaped region—the deadweight loss—like that shown in Figure 6.5.
14A duopoly is a special case of oligopoly, with two firms.
15With MR(Q) = ![]() and MC(Q) = 2, setting MR(Q) = MC(Q) means that
and MC(Q) = 2, setting MR(Q) = MC(Q) means that ![]() , in which case
, in which case ![]() and
and ![]() .
.
16The quote at the beginning of this chapter is from that case.
17Even more anticompetitive sounding is the statement that a firm monopolizes a market. A firm that forecloses competition in a market is also monopolizing, in some sense, but is doing so in a specific way—by creating a barrier to entry by other firms.
18Conditions F1-F2 describe foreclosure within an individual market by some firms. In a multimarket setting, with vertically linked markets, vertical market foreclosure can involve sellers in an upstream market foreclosing some buyers in a downstream market, for example. See the next section of this chapter for related discussion.
19See Chapter 6 of Gilbert (2018) for recent discussion of natural monopoly and government regulation.
20The competitive inflation rate πt in period t is ![]() .
.
21Since X represents an area below the demand curve and above equilibrium price, over a certain range of quantities, a calculation of X requires some knowledge of the demand curve. Formula (6.11) works if the demand curve D(p) is linear, but the curve may instead be nonlinear: an example is D(p) = p–1/2. The additional knowledge required to calculate X may limit its role in determining economic damages.
22Competitive market quantities can increase over time due to increases in demand, and demand shifts would need to be accounted for when using a past market quantity as proxy for future quantity. Also, market quantities can differ across regions due to differences in regional population, income, and other demographic factors, and such factors would need to be accounted for when using a contemporaneous regional quantity to proxy for Qc.