
Chapter 8
Experimentation
Learning Objectives
Upon completion of this chapter, you will be able to:
- Understand the concept of experimentation and causality
- Understand the internal and external validity issues in experimentation
- Understand the threats to internal and external validity in experimentation
- Understand the ways to control extraneous variables
- Understand and compare a laboratory experiment and field experiment
- Understand the concept of experimental designs and deal with various types of experimental designs
- Understand the limitations of experimentation
- Understand the concept of test marketing and different types of test marketing techniques
RESEARCH IN ACTION: BERGER PAINTS INDIA LTD
Berger Paints is the culmination of over seven-decade process of evolution and growth that began in 1923. The company’s growth is closely linked with the business and industrial development of modern India. Berger’s performance is anchored today in a wide variety of decorative and industrial paints, which continue to gain an increasing share of the highly competitive Indian paint market. Being an ISO 9001 company, the quality products of the company have attained an instant recognition worldwide and continue to meet the quality requirements that are demanded today even in the domestic market.1
Berger Paints India Ltd, owned by the Dhingra Group, was incorporated in the year 1923. The company was originally formed by Mr Hadfield, and the Dhingra Group took over it in 1991. The company is engaged in the business of manufacturing and marketing of paints and varnishes in India. Product range of the company includes synthetic enamel, interior and exterior wall coatings, wood finish, and acrylic emulsions. The enamels are marketed in the brand name of Luxol Hi Synthetic, Luxol Satin, Luxol Lustre, and so on. WeatherCoat Longlife and WeatherCoat Smooth 100% Acrylic are the popular brands of exterior wall coatings. The company markets interior wall coatings in five different brand names and offers complete painting solution services in the name of home decor, which includes professional help on the product selection, material delivery, clean up, and supervision. It has launched Lewis Berger ColorBank, which is based on the computerized paint technology, having a range of shades.2 The success story of the company is witnessed through the income and profit after tax status of the company from 1994–1995 to 2008–2009 (Table 8.1).
TABLE 8.1 Income and profit after tax (in million rupees) of Berger Paints India Ltd from 1994–1995 to 2008–2009
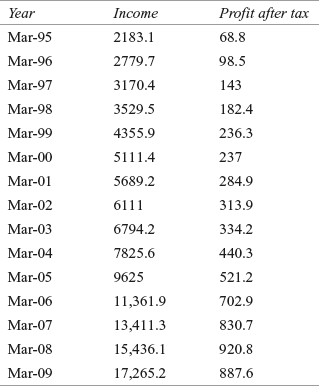
Source: Prowess (V. 3.1), Centre for Monitoring Indian Economy Pvt. Ltd, Mumbai, accessed September 2009, reprinted with permission.
In the financial year 2008–2009, similar to other paint companies, Berger Paints India Ltd has also suffered from the deterioration in profit after tax status. Rising crude oil price and higher interest cost post-September 2008 are some of the reasons. In September 2008, the world economy has taken an abrupt turn affecting the situation in an adverse way. This also has an adverse impact on the performance of some Indian companies and their international operations. Nowadays, many global companies are changing the strategies so as to operate in that part of the globe that is less affected by the environmental adversities, as compared to focus on the part of the globe that is affected highly by the environmental adversities. This may be a very good exercise to pool the losses incurred from one segment of the globe by the another segment.
The Indian companies have also realized the importance of being global and catering market through global operations. Commenting on the profit decline of 2008–2009, Subir Bose, managing director of Berger Paints India Ltd, said, “We will have volume growth but with paint prices now coming down to levels of 2007–08, value growth will be a challenge. Our overseas operations have not been impacted heavily due to recession as our exposure is very small.”3 Assume that Berger Paints has decided to go for a massive brand awareness programme in the overseas market. For formulating a broad research programme, the company has decided to go for experimentation.
How pilot test and conduction of the final test will be operationalized? Which experimental design should be used? Field experiment or laboratory experiment, which model should be used? What will be the relevant variables for testing? How a researcher will be controlling the environment and extraneous variables? This chapter provides an opportunity to answer all such type of questions and attempts to make the readers aware of the complete process of experimentation.
8.1 INTRODUCTION
For understanding the concept of experimentation, let us take a simple example of a firm facing a problem of decline in sales. The firm is desperate to understand the reasons of the decline in sales. There may be many factors responsible for this slump such as poor advertisement impact, lack of sales people support, perceived poor quality of the product, lack of motivation for dealers and retailers, poor promotional policies adopted by the company, high turnover rate among sales people, and so on. The company has to understand the main reasons of the decline in sales and must be focused on these reasons to control the slump in sales.
We have already discussed some techniques such as using the secondary data, survey, and observation to collect the data to explore the insights of the problem in hand. These techniques are important to explore the dimensions of the problem in hand but are not able to provide the definitive answer to the research question. These techniques are basically exploratory and descriptive in nature and are not able to answer causal questions. Experimentations are generally used to determine the “causal relationship” between the variables. As discussed in the decline in sales example, there may be various causes of the decline in sales, and we focused on few of these listed earlier. To understand the causal relationship, we take an independent variable “perceived poor quality of the product” as the determinant of research question “decline in sales.” Now, it is important to understand that the perceived poor quality of the product is not the only cause of the decline in sales, there may be many more. In addition, the perceived poor quality of the product not always determines the decline in sales; it is only the probabilistic cause in the decline in sales. More specifically, we can never prove that the perceived poor quality of the product is the determinant of the decline in sales; we can only infer that this independent variable may be the reason of the decline in sales.
8.2 DEFINING EXPERIMENTS
Experiments can be defined as the systematic study in which a researcher controls or manipulates one or more independent (experiment) variables to test a hypothesis about the independent variable. Independent variables are the variables that are manipulated or controlled by the researcher. As given in Section 8.1, poor advertisement impact, lack of sales people support, perceived poor quality of the product, lack of motivation for dealers and retailers, poor promotional policies adopted by the company, and high turnover rate among sales people are independent variables. On the other hand, dependent variables are variables on which a researcher has little or no control over the research process, but the researcher is keen to note a change in it with the corresponding change in the independent variables. In the chapter opening example, sales are the dependent variables. The researcher manipulates the explanatory or independent variable and then observes that the hypothesized dependent variable is affected by the intervention of the researcher or not. During this process of intervention by the researcher, all other independent variables that may confound the relationship between dependent and independent variables are being controlled or eliminated. Hence, the main purpose of the experimentation is to provide an opportunity to the researcher, where he is able to control the research situation for determining the causal relationship between the dependent and independent variables. In their book, Marketing Research: Measurement and Method, Tull and Hawkins have stated that the essence of experimentation is the manipulation of one or more variables by the experimenter in such a way that its effect on one or more variables can be measured.1
Experiments can be defined as the systematic study in which a researcher controls or manipulates one or more independent (experiment) variables to test a hypothesis about the independent variable.
Independent variables are the variables that are manipulated or controlled by the researcher. On the other hand, dependent variables are variables on which a researcher has little or no control over the research process, but the researcher is keen to note a change in it with the corresponding change in independent variables.
Before detailing experimentation, we will first focus on the concept of causality, a prerequisite for experimentation. We do things in the world by exploiting our knowledge of what cause what.2 In fact, causality is a conditional phenomenon between variables in the form “if x, then y.” Causality is an important aspect of how we construct reality.3
In fact, causality is a conditional phenomenon between variables in the form “if x, then y.”
There exist four formal conditions for causality: covariation, time order of occurrence of variable, systematic elimination of other causal variable, and experimental designs. Covariation is the extent to which a caused variable occurs with the causal variable together or vary together as the framed hypothesis under consideration. For example, sales (dependent variable) move upward with the lowered status of the price (independent variable). The second condition, time order of occurrence of variable, explains that the causal variable changes prior to or simultaneously with the caused variable; hence, it cannot occur afterwards. For example, when prices are increased on the first day of the month, sales go down on the remaining days of the month. The third condition, systematic elimination of other causal variables, indicates that the variable being investigated should be the only causal explanation of any change in the dependent variable. For understanding the third condition, let us take the chapter opening example again. The lack of sales people support may be the cause in slump in sales when a researcher is confident that all other possible variables affecting sales, such as poor advertisement impact, perceived poor quality of the product, lack of motivation for dealers and retailers, poor promotional policies adopted by the company, and high turnover rate among sales people, are held constant or otherwise controlled by the researcher. The experimental designs are a set of procedures conducted to state the unequivocally causal nature of the variable. For example, to determine the slump in sales, a formal market test should be designed and conducted.
There exist four formal conditions for causality: covariation, time order of occurrence of variable, systematic elimination of other causal variable, and experimental designs.
8.3 SOME BASIC SYMBOLS AND NOTATIONS IN CONDUCTING EXPERIMENTS
To provide the roadmap of understanding the concept of experimentation, it is important to have some prior understanding or knowledge of some basic symbols and notations frequently used in the experimentation. Following is the list of some basic symbols and notations used in conducting the experiment:
To provide the roadmap of understanding the concept of experimentation, it is important to have some prior understanding or knowledge of some basic symbols and notations frequently used in the experimentation.
O = Observation or measurement made on dependent variable as a part of the experiment
X = Exposure of the test unit under investigation to independent variable or experimental manipulation or treatment
EG = Experimental group that is exposed to the experimental manipulation or treatment
CG = Control group participating in the experiment but has no exposure to the experimental manipulation or treatment
R = Random assignment of test units and experimental manipulation or treatments to the groups
M = Match of experimental group and control group on the basis of some concerned related characteristics
The symbols O1, O2, O3, and so on are indications of three or more observations or measurements made on dependent variable as a part of the experiment. Similarly, X1, X2, X3, and so on indicate that the test unit under investigation is exposed to three or more independent variables or experimental manipulation or treatment. The symbols EG1, EG2, EG3, and so on are used to indicate that the experiment has three or more experimental groups. Similarly, the symbols CG1, CG2, CG3, and so on are used to indicate the participation of three or more control groups in the experiment.
8.4 INTERNAL AND EXTERNAL VALIDITY IN EXPERIMENTATION
If the design and structure of a study are such that one can confidently conclude that the independent variable caused systematic changes in the dependent variable, then the study is said to have a high internal validity. On the other hand, if the study gives us a plausible alternative interpretation of the observed relationship between the independent and dependent variable, then it is said to have a low internal validity. The external validity typically refers to the generalizability of the results of a study to other (usually real world) settings or populations.4
If the design and structure of a study are such that one can confidently conclude that the independent variable caused systematic changes in the dependent variable, then the study is said to have a high internal validity. On the other hand, if the study gives us plausible alternative interpretation of the observed relationship between the independent and dependent variable, then it is said to have a low internal validity.
The internal validity indicates that the manipulation in experimental treatment or independent variable causes an observed effect on the dependent variable. If the observed effect is influenced by the confounding impact of extraneous variables, then drawing valid conclusions about the causal relationship between the experimental treatment (independent variable) and dependent variable becomes extremely difficult. The problems of the external validity generally relate to the possibility that a specific, but time limited, set of experimental conditions may not deal with the interpretations of untested variables in the real world.5 The lack of external validity puts a researcher in a difficult situation to repeat the experiment for a different set of subjects in different time span. If an experiment lacks the internal validity, then there is no meaning in generalizing the result of the experiment. Factors that are of serious concern for the internal validity of the experiment may also jeopardize the external validity of the experiment. The major source of threat to the internal validity of the experiment is the impact of different extraneous variables.
The external validity typically refers to the generalizability of the results of a study to other (usually real world) settings or populations.
8.5 THREATS TO THE INTERNAL VALIDITY OF THE EXPERIMENT
The following section focuses on some extraneous variables, such as history, maturation, testing, instrumentation, statistical regression, selection bias, and mortality, that seriously jeopardize the internal validity of the experiment.
8.5.1 History
History effect refers to a specific event in the external environment that occurs between the commencements of experiment and when the experiment ends. More specifically, this event in the external environment may influence the subjects during the experiment and has an impact on the first and second measurements. This external event happens to be beyond the control of the researcher. History does not deal with the event occurred before the experiment, rather it deals with the event that occurs during an experiment. For example, a coloured television producer has decided to determine the impact of a new advertisement campaign. The company’s researchers have decided to take two measurements, first after 1 week of the launch of the advertisement and second after 15 weeks of launching the advertisement. The company’s researchers have taken the first measurement, after 1 week of the launch of the advertisement campaign. In the meantime, in the ninth week of the experiment, another multinational company stepped in the market with the support of a heavy advertisement campaign. Now the second measurement of the company’s research team will always be influenced by the introduction of this external event during the experiment. A researcher should try to isolate the effect of history, as he or she is not able to control its impact as it is external and beyond the control of the researcher.
History effect refers to a specific event in the external environment that occurs between the commencements of experiment and when the experiment ends.
8.5.2 Maturation
It is always possible that during the experiment, subjects may mature or change. Therefore, with time, a change may be observed in the subjects themselves, but more important, it is not due to the experimental treatment or independent variable. In an experiment, maturation takes place when the subjects become older, bored, experienced, or disinterested during the experiment. If a company offers an incentive scheme to enhance the productivity of plant workers, then the company decides to test the level of productivity over 2 years. The productivity of the plant workers may improve over the 2 years because the subjects (plant workers) may become more skilled or more experienced. The increased productivity may not be due to experimental treatment (incentive scheme offered by the company).
In an experiment, maturation takes place when the subjects become older, bored, experienced, or disinterested during the experiment.
8.5.3 Testing
A testing effect occurs when a pre-test measurement sensitizes the subjects to the nature of the experiment. As a result, in a post-test measurement, the respondents may react differently when compared with the situation when they were not exposed to the pre-test measurement. This occurs in a before-and-after kind of study when taking a measurement before the application of treatment sensitizes respondents and they respond differently as a matter of sensitization to the experiment processes. The measurement before the application of treatment enhances the tendency of the respondents to give a socially desirable answer.
A testing effect occurs when a pre-test measurement sensitizes the subjects to the nature of the experiment.
8.5.4 Instrumentation
The instrumentation effect is said to be occurred in an experiment when either the measuring instrument or the observer changes during the experiment. In some cases, researchers modify the measuring instruments during the experiment, resulting in instrumentation effect. Sometimes, the researchers present different sets of questionnaire to the respondents to tackle the problem of the testing effect. In doing so, they avoid the testing effect but encounter with the problem of instrumentation effect. The internal validity threatens the experiment when there is a change in the way of asking a question, change in the interviewer, and other procedures used to assess the change in the dependent variable. For example, if two interviewers are engaged in a before-and-after measurement, then there is a possibility that the way of placing and wording questions may be different for these two interviewers and results in the instrumentation effect of the experiment.
The instrumentation effect is said to be occurred in an experiment when either the measuring instrument or the observer changes during the experiment.
8.5.5 Statistical Regression
Statistical regression is the tendency of the subjects with extreme scores to migrate (regress) towards the average scores during the experiment. For example, in a job satisfaction-measuring survey, few subjects may have scored very satisfied (extreme score) and few subjects may have scored very dissatisfied (extreme score) in the pre-test measurement. There is a strong possibility that in the post-test measurement, attitude of the subjects may change and they will move towards the average scores. This often happens because the respondents with extreme opinion have more space to move towards average over the passage of time. Therefore, under the effect of statistical regression, the change in post-test measurement is not due to the application of treatment but due to the extraneous variable referred as statistical regression.
Statistical regression is the tendency of the subjects with extreme scores to migrate (regress) towards the average scores during the experiment.
8.5.6 Selection Bias
Selection bias occurs when an experimental group significantly differs from the target population or control group. Similarity between the experimental and control groups is extremely important, so that the difference in the result can be attributed to the experimental treatment and not to the difference between the experimental and control groups. A random assignment of the subjects to the experimental and control groups largely solves the problems of the selection bias. The experimental and control groups should be as similar as possible.
Selection bias occurs when an experimental group significantly differs from the target population or control group.
8.5.7 Mortality
Mortality effect occurs when the subjects drop out while the experiment is in progress. The subjects refuse to participate in the experiment because of various reasons such as lack of time, loss of interest in the experiment, and so on. Mortality is a problem because a researcher is not sure that the lost subjects would respond to the experimental treatment in the same manner as the remaining subjects respond. For example, in an experiment related to measure the effect of a new incentive scheme, few subjects of the experimental group will drop out because they do not like the new incentive scheme, and as a result, they have taken a sophisticated way in terms of not participating in the experiment. This will not present an opportunity to a researcher to compare the results of the experimental and control groups without any premeditated bias.
Mortality effect occurs when the subjects drop out while the experiment is in progress.
8.6 THREATS TO THE EXTERNAL VALIDITY OF THE EXPERIMENT
As previously discussed, the external validity refers to the ability of an experimental result’s generalizability to other populations. We have also discussed that if an experiment lacks the internal validity, then there is no meaning in generalizing the result of the experiment. In other words, the internal validity can be viewed as a necessary, but not sufficient, condition for external validity.6 In the following section, we will focus on the four biases, such as reactive effect, interaction bias, multiple treatment effect, and non-representativeness of the samples, that seriously jeopardize the external validity of an experiment.
8.6.1 Reactive Effect
Reactive effect occurs when the respondents exhibit an unusual behaviour knowing that they are participating in an experiment. Reactive effect is an area of prime concern in a laboratory experiment when compared with a field experiment, though in the latter, this effect cannot be eliminated. Exhibiting an unusual behaviour, while participating in an experiment, is a natural phenomenon of respondent’s behaviour. For example, if a company is willing to determine the purchase behaviour of the consumer in a particular departmental store and has chosen 100 participants for this purpose, then there is a high possibility that these 100 respondents will exhibit an artificial behaviour as being watched by the observer.
Reactive effect occurs when the respondents exhibit an unusual behaviour knowing that they are participating in an experiment.
8.6.2 Interaction Bias
Interaction bias occurs when a pre-test increases or decreases the sensitization of the respondent to the experimental treatment. A reactive bias generates from the experiment as a whole, whereas an interaction bias reflects from the increased or decreased sensitivity of the respondents due to the pre-test exposure of the experimental manipulation.
Interaction bias occurs when a pre-test increases or decreases the sensitization of the respondent to the experimental treatment.
8.6.3 Multiple Treatment Effect
Multiple treatment effect occurs when a participant is exposed to multiple treatments. This is quite obvious that the impact of previous treatments cannot be fully erased from the mind of the respondents. Hence, the impact of any previous treatment on the later treatment cannot be simply ruled out.
Multiple treatment effect occurs when a participant is exposed to multiple treatments.
8.6.4 Non-Representativeness of the Samples
This is mainly a sampling problem. It has also been discussed in the chapter related to sampling that the sample must be a true representative of the population. Sometimes, it happens that a researcher knowingly or unknowingly selects the subjects who may not be a true representative of the population. When this happens in an experiment, it lacks external validity.
Sometimes, it happens that a researcher knowingly or unknowingly selects the subjects who may not be a true representative of the population. When this happens in an experiment, it lacks external validity.
8.7 WAYS TO CONTROL EXTRANEOUS VARIABLES
It has already been discussed that the presence of extraneous variable poses a serious threat to the internal as well as external validity of the experiment. Extraneous variables if present in the experiment affect the result in terms of affecting the dependent variable for the reasons other than the application of experimental treatment. In fact, the extraneous variables confound the result, which is why these are sometimes referred to as confounding variable. The four ways to control the extraneous variable are randomization, matching, statistical control, and design control.
8.7.1 Randomization
Randomization refers to the random assignment of the subjects and experimental treatment to experimental group to equally distribute the effect of extraneous variables. Randomization not fully eliminates the effect of extraneous variable but controls the effect of extraneous variables. In fact, randomization ensures the researcher that the groups are identical with respect to all the variables and the result, which the researcher is observing, is due to the experimental treatment. It is no wonder that the vast majority of the experimentalists recognize randomization as the greatest strength of their research design.7
Randomization refers to the random assignment of the subjects and experimental treatment to experimental group to equally distribute the effect of extraneous variables.
8.7.2 Matching
When a researcher suspects that the extraneous variables may affect the dependent variable, he or she applies the technique of matching, which involves matching each group on some pertinent characteristics or some pertinent background variables. For example, if a research question is to determine the impact of income level on job satisfaction of the employees, it will be very important for a researcher to match the experimental group and the control group on income to get the desired result. Although matching assures a researcher that the subjects on each group are similar on some key background characteristics, a researcher is never sure that the subjects on each group are similar on all the characteristics. As another matter of concern, if matching on some pertinent variable has no affect on the dependent variable, then it unnecessarily devours the energy of a researcher.
When a researcher suspects that the extraneous variables may affect the dependent variable, he or she applies the technique of matching, which involves matching each group on some pertinent characteristics or some pertinent background variables.
8.7.3 Statistical Control
With the help of a statistical control, a researcher measures the effect of extraneous variable and adjusts its impact with a sophisticated statistical analysis. In this context, a statistical technique such as ANCOVA can be applied.
With the help of a statistical control, a researcher measures the effect of extraneous variable and adjusts its impact with a sophisticated statistical analysis.
8.7.4 Design Control
Design control suggests the use of an appropriate experimental design to control the effect of extraneous variable. Section 8.9 focuses on some special types of experimental designs with its specific features and limitations. A researcher can select an appropriate design on the basis of a careful evaluation of all the experimental designs.
Design control suggests the use of an appropriate experimental design to control the effect of extraneous variable.
8.8 LABORATORY VERSUS FIELD EXPERIMENT
Experimental research can be broadly classified into two categories: laboratory experiment and field experiment. The first type of experiment known as the laboratory experiment is conducted in a laboratory or artificial setting. A researcher applies or controls the experimental manipulation or treatment in an artificial environment. The laboratory experiment provides an opportunity to a researcher to measure the impact of many independent variables of experimental treatments on dependent variable, which otherwise will be an extremely expensive affair. In addition, bringing consumers into a contrived laboratory gives an opportunity to a researcher to control many extraneous variables. In some experiments, the researcher intends to achieve a higher level of internal validity, the laboratory experiment provides an opportunity to a researcher. So, the main advantage of a laboratory experiment lies in its ability to provide a higher level of internal validity in the experiment. The laboratory experiment also saves time and cost as compared with the field experiment. The major disadvantage of the laboratory experiment is the lack of natural setting in the experiment, and hence, the major concern of the external validity “generalizability” is really a matter of concern. As another matter of concern, in a laboratory experiment, a respondent attempts to guess the purpose of launching the experiment and tends to respond accordingly.
The laboratory experiment is conducted in a laboratory or artificial setting. A researcher applies or controls the experimental manipulation or treatment in an artificial environment.
A field experiment is conducted in the field or a natural setting. In the field experiment, the effect of experimental manipulation or independent variables on dependent variable is observed in a natural setting. In a field experiment, the respondents are usually unaware that they are being monitored under an experiment and hence tend to be very natural while responding. These experiments are conducted in fields and hence provide a high level of external validity. On the same ground, they do not provide high levels of internal validity. Generalization of experimental result is the biggest advantage of the field experiment. As discussed, the field experiments are organized in a natural setting and are more accurate in terms of applying experimental results in the real world. The major disadvantage of the field experiment is the presence of extraneous variables: it is not only their presence but also their control that is very difficult. In addition, the field experiments are cost inefficient and time consuming as compared with the laboratory experiment.
A field experiment is conducted in the field or a natural setting. In the field experiment, the effect of experimental manipulation or independent variables on dependent variable is observed in a natural setting.
The main objective of experimentation is to detect or confirm the causal relationship between the dependent variable and independent variables and quantify them. In every study, there is a trade-off between internal and external validity. In the early stages of the research, a researcher focuses on maximizing the internal validity to ensure the causal relationship. A marketing decision maker operates in the real world. So, early experimentation should be a field experimentation, and the external validity should be a matter of later concern.
In every study, there is a trade-off between internal and external validity.
8.9 EXPERIMENTAL DESIGNS AND their CLASSIFICATION
An experimental design is a sketch to execute an experiment where a researcher is able to control or manipulate at least one independent variable. The experimental designs can be broadly segregated into two groups: classical experimental designs and statistical experimental designs. Classical experimental designs consider the impact of only one treatment level of independent variable taken for the study at a time, whereas statistical experimental design considers the impact of different treatment levels of independent (explanatory) variable as well as the impact of two or more independent variables. On the basis of these two factors, the experimental designs can be broadly classified as pre-experimental designs, post-experimental designs, quasi-experimental designs, and statistical experimental designs. The first three designs can be placed under the classical experimental design category and the last one can be placed under the statistical experimental design. Figure 8.1 presents a classification of the experimental designs.
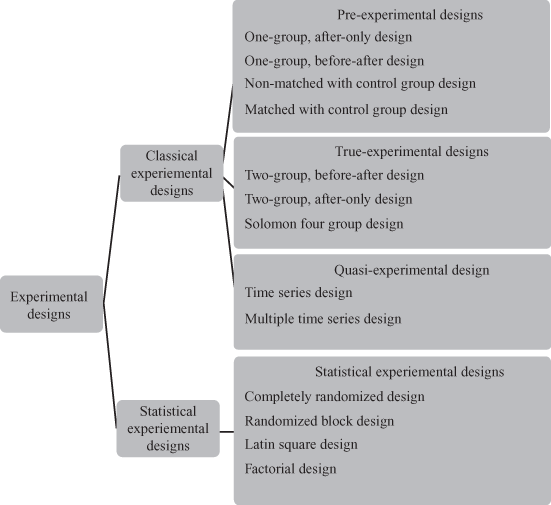
Figure 8.1 A classification of experimental designs
An experimental design is a sketch to execute an experiment where a researcher is able to control or manipulate at least one independent variable. The experimental designs can be broadly segregated into two groups: classical experimental designs and statistical experimental designs.
8.9.1 Pre-Experimental Design
Pre-experimental design is an exploratory type of research design and has no control over extraneous factors. These designs cannot be easily put under the category of the experimental designs, because these are not able to establish the cause and effect relationship. These designs are exploratory in nature and are mainly used to frame the hypotheses about the casual relationship and that is why a detailed description of these designs is of paramount importance. Hence, these designs are mainly applied for developing causal relationship hypotheses and not for testing the hypotheses. In addition to this design, further research should be executed to make the researcher firm about the casual relationship between variables. There are four commonly used pre-experimental designs. These are one-group, after-only design; one-group, before-after design; non-matched with control group design, and matched with control group design.
Pre-experimental design is an exploratory type of research design and has no control over extraneous factors.
8.9.1.1 One-Group, After-Only Design
One-group, after-only design is the most basic experimental design. One-group, after-only experimental design involves the exposure of single group test unit to a treatment X and then taking a single measurement on the dependent variable (O). For example, a consumer electronics company has launched a heavy advertisement campaign for 2 months. The experiment may be to measure the impact of the advertisement on “purchase intention” of the consumers. Symbolically, this design can be represented as
One-group, after-only experimental design involves the exposure of single group test unit to a treatment X and then taking a single measurement on the dependent variable (O).
![]()
This design does not provide some valid conclusions due to various problems attached. First, it is not very clear when the experiment group will not be present. Second, the observation may be affected by various extraneous variables like history, maturation, selection, and mortality. In this design, a researcher has a very little control over the impact of various extraneous variables, and hence, this design is mainly used for the exploratory research and not for the conclusive research.
8.9.1.2 One-Group, Before-After Design
One-group, before-after design involves testing the test units twice. The first observation is made without exposing the test units to any treatment, and the second observation is made after exposing the test unit to treatment. As obvious, first observation is symbolized by O1, and second observation is symbolized by O2. The treatment effect can be determined as the difference between the first observation and the second observation, that is, O1 − O2. For example, a company is facing problems due to “low morale” of the employees. For boosting the morale of the employees, the company has organized a 1-week special training programme. Before measurement is the measurement of morale before the training programme. After measurement can be noted after introducing the treatment in terms of providing the training programme. The difference between the measurement before and after the treatments can be computed. Symbolically, this design can be represented as
![]()
Uncontrolled extraneous variables put the validity of inferences drawn under question mark. “Before measure” may be one of the serious threats, because the respondent group is aware that they are being monitored for the research purpose. Hence, the tendency of giving socially desirable answer may increase. “Mortality impact” may also be one of the problems, because in the second phase of the experiment, some respondents who participated in the first phase will not participate. This design involves a third problem in terms of handling “instrumentation impact.” This bias can occur in terms of wording the questions in the second phase of the interview or the interviewer may change in the second phase of the interview.
One-group, before-after design involves testing the test units twice. The first observation is made without exposing the test units to any treatment, and the second observation is made after exposing the test unit to treatment.
8.9.1.3 Non-Matched With Control Group Design
Non-matched with control group design involves the introduction of control group in the experiment. This group does not receive any experimental treatment. In this design, the control group is introduced, so that it can be compared with the experimental group. The treatment effect can be determined as the difference between the observations from the experimental group that receives the treatment (O1) and the observations from the control group that receives no treatment (O2). Hence, the result of interest is O1 − O2. For example, to measure the impact of the advertisement, the discussed consumer electronics company may compare the measurement with the group of respondents who have not received any treatment. Symbolically, this design can be represented as
![]()
Note that this experimental design is also not able to address two extraneous variables: selection and mortality. Selection bias may appear as the control group may have many characteristics that may not be present in the experimental group but may have serious impact on the experiment. The selection bias may become serious when self-selection occurs in an experiment. It means, members of the experimental group are voluntarily participating in the experiment and are in better condition before the experiment as compared with the members of the control group, who are not voluntarily participating in the experiment. Mortality impact may also be one of the problems as more test units can withdraw themselves from the experimental group as compared with the control group.
Non-matched with control group design involves the introduction of control group in the experiment. This group does not receive any experimental treatment. In this design, the control group is introduced, so that it can be compared with the experimental group.
8.9.1.4 Matched with Control Group Design
To address the problem of selection bias, matched with control group design involves the matching of experimental group and control group on the basis of some relevant characteristics. For example, in our example of measuring, the impact of the advertisement, a researcher can collect the data from both the experimental group and the control group, which are arranged on the basis of some relevant similar characteristic such as same income group or same age group. Symbolically, this design can be represented as
![]()
M indicates that experimental group and control group are matched on the basis of some relevant characteristics.
To address the problem of selection bias, matched with control group design involves the matching of experimental group and control group on the basis of some relevant characteristics.
8.9.2 True-Experimental Design
Most of the problems of the pre-experimental design (discussed in the previous section) can be tackled with the help of randomization procedure. “Randomization” is the key of difference between pre-experimental design and true experimental design. The randomized experiments are more likely to yield unbiased estimates of causal effects than typical observational studies, because the randomization of treatment makes the treatment and control groups equal on average in terms of all (observed and unobserved) characteristics.8 True experimental design involves the random assignment of test units to the experimental group and various treatments to the experimental groups. This random assignment provides an opportunity to neutralize the impact of extraneous variables in the experiment. True experimental designs are commonly classified as two-group, before-after design; two-group, after-only design; and Solomon four-group design. Following section provides a discussion of these three true experimental designs.
“Randomization” is the key of difference between pre-experimental design and true experimental design.
8.9.2.1 Two-Group, Before-After Design
Two-group, before-after design is also known as pre-test–post-test control group design. This design involves the random assignment of test units to either the experimental group or the control group. For example, a firm has launched a new advertisement campaign. The firm would like to assess the impact of this new advertisement campaign. A sample of consumers is selected randomly and half of the consumers are randomly assigned to experimental group and other half to the control group. Symbolically, two-group, before-after design can be represented as
The two-group, before-after design is also known as pre-test–post-test control group design. This design involves the random assignment of test units to either the experimental group or the control group.
![]()
For determining the impact of treatment, the difference between O1 and O2 is compared with the difference between O3 and O4. The experimental group is treated with both the experimental treatment and extraneous variable. The control group is treated with extraneous variable only and not with the experimental treatment. Let the impact of experimental variable be EV and impact of extraneous variable be UV. Hence, the impact of the experimental treatment can be computed as

This calculation incorporates all extraneous variables such as history, maturation, testing effect, statistical regression, and instrument variation. Selection bias is well taken care of by randomly assigning units (or treatments) to experimental group or control group. If some respondents refuse to participate, then this design will also suffer from mortality impact.
8.9.2.2 Two-Group, After-Only Design
Two-group, after-only design is similar to the matched with control group design with one difference in terms of assignment of units (or treatments) to experimental group and control group in a random manner. Two-group, after-only design can be symbolically represented as
![]()
This design is mainly susceptible to two extraneous variables: selection bias and mortality. This design is based on the assumption that the experimental group and control group are similar in terms of pre-treatment measures on the dependent variable. This is because of random assignment of test units to groups. In the absence of any pre-treatment measures, this assumption cannot be verified. As discussed, mortality is always a probable concern of this design. Mortality can exist because a researcher is not very sure that the participants who leave the experimental group are similar to those who leave the control group.
Two-group, after-only design is similar to the matched with control group design with one difference in terms of assignment of units (or treatments) to experimental group and control group in a random manner.
8.9.2.3 Solomon Four-Group Design
To handle the problems of two supplement groups, before-after design is supplemented by an after-only design and is referred to as Solomon four-group design. This design is also known as four-group-six-study design. The Solomon four-group design is symbolically represented as
To handle the problems of two supplement groups, before-after design is supplemented by an after-only design and referred to as Solomon four-group design. This design is also known as four-group-six-study design.

This design is rarely used because of its expensive and time consuming nature. Though this design provides various comparison measures of the experimental treatment (X), these comparison measures may be (O2 − O1) − (O4 − O3), (O6 − O5), (O2 − O4). An agreement among these measures makes the inference strong. In case of no agreement, it is still possible to measure the interaction and before measure effects [(O2 − O4) − (O5 − O6)].
8.9.3 Quasi-Experimental Designs
In quasi-experimental design, a researcher lacks full control over the when and whom part of the experiment and often non-randomly selects the group members. When the researcher lacks control over these experimental stimuli, the design is regarded as quasi experimental.9 The quasi-experimental designs are useful because these are less expensive and they save time. These designs can also be used when true experimental designs cannot be used. The widely used quasi-experimental designs are time series designs and multiple time series designs.
In quasi-experimental design, a researcher lacks full control over the when and whom part of the experiment and often non-randomly selects the group members.
8.9.3.1 Time Series Designs
Time series designs are like one-group, before-after design except that the periodic measurement is employed on the dependent variable for a group of test units. In the time series designs, treatments are either administered by the researcher or it occurs naturally. Measurement continues after the treatment for the impact of treatment effect. Symbolically, the time series design can be represented as
Time series designs are like One-group, before-after design except that the periodic measurement is employed on the dependent variable for a group of test units. In the time series designs, treatments are either administered by the researcher or it occurs naturally.
![]()
From this display, it can be well inferred that the observations are made on a group of test units over time. Then the experimental treatment is introduced, and the reaction of test units to experimental treatment is again observed. In the time series experiment, a researcher has repeated assess to test units. However, the researcher has no control over the exposure schedule of experimental treatment to the test units, though he or she has a control over the time schedule of measurement for measuring the impact of experimental treatment. Figure 8.2 exhibits sales of different companies as measurement before-treatment exposure and after-treatment exposure.
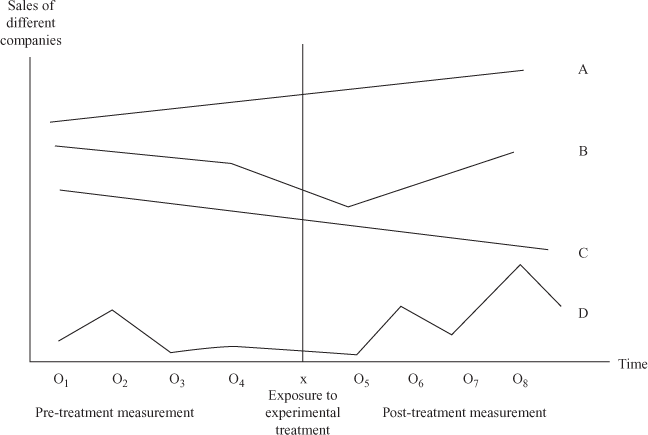
Figure 8.2 Time series design
By taking observations before and after the treatment, a researcher can have partial control over the extraneous variables. Selection bias can be reduced by selecting the test units randomly. Maturation can be partially checked because its impact is not valid for O5 and O4 but valid for all other observations. Similar argument can be raised to control the extraneous variables like instrumentation and statistical regression. Mortality can be tackled by offering some incentives to respondents.
8.9.3.2 Multiple Time Series Designs
In a multiple time series design, another group of test units is incorporated to serve as a control group. This design may be a better alternative as compared with the time series designs subject to a cautious selection of the control group. Multiple time series design can be symbolically represented as
In a multiple time series design, another group of test units is incorporated to serve as a control group. This design may be a better alternative as compared with the time series designs subject to a cautious selection of the control group.
![]()
8.9.4 Statistical Experimental Designs
Statistical experimental designs involve the conduction of a series of experiments to statistically control the extraneous variables and to measure the impact of multiple independent variables. As different from the classical experimental designs, statistical experimental designs allow a researcher to examine the impact of different treatment levels of the experimental variable. These designs also provide an opportunity to determine the impact of two or more independent variables. The most widely and commonly used statistical designs are completely randomized design, randomized block design, Latin square design, and factorial design.
Statistical experimental designs involve the conduction of a series of experiments to statistically control the extraneous variables and to measure the impact of multiple independent variables.
The most widely and commonly used statistical designs are completely randomized design, randomized block design, Latin square design, and factorial design.
8.9.4.1 Completely Randomized Design
In a completely randomized design, the experimental treatments are randomly assigned to the test units. By randomly assigning treatments to the test units, a researcher tries to check the impact of extraneous variables through manipulation of the treatment variable. For example, a company wants to ascertain the impact of three different price levels on target consumers. The company has taken a random sample of 3000 similar customers and divided them in three randomly constructed groups named as Experimental Groups 1, 2, and 3. The experiment can be symbolically represented as
In a completely randomized design, the experimental treatments are randomly assigned to the test units.

where X1 is the first experiment treatment level. The term “level” refers to the different forms of same independent variable. Similarly, X2 and X3 are the second and third experimental levels, respectively. In our example, X1, X2, and X3 are the three different levels of price. The focus of experiment is to compare the effect of three experimental treatments. The statistical technique applied to analyse the result of this type of experimental design is known as “Analysis of Variance” commonly known as ANOVA.
8.9.4.2 Randomized Block Design
Randomized block design involves in random assignment of treatments to the experimental group and control group. A randomized block design is useful when there is one major external variable, such as sales, store size, or income of the respondent that might influence the dependent variable.10 For using the randomized block design, a researcher splits the test units into similar groups or blocks in light of the external variable such as sales, age, gender, income, experience, occupation, or any other variable that is believed to impact the test units or dependent variable. The purpose of blocking is to make sure that the experimental group and control group are matched closely on the external variable. In fact, the randomized block design is a combination of randomization and matching. Thus, control variable defines groups and the randomized experiment is conducted within each group. A randomized block design can be symbolically represented as
Randomized block design involves in random assignment of treatments to the experimental group and control group.

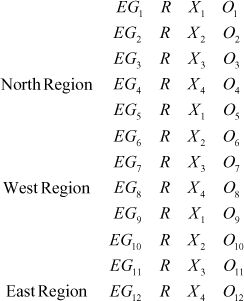
For understanding the concept of randomized block design, let us take a simple example of a company that considers the difference in sales in four different “price levels”. It is also believed by the company that the geographic regions may also have an impact on the sales. The company has identified three regions of the country, which may provide the difference in sales namely the north region, west region, and east region. In a randomized block design, the treatment assignment to each block of the design is a random process. In our example, four treatments in terms of four different “price levels” are randomly assigned to different cities within each region. The sales (in thousands) results are exhibited in the Table 8.2.
Table 8.2 Randomized block design
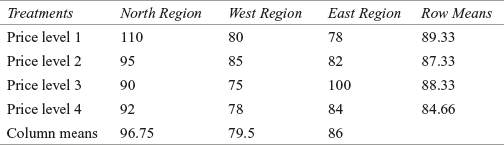
The research question may be do the regions significantly differ in terms of generating sales. The second question may be do the price levels significantly differ in terms of generating sales. This example can be symbolically represented as
8.9.4.3 Latin Square Design
We have already discussed that a randomized block design is useful when there is one major external variable, such as sales, store size, or income of the respondent that might influence the dependent variable. Latin square design allows a researcher to control two external variables (non-interacting) along with the manipulation of independent variable. In Latin square design, the test units are grouped according to the two external variables considered in the study. The test units are systematically blocked in two directions provided by two external variables. As different from the randomized block design, in a Latin square design, if we have four treatment levels then we must have four rows and four columns. In the randomized block design example, three different regions provided the basis for difference in sales. Let us assume that another external variable “size of the showroom” may provide the basis for difference in quarterly sales (in million rupees) of the company. In addition, the company has also considered one more region “south region” as the basis for difference in sales volume. The company has four different sizes of showrooms across the country. So, the design based on the two external variables “different regions” and “size of the showroom” will appear as shown in Table 8.3.
Table 8.3 Latin square design
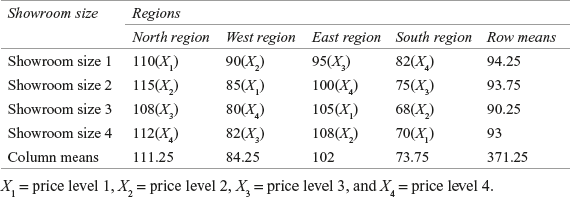
Latin square design allows a researcher to control two external variables (non-interacting) along with the manipulation of independent variable.
Treatments (levels of independent variable) are applied to the cells in such a way that each level of independent variable is applied to each cell only once as exhibited in Table 8.3. In Latin square design, each cell is treated with only one treatment level.
8.9.4.4 Factorial Design
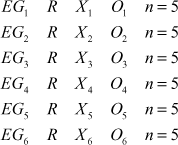
In many scientific investigations, the main interest is in the study of effects of many factors simultaneously. Factorial designs, especially the two- or three-level factorial designs, are the most commonly used experimental plans for this type of investigations.11 In the statistical designs discussed so far, the effect of only one independent (experimental) variable on dependent variable was studied. In a factorial design, two or more experimental variables are simultaneously considered. In a factorial experiment, more than one type of independent variables are varied at a time but in a structured way12; for example, a fast moving consumer goods company wants to test a new product in 30 cities. Three different customer groups with respect to income: high-income group, middle-income group, and low-income group are to be tested. In addition, two price levels: high price and moderate price are considered in the experiment. Hence, this will be 3 × 2 factorial, as there are three different levels of income and two different treatment levels. So, this design will have the following six experimental groups:
In a factorial design, two or more experimental variables are simultaneously considered.
X1 = High-income group; high price
X2 = High-income group; moderate price
X3 = Middle-income group; high price
X4 = Middle-income group; moderate price
X5 = Low-income group; high price
X6 = Low-income group; moderate price
Thus, the factorial design can be symbolically represented as
The effect of each independent variable on dependent variable is referred to as the main effect. Hence, the impact of “different income levels” on sales and “price levels” on sales is termed as the main effect. Factorial design also allows a researcher to determine the impact of interaction of independent variables on dependent variables. Interaction takes place when the simultaneous effect of two or more experimental variables is different from the sum of their separate effect. For our example, the factorial design will look like as exhibited in Table 8.4.
Table 8.4 Factorial design
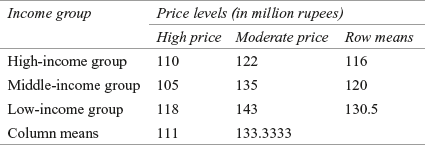
Thus, in one experiment, the effect of two experimental variables can be determined. The main problem with the factorial design appears with the increase in the number of treatment variables as it makes the design complicated. However, it is often too costly to perform a full factorial experiment, so a fractional factorial design, which is a subset or fraction of a full factorial design, is preferred because it is cost effective.13
8.10 LIMITATIONS OF EXPERIMENTATION
Experimentations have become very popular because they develop a causal relationship between variables, which is otherwise vague in nature. Although experimentations are popular, there are few limitations such as time, cost, secrecy, and implementation problems.
8.10.1 Time
Most of the decision makers in business research face the problem of having shortage of time to launch a time-consuming experiment and wait for a long time to complete the experiment. Because of various factors such as the competitive nature of the market, experiments cannot be launched for an unlimited time instead they are framed in light of the time span available to a researcher, which is ultimately decided by the decision maker.
Because of various factors such as competitive nature of the market, experiments cannot be launched for an unlimited time instead they are framed in light of the time span available to a researcher, which is ultimately decided by the decision maker.
8.10.2 Cost
Cost is another constraint in performing an experiment. As discussed, the application of various treatments to the experimental group and control group is an affair that requires huge investment in running and completing experimentation. For achieving higher levels of internal and external validity, higher expenses are required. There is also a possibility that the cost of the experiment may be very high, but it leads to some inaccurate results resulting in non-implementable implications.
Cost is another constraint in performing an experiment.
8.10.3 Secrecy
In any field research, it is not possible for a researcher to hide the intentions of launching a research programme. So, when secrecy is desired by a decision maker, it is not possible in a field experiment. When secrecy is also an objective of a researcher or a decision maker, a simulation or a carefully performed laboratory experiment is a feasible alternative.
When secrecy is also an objective of a researcher or a decision maker, a simulation or a carefully performed laboratory experiment is a feasible alternative.
8.10.4 Implementation Problems
The execution of experiments is always a difficult problem to handle. Getting cooperation from the persons involved in the experiment like sales executives, retailers, and wholesalers is very difficult. They are having their own reasons and justifications for not cooperating. The second problem occurs when the subjects of the experimental group develop a communication with the subjects of the control group. Sometimes, finding a control group also becomes very difficult in experimentation. This is particularly possible when there are only few buyers of the product (e.g. a big weighing machine), and they often communicate with each other. Presence of competitors is also a problem in executing an experiment effectively.
The execution of experiments is always a difficult problem to handle. Getting cooperation from the persons involved in the experiment like sales executives, retailers, and wholesalers is very difficult.
8.11 TEST MARKETING
Test marketing means conducting an experiment in a field setting. Companies generally launch test market strategy in selected parts of the market referred to as the test markets. Once able to determine the relationship between independent variable(s) and dependent variable, a national marketing strategy can be adopted by the company. Test marketing is mainly adopted for two important reasons. First, a company will like to determine the sales potential of newly launched product and second, to identify the variations in the marketing mix of a product or services. Test market is a very expensive and time-consuming activity. It is not easy for a producer to launch the new product in a selected area, as it requires million rupees investment. Although many argue the rational of using the test market strategy, it is an extremely useful marketing strategy. Test market also provides an opportunity to the producer to have an input about the consumer and supply chain reaction about the introduction of a new product. Experimental launching of new products is intended to expose problems that otherwise would be undetected until full-scale introductions are underway.14 Test markets are generally classified into four types: standard, controlled, electronic, and simulated. Brief descriptions of these types are given below.
Test marketing means conducting an experiment in a field setting.
8.11.1 Standard Test Market
In standard test market, a company uses its own distribution channel network to test a new product or market mix variables. The main advantage of this type of test marketing can be explained by the fact that it allows a decision maker to evaluate the impact of new product or marketing mix under normal marketing conditions. Although standard test marketing is a time- and cost-consuming process, it provides an opportunity to a marketer to observe the product behaviour in true marketing environment. When a product is launched through standard test market technique, the competitors immediately get an opportunity to assess the marketing strategies of the company that has used the standard test market option. The competitors have been known to take deliberate retaliatory actions to disrupt another firm’s test markets, which makes it extremely difficult to untangle the results even by complex model based analysis.15 Test duration is a subjective matter that largely depends upon time and cost consideration for the company, probably competitor and consumer response, and many other factors.
In standard test market, a company uses its own distribution channel network to test a new product or market mix variables. The main advantage of this type of test marketing can be explained by the fact that it allows a decision maker to evaluate the impact of new product or marketing mix under normal marketing conditions.
8.11.2 Controlled Test Market
In controlled test market, a company hires an outside research agency to conduct the study. As compared with the standard test market procedure, this method is less expensive and less time consuming. During the test, the research agency handles the retailer’s sale and all other distribution-related activities. The agency also provides the incentives and has a control over the inventory issues. In many cases, data are collected through electronic scanning devices, so that repeat purchase, household penetration, demographics of the consumers, and other buyer related information as well as information related to the first year sales volume are generated.
In controlled test market, a company hires an outside research agency to conduct the study. As compared with the standard test market procedure, this method is less expensive and less time consuming.
8.11.3 Electronic Test Market
An electronic test market gathers data from the consumers who agree to carry an identification card that they present when buying goods and services at participating retailers in the selected cities.16 The main advantage of this type of test market is the collection of demographic and other purchase behaviour information becomes very easy. On the other hand, the identification card-carrying consumers may not be the true representatives of the whole market as the card-carrying consumers are not being selected randomly.
An electronic test market gathers data from the consumers who agree to carry an identification card that they present when buying goods and services at participating retailers in the selected cities.
8.11.4 Simulated Test Market
Simulated test market is an artificial technique of test marketing. A simulated test market occurs in a laboratory, where the potential consumers of a particular product are exposed to a new product or competitive product or any other marketing stimuli. Simulated test market is a technique to determine a consumer’s response for a product in a limited time period. Simulated test market uses an artificial setting, where a researcher selects the potential consumers and asks questions related to various features of the product to assess the product’s behaviour, when it will be launched in full market. Simulated test marketing is a valid methodology that has been used by the marketing community since the 1960s to forecast the purchase interest of new products and new positioning for existing products.17 The major advantage of simulated test market is that it is less expensive and less time consuming. In addition, to maintain the secrecy about a company’s marketing strategy it is also possible to use simulated test market.
Simulated test market is an artificial technique of test marketing. A simulated test market occurs in a laboratory, where the potential consumers of a particular product are exposed to a new product or competitive product or any other marketing stimuli.
Endnotes |
1. Tull, D. and D. Hawkins (1984). Marketing Research: Measurement and Method, 3rd ed. New York, NY: Macmillan.
2. Hobbs, J. R. (2005). “Toward a Useful Concept of Causality for Lexical Semantics”, Journal of Semantics, 22(2): 181–209.
3. Cavazza, M., J. Lugrin and M. Buehner (2007). “Causal Perception in Virtual Reality and its Implications for Presence Factors”, Presence: Teleoperators & Virtual Environment, 16(6): 623–42.
4. Anderson, C. A. and B. J. Bushman (1997). “External Validity of ‘Trivial’ Experiments: The Case of Laboratory Aggression”, Review of General Psychology, 1(1): 19–41.
5. Zikmund, W. G. (2007). Business Research Methods, 7th ed., pp. 273–274. South-Western Thomson Learning.
6. Parasuraman, A., D. Grewal and R. Krishnan (2004). Marketing Research, p. 242. Boston, NY: Houghton Mifflin Company.
7. Imai, K., G. King and C. Nall (2009). “Rejoinder: Matched Pairs and the Future of Cluster-Randomized Experiments”, Statistical Survey, 24(1): 65–72.
8. Horiuchi, Y., K. Imai and T. Taniguchi (2007). “Designing and Analyzing Randomized Experiments: Application to a Japanese Election Survey Experiment”, American Journal of Political Science, 51(3): 669–87.
9. Shao, A. T., (2002). Marketing Research: An Aid to Decision Making, 2nd ed., p. 303. South-Western Thomson Learning.
10. Malhotra, N. K. and S. Dash (2009). Marketing Research: An Applied Orientation, 5th ed., p. 236. India: Dorling Kindersley Pvt. Ltd.
11. Xu, H., F. K. H. Phoa and W. K. Wong (2009). “Recent Developments in Nonregular Fractional Factorial Designs”, Statistical Surveys, 3: 18–46.
12. Shaw, R., M. F. Festing, I. Peers and L. Furlong (2002). “Use of Factorial Designs to Optimize Animal Experiments and Reduce Animal Use”, ILAR Journal, 43(4): 223–32.
13. Xu, Op.Cit., p. 178.
14. Silk, A. J. and G. L. Urban (1978). “Pre-Test Market Evaluation of New Packaged Goods: A Model and Measurement Methodology”, Journal of Marketing Research, 15(2): 171–91.
15. Urban, G. L. (1970). “SPRINTER Mod III: A Model for Analysis of New Frequently Purchased Consumer Products”, Operation Research, 18(3): 805–53.
16. Hair, J. F., R. P. Bush and D. J. Ortinau (2002). Marketing Research: Within a Changing Information Environment, p. 318. Tata McGraw-Hill Publishing Company Limited.
17. Clancy, K. J., P. Kreig and M. M. Wolf (2005). Market New Product Successfully, p. 318. New York, NY: Rowman & Littlefield.
SUMMARY |
Experiments can be defined as the systematic study where a researcher controls or manipulates one or more independent (experiment) variables to test a hypothesis about the independent variable. Independent variables are the variables that are manipulated or controlled by the researcher. On the other hand, dependent variables are variables on which a researcher has little or no control over the research process, but the researcher is keen to note a change in it with the corresponding change in the independent variables. Experiments are based on the concept of causality. In fact, causality is a conditional phenomenon between variables in the form “if x, then y.” There exist four formal conditions for causality. These are covariation, time order of occurrence of variable, systematic elimination of other causal variable, and experimental designs.
Internal validity indicates that the manipulation in experimental treatment or independent variable causes observed effect on the dependent variable. Problems of external validity generally relate to the possibility that a specific but time-limited set of experimental conditions may not deal with the interpretations of untested variables in the real world. Some extraneous variables seriously jeopardize internal validity of the experiment. These extraneous variables are history, maturation, testing, instrumentation, statistical regression, selection bias, and mortality. There are four biases that seriously jeopardize the external validity of an experiment. These four factors are reactive effect, interaction bias, multiple treatment effect, and non-representativeness of the samples. The four ways to control the extraneous variable are randomization, matching, statistical control, and design control.
Experimental research can be broadly classified into two categories: laboratory experiment and field experiment. Laboratory experiment is conducted in a laboratory or artificial setting. A field experiment is conducted in the field or a natural setting. An experimental design is a sketch to execute an experiment, where a researcher is able to control or manipulate at least one independent variable. Experimental designs can be broadly segregated into two groups: classical experimental designs and statistical experimental designs. Classical experimental design considers the impact of only one treatment level of independent variable taken for the study at a time, whereas statistical experimental design considers the impact of different treatment levels of independent (explanatory) variable as well as the impact of two or more independent variables. On the basis of these two factors, the experimental designs can be broadly classified into pre-experimental designs, post-experimental designs, quasi-experimental designs, and statistical experimental designs. The first three designs can be placed in the classical experimental design category and the last one under the category of statistical experimental design.
Experimentations have become very popular because they develop a causal relationship between the variables, which is otherwise vague in nature. Although experimentations are popular, there are few limitations such as time, cost, secrecy, and implementation problems. Test marketing means conducting an experiment in a field setting. Test markets are generally classified in four types: standard, controlled, electronic, and simulated.
KEY TERMS |
Causality, 167
Classical experimental designs, 173
Completely randomized design, 179
Controlled test market, 184
Covariation, 167
Dependent variables, 167
Design control, 172
Electronic test market, 184
Experimental designs, 167
Experiments, 167
External validity, 168
Extraneous variables, 172
Factorial design, 181
Field experiment, 173
History, 169
Implementation problems, 183
Independent variables, 167
Instrumentation, 170
Interaction bias, 171
Laboratory experiment, 172
Latin square design, 181
Matching, 172
Matched with control group design, 176
Maturation, 169
Mortality, 170
Multiple time series design, 179
Multiple treatment effect, 171
Non-matched with control group design, 175
Non-representativeness of the samples, 171
One-group, after-only design; 174
One-group, before-after design; 175
Post-experimental designs, 173
Pre-experimental design, 173
Quasi-experimental design, 177
Randomization, 172
Randomized block design, 179
Reactive effect, 171
Secrecy, 183
Selection bias, 170
Simulated test market 184
Solomon four-group design, 177
Standard test market, 184
Statistical control, 172
Statistical experimental designs, 179
Statistical regression, 170
Systematic elimination of other causal variable, 167
Testing, 169
Test marketing, 183
Time, 182
Time order of occurrence of variable, 167
Time series designs, 178
Two-group, after-only design, 177
Two-group, before-after design, 176
NOTES |
- 1. http://www.bergerpaints.com/profile.php, accessed September 2009.
- 2. Prowess (V. 3.1): Centre for Monitoring Indian Economy Pvt. Ltd, Mumbai, accessed September 2009, reprinted with permission.
- 3. http://economictimes.indiatimes.com/News/ News-By-Industry/Indl-Goods-/-Svs/Chem-/Fe…
DISCUSSION QUESTIONS |
- 1. What is experimentation and why is this important for conducting any business research?
- 2. What is causality? Explain the four formal conditions for causality?
- 3. What are internal and external validity in experimentation?
- 4. Explain the common threats to internal validity and external validity in an experiment.
- 5. How can a researcher control the threats to internal and external validity in an experiment.
- 6. What is the main difference between laboratory experiment and field experiment?
- 7. What are the various types of experimental designs available for a researcher to conduct research?
- 8. Write a short note on following terms:
a. Pre-experimental designs
b. Post-experimental designs
c. Quasi-experimental designs
d. Statistical experimental designs
- 9. Write a short note on following terms:
a. Two-group, before-after design
b. Two-group, after-only design
c. Solomon four-group design
- 10. Write a short note on following terms:
a. Time series design
b. Multiple time series design
- 11. Write a short note on following terms:
a. Completely randomized design
b. Randomized block design
c. Latin square design
d. Factorial design
- 12. What are the limitations of experimentation?
- 13. What is the concept of test marketing in business research? What are the different kinds of test markets?
CASE STUDY |
Case 8: Voltas Ltd: A Constituent of Tata Conglomerate
Introduction: Profile of Tata Group
Tata companies operate in seven business sectors: communications and information technology, engineering, materials, services, energy, consumer products, and chemicals. They are, by and large, based in India and have significant international operations. The total revenue of the Tata companies when taken together was $70.8 billion (around Rs 32,53,340 million) in the year 2008–2009. Almost 64.7% of the revenue comes from the business outside India and they employ 3,57,000 people worldwide. The name “Tata” is respected in India since 140 years for its adherence to strong values and business ethics. The major Tata companies are Tata Steel, Tata Motors, Tata Consultancy Services (TCS), Tata Power, Tata Chemicals, Tata Tea, Indian Hotels, and Tata Communications.1
Voltas Ltd: A Constituent of Tata Conglomerate
Voltas Ltd, a part of the Tata conglomerate, was incorporated in 1954. In 1951, the collaboration of Tata Sons Ltd with a Swiss firm Volkart Brothers formed “Voltas Ltd.” It is India’s premier air-conditioning and engineering service providers. Its operations are organized into four independent business specific clusters such as electro-mechanical projects and services, unitary cooling products for comfort and commercial use, engineering agency and services, and others. Voltas Ltd manufactures domestic and industrial air conditioners and refrigerators, commercial refrigerators, water coolers, freezers, forklift trucks, and large water supply pumps. It also undertakes engineering, procurement and construction projects, and electromechanical projects, specializing in heating, ventilation and air conditioning, building management and communication systems, power and lighting, water management, and pollution controls. Voltas Ltd is also actively engaged in the procurement and marketing of air conditioners, textile machinery, machine tools, mining and construction equipment, and industrial chemicals.2
Voltas Ltd suffered from some negative profit growth in two consecutive years 1996–1997 and 1997–1998. From the year 1999–2000, the company has not looked back exhibiting continuous growth in sales and profit after tax (Table 8.01). The table shows the sales and profit after tax of the company from 1994–1995 to 2008–2009.
Table 8.01 Sales and profit after tax (in million rupees) of Voltas Ltd from 1994–1995 to 2008–2009
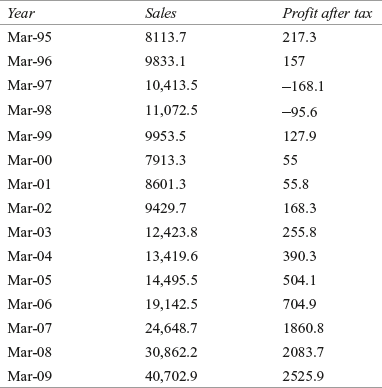
Source: Prowess (V. 3.1): Centre for Monitoring Indian Economy Pvt. Ltd, Mumbai, accessed September 2009, reprinted with permission.
Some Opportunities and Threats for All the Independent Business Clusters of the Company
Electro-mechanical projects and services business of the company may witness many opportunities and threats. Matured domestic market, energy efficient and environment friendly product, and focus on developing in-house manufacturing facility are some of the opportunities for electro-mechanical projects and services business of the company. Longer completion time frames for industrial and infrastructure project, intense competition due to planning of key international players setting up manufacturing facilities for greater cost effectiveness, currency fluctuations especially for the company’s operation in the middle east, and fluctuating price of the raw materials are some the threats for the company. While the commitment of engineering product and services segment of the company to projects in coal mining and development of new range of material-handling equipments may be seen as opportunities, the presence of major manufacturers at both global and domestic levels and shrinking sales may be some of the threats. In case of unitary cooling products for comfort and commercial use, reduction in excise duty, taxes and interest rates will act as stimulus for the air-conditioner and refrigeration projects. Awareness of Indian consumers about product and price benefits as well as their awakening to environmental concerns is in the favour of the company. Competitive market with the entry possibility of many national and multinational brands may be a threat to the company.2 The company has its own plan to utilize cater the opportunities and tackle the challenges of volatile environment of business. Relying on some of the model human resource philosophy and policy is one of the ways to counter the threats posed by the environment.
Human Resource Philosophy and Policy at Voltas Ltd
The cornerstone of Voltas Ltd’s human resource management philosophy is the conviction that the well-being of the company and its employees is interdependent, and the most valuable asset for the company is its employees. The company emphasizes on its commitment: to employ the most competent, on the basis of merit; to ensure that every employee is treated with dignity and respect, and in a fair, consistent and equitable manner; to create a stimulating, enabling and supportive work atmosphere and to aid and encourage employees in realizing their full potential.3 The company’s focus on improved employee engagement and ushering in a proactive work culture, through several enterprise level initiatives, have been noteworthy. The employee-contact programmes have helped to obtain valuable feedback and to implement appropriate action plans. The company continues to place emphasis on the enhancement of skills and capabilities of its employees for meeting the future challenges. The key areas of human resource development are training, competency development, and skill enhancement. Career development plans have been evolved for high-potential managers. In addition, the company continued to impart training to its employees, with a major focus on leadership development and managerial effectiveness. A number of internal and external training workshops, courses, and seminars were conducted and an elaborate induction-training programme for fresh graduate engineers, at the entry level, is arranged.2
Assume Voltas Ltd wants to attract most talented individuals from the job market, then before going for a wide range of recruitment programme, the company wants to assess its image as “employee friendly” through a well-structured research programme. Suppose the company has appointed you as a business researcher. Answers to the following questions would help the company to bring out a successful programme: How a pilot test will be conducted? How will you be using the experimentation? Will it be field experiment or a laboratory experiment? What will be the base of classifying the experimental design? How will you be addressing the issues related to internal and external validity of the experiment? How will you decide about the list of relevant variable to be included in the research study? Explain the strategies to control the environment and extraneous variables. What will be the limitations of the experimentations?
NOTES |
- 1. http://www.tata.com/aboutus/sub_index.aspx? sectid=8hOk5Qq3EfQ=, accessed September 2009.
- 2. Prowess (V. 3.1): Centre for Monitoring Indian Economy Pvt. Ltd, Mumbai, accessed September 2009, reprinted with permission.
- 3. http://www.voltas.com/new/corporate/philosophy.html, accessed September 2009.