
Chapter 9
Fieldwork and Data Preparation
Learning Objectives
Upon completion of this chapter, you will be able to:
- Understand the importance of fieldwork in conducting research
- Understand the steps in fieldwork process
- Understand the meaning and importance of data preparation process
- Understand the steps of data preparation process
- Get a preliminary idea about the tools and techniques of data analysis
RESEARCH IN ACTION: ESCORTS LTD
The Escorts Group is India’s leading conglomerates operating in the high-growth sector of the agri-machinery, construction and material-handling equipment, railway equipment, and auto-components. Escort facility has already provided over a million tractors and more than 16,000 construction and material-handling equipments to its highly satisfied customer base. Technology and business collaborations with world leaders over the years, globally competitive engineering capabilities, more than 1600 sales and services outlets, and footprints in more than 40 countries have been instrumental in making Escorts an Indian Multinational.1 Table 9.1 lists sales, net income, and profit after tax of Escorts Ltd from 1994–1995 to 2008–2009.
TABLE 9.1 Sales, net income, and profit after tax (in million rupees) of Escorts Ltd from 1994–1995 to 2008–2009
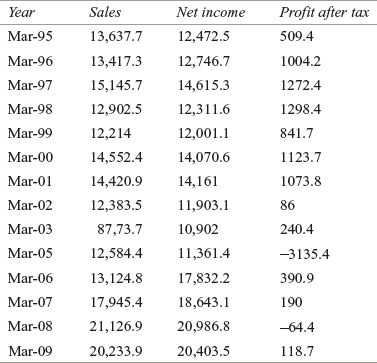
Source: Prowess (V. 3.1): Centre for Monitoring Indian Economy Pvt. Ltd, Mumbai, accessed September 2009, reprinted with permission.
There is an increase in the demand for food grains and agricultural products, which is a good opportunity for the company to strengthen its core business. Auto-component market is growing fast and the company has a solid preparation to meet the pace in the market. Modernization plans of the Indian Railway present opportunities to the Railway equipment manufacturing wing of Escorts Ltd. Growth in infrastructure and construction industry also presents opportunities for Escorts Construction Equipment Ltd, a 100% subsidiary of Escorts Ltd. Material-handling equipment business is also growing, specifically road construction equipment segment. Escorts Ltd is ready to explore the opportunities present in the environment.
The company suffered from negative profit after tax in some of the financial years. Situation changed in the year 2008–2009 when the company incurred profit after tax of Rs 118.7 million (Table 9.1). Motivated by the turnaround in profit, Escorts Ltd has set an ambitious plan to achieve over billion dollar turnover by 2012. Joint Managing director of Escorts Ltd optimistically stated that “Our mission 2012 is to have a top line between Rs 55,000 million and Rs 60,000 million, to come from the three core business area.” In the financial year 2008–2009, the company had made a turnaround profit after tax of Rs 118.7 million. Mr Nikhil Nanda highlights the strategy of this turnaround stating that “This profitability was achieved on the back of the improved earnings, structural recognition and greater cost and operational efficiencies”.2
Assume that to meet the preparation of achieving ambitious target of having over billion dollar turnover by 2012, Escorts wants to assess “purchase intentions” of the consumers with specific reference to a comparison between the “brand equity” of Escorts and other competitors. Suppose the company has organized a well-structured research programme and is at the stage of deciding about the strategy of launching fieldwork. How will the company decide about the initial contact, the way of asking questions from the respondents, recording the responses, and winding up the interviews? Who will be supervising the fieldwork? How will the company be organizing validation and evaluation of the fieldwork? This chapter presents a roadmap to provide all such type of information and focuses on fieldwork and data collection process in a well-organized manner.
9.1 INTRODUCTION
Researchers generally collect business research data by means of two options. The researcher can either develop his or her own set-up to generate data from the field or with help of fieldwork agencies. These agencies charge an amount, do the fieldwork, and provide data to the researcher. In business research, the fieldwork is an important process and requires a systematic approach. It is the most exciting part of the research that really provides an opportunity to a researcher to have a new thinking and a new way to look at various things. It is just not a simple phenomenon, as commonly perceived by many people. A number of problems arise when researchers send out questionnaires.1 Fieldwork is a challenging job, and these challenges are glaringly apparent when fieldwork scope crosses the national boundaries. In an unfamiliar cross-cultural or transitional socialist context, these challenges range from the application for research visas to request for official data, and the negotiation of relationships with local host institutions and “gatekeepers”.2 More or less fieldwork is a specialized technical job and requires a lot of technical expertise. Since the fieldwork context is not considered as known in advance or predictable, but something to be directly experienced by the researcher before any decoding or explanation is possible, the ultimate value of ethnographic enquiry cannot be known in advance.3 Fieldwork is a part of the research, which is not directly controlled by the researcher. Many aspects such as behaviour of a fieldworker, behaviour and cooperation of a respondent, and so on may not be under direct control of the researcher. The importance of field interviews in conducting scientific research cannot be undermined. Field interviews are excellent in providing detailed explanations of best practices and deep understanding of the theory developed.4 Hence, an effective planning and beyond that an effective execution of the planning is required by the researcher, and this part of the research should be taken up seriously.
Fieldwork is a challenging job and these challenges are glaringly apparent when fieldwork scope crosses the national boundaries.
9.2 FIELDWORK PROCESS
Systematic fieldwork is performed using the following seven steps: job analysis, job description, and job specification; selecting fieldworkers; providing training to fieldworkers; briefing and sending fieldworkers to field for data collection; supervising the fieldwork; debriefing and fieldwork validation; and evaluating and terminating fieldwork. Figure 9.1 shows the process of fieldwork.
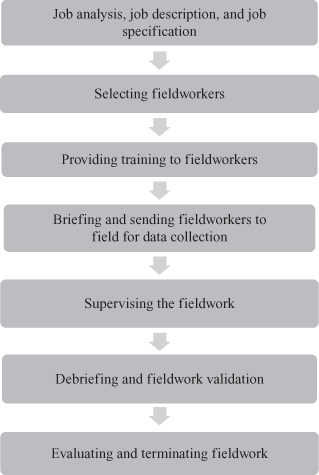
Figure 9.1 Seven steps in executing fieldwork
Systematic fieldwork is performed using the following seven steps: job analysis, job description, and job specification; selecting fieldworkers; providing training to fieldworkers; briefing and sending fieldworkers to field for data collection; supervising the fieldwork; debriefing and fieldwork validation; and evaluating and terminating fieldwork.
9.2.1 Job Analysis, Job Description, and Job Specification
Job analysis focuses on different aspects of a job to recruit a suitable person. Job analysis involves assessment of time to complete the job, tasks that can be grouped to constitute a job, job engineering to enhance job holder’s performance, required behaviour to perform a job, and identifying individual personality traits to perform a job. It produces information on the job requirements, which is then used in developing job description (a list of what the job entails) and job specification (a list of the job’s human requirements or the kind of people to be hired for the job5).
Job analysis involves assessment of time to complete the job, tasks that can be grouped to constitute a job, job engineering to enhance job holder’s performance, required behaviour to perform a job, and identifying individual personality traits to perform a job.
Before recruiting fieldworkers, a researcher should do the job analysis, job description, and job specification. This will clearly lay down the job requirement and the traits of a person required to execute the job. Conducting a research, especially primary data collection, is a difficult exercise. Task becomes more difficult when data collection is done for more than one country. The researcher may suffer from isolation, anxiety, stress, and depression, even in a relatively straightforward fieldwork.6 Same can happen with the fieldworkers, as the job of a fieldworker is equally difficult. Hence, a fieldworker must possess the required traits to perform this difficult task. Job specification provides the list of basic traits required to execute the job.
9.2.2 Selecting a Fieldworker
A researcher who designs a research project rarely collects data. We have already discussed that fieldwork is an important and a crucial stage of conducting research and must be carried out carefully. Thus, the researcher has to recruit someone who is capable of handling the tedious job of fieldwork. Interviewer’s background also plays a key role in performing a research effectively. While recruiting a fieldworker, who will be a potential interviewer, the applicant’s affiliation and image should be a prime area of focus. Interviewer background includes factors such as interviewer affiliation, interviewer image, respondent–interviewer distance, respondent relevance, and interviewer bias due to inadequate training.7 Recruiting a good fieldworker is not as easy as it appears. In the field of business research, recruiting a qualified and trained fieldworker is a difficult task, especially in countries like India. “Lack of permanency” in job is a major factor that limits finding good, qualified, and trained fieldworkers. Projects are generally tenure based, and the tenure fieldworkers find a great difficulty in getting placed in another employment. Even if research designers find an extremely talented fieldworker, they also find difficulty in providing reemployment to the concerned fieldworker because the funding for the project is also tenure based. However, a qualified, trained, and experienced fieldworker is the backbone of any research programme and a careful recruitment policy is important to conduct research scientifically and effectively.
However, a qualified, trained, and experienced fieldworker is the backbone of any research programme and a careful recruitment policy is important to conduct research scientifically and effectively.
9.2.3 Providing Training to Fieldworkers
After selection of fieldworkers, an important aspect is to provide training to them. Training is a systematic development of knowledge, skills, and attitude required by employees to perform adequately on a given task or job.8 Training is important as the fieldworkers may be from diversified backgrounds and the purpose of the research is to collect data in a uniform manner. Training of the fieldworkers must cover the following topics:
Training is important as the fieldworkers may be from diversified backgrounds and the purpose of the research is to collect data in a uniform manner.
- Initial contact with the respondent
- Start interview and ask questions
- Probing the respondents
- Making a record of respondent’s answers
- Come to an end
9.2.3.1 Initial Contact with the Respondent
Initial contact involves first contact with a potential respondent to convince him or her to join the interview programme. It is a crucial stage where a respondent may or may not be ready to participate in the interview; thus, this stage requires a sophisticated handling of the matter specifically when the respondent is unwilling to participate. Skill of interviewer is especially required in encouraging or motivating a potential respondent if he or she is in dilemma in terms of participating in the interview. For example, an interviewer can frame an initial statement as follows.
Good morning sir, my name is _____ and I am an interviewer appointed by _______ business research firm. We are conducting a survey to understand consumer’s opinion on a vacuum cleaner. You have been selected as a respondent and we seek your cooperation in conducting the survey. We value your frank opinion and answers.
The interviewer must also be able to convince the potential respondent that the interviews are organized by a professional research agency and not a sales call. This fact is important to explain because most of the respondents will not be able to differentiate between a sales call and a research interview until and unless it is clearly explained to them. When a respondent replies that he or she does not have time, the situation must be handled intelligently, such that an interviewer can ask, “may I know when you will be able to spend time in this week.”
Initial contact involves first contact with a potential respondent to convince him or her to join the interview programme.
9.2.3.2 Start Interview and Ask Questions
Even a well-designed questionnaire can lead to a disaster if the questions are not asked properly by the interviewer. Hence, the fieldworkers must be properly trained to ask questions in an artistic manner. A small deviation from the sequence of asking or a slight emphasis on a particular word or sentence may completely distort the response. Thus, an interviewer should ask questions in a predetermined order and avoid unnecessary emphasis on any specific word or question. The interviewer must read each question slowly, so that the respondent may not have any problem in understanding. If a respondent has any problem in understanding the question, then the interviewer must explain it again. Interviewers have the tendency of completing the answer themselves. It is more common when an interviewer had conducted many interviews and the job becomes monotonous. This generates an unintentional interviewer bias and may be a serious problem later on.
Even a well-designed questionnaire can lead to a disaster if the questions are not asked properly by the interviewer.
9.2.3.3 Probing the Respondents
Probes help motivate the informants, facilitate the flow of an interview, and elicit information but not necessarily in the form of a question.9 There may be situations where the respondent is unable to provide a clear answer, the answer is incomplete, or unable to provide an answer. Probing involves providing a stimulus to the respondents to clarify, explain, or complete the answer. On-the-spot probing could gather data that would normally be done at a later stage or not at all due to funding or project deadlines.10 It actually deals with two situations: first, when a respondent is unable to provide a clear answer or is unable to provide an answer, the interviewer’s intervention as probing is essentially required, and second, when the respondent is distracted from the track of interview. It is the responsibility of an interviewer to clarify the answer if there is any ambiguity or track back the interview if it is distracted. Some common probing techniques are given below:
Probing involves providing a stimulus to the respondents to clarify, explain, or complete the answer.
- An interviewer should repeat the question, if needed, which enhances the understanding of the respondent and he replies in a clear manner.
- When an interviewer feels that the respondent is on the right track and has a clear understanding of the question, he must maintain a “strategic silence” and allow the respondent to speak. The interviewer must be able to assess when a respondent needs his or her help and at that point must be able to break the silence.
- When further clarification of the answer is required, an interviewer can repeat the answer and provide an opportunity to the respondent to be more elaborate.
- To facilitate the discussion, an interviewer can ask few neutral questions. For example, to obtain further clarification of the answer, an interviewer can ask a question such as “what do you mean by…?” To make the respondent more elaborate, an interviewer can ask “anything else will you like to tell.”
9.2.3.4 Making a Record of the Respondent’s Answers
The analyst who fails to instruct the fieldworkers about the technique of recording answers for one study rarely forgets to do so in the second study.11 Although the task seems to be simple, the mistakes in the recording are common. At this stage, the interviewer records the respondent’s answer. For structured questions, the way of recording the questions differs from researcher to researcher. One common way of recoding questions is to check in the box related to the respondent’s choice of answer. Answer to unstructured questions must be recorded verbatim and there should not be any variation from respondent’s answer while recording.
One common way of recoding the questions is to check in the box related to respondent’s choice of answer. Answer to unstructured questions must be recorded verbatim and there should not be any variation from respondent’s answer while recording.
9.2.3.5 Come to an End
Before termination of the interview, the fieldworker has to make sure that all the relevant and important information have been obtained. Before winding up, an interviewer should not forget to thank the respondent. Sometimes, the respondents may give some concluding remark, which may not be a part of the interview but may be important from the research point of view; hence this “remark” must be recorded immediately. An interviewer should always keep in mind that he or she has to contact the respondent again. Hence, the scope of this re-contact must not be finished and the interview termination must be friendly.
Before termination of the interview, the fieldworker has to make sure that all the relevant and important information have been obtained.
9.2.4 Briefing and Sending Fieldworkers to Field for Data Collection
Briefing session should be organized for both experienced and inexperienced fieldworkers. A researcher should never take a liberty that briefing is not required because the fieldworker is experienced and trained. It is also important to brief fieldworkers about the objective of the research and the clear purpose of data collection. The researcher must provide required details to the fieldworker. It includes background of the study, purpose of the study, details of the study already conducted by the researcher, and so on. The researcher has to keep in mind that the interviewer should not be provided with too much information, that is, more than what is required. Providing “more than the required” information can bias an interviewer in terms of framing a preconceived notion about the question or response. The researcher must also provide demographic details of the respondents to the fieldworker so as to facilitate the process of obtaining the response. In some of the surveys, the interviewer faces an embarrassing situation before the respondent when he finds himself unable to answer the respondent’s query about the research. This inability reduces the interviewer’s seriousness and credibility to conduct the interview. In addition, this discourages an interviewer and he starts hesitating to probe. This results in dilution of the quality of the interview. Hence, it is important for a research designer to brief all the required details to the interviewer to avoid such kind of embarrassment. There should be a ready plan to contact the respondents located at different locations. Interviews must be planned in such a way that the expenditure incurred in travelling must be as minimum as possible.
After briefing, the interviewers are sent to the field for data collection. An important point is to implement the plan of sending interviewers alone or accompanied by some associates or supervisors. Travelling plan that has already been decided must be executed effectively. A research designer must decide in advance the number of interviews to be conducted in a day. They must be clearly instructed about their contact plan and movement after contacting a particular respondent. Even when an interviewer has the discretion to randomly select household or subjects, a proper guideline must be issued to avoid selection bias. Research head must also brief about the return plan to fieldworkers.
Briefing session should be organized for both experienced and inexperienced fieldworkers.
9.2.5 Supervising the Fieldwork
Although training and briefing minimize the possibility of committing mistakes during the fieldwork, it is not completely eliminated. Hence, it is not the right time for a researcher to be relaxed as the fieldwork is carried out by the fieldworkers, but it is the right time for effective supervision. A supervisor continuously interacts with the fieldworkers and tries to find out solution to the problem faced by the fieldworkers on the field. A fieldworker might have faced many problems during the fieldwork, and these problems can be predicted in advance only to a certain extent. A few problems cannot be predicted and occur during the fieldwork without any estimation. These problems can occur on a daily basis, and hence these must be dealt and solved on a daily basis. Supervision involves checking the quality parameters, sampling verification, and cheating control.
Supervision involves checking the quality parameters, sampling verification, and cheating control.
9.2.5.1 Checking the Quality Parameters
Researchers always pre-specify the quality parameters. At this stage, a proper supervision is essentially required to find any deviation from these parameters. Supervisors must check whether all the questionnaires are properly filled. They must resolve the problem of an interviewer in terms of finding difficulty in filling answers for a particular question, if any. They must check whether the interviews are on schedule. If there is any deviation from the pre-specified schedule of conducting the interviews, the reasons for the delay must be examined properly and appropriate action must be taken.
Researchers always pre-specify the quality parameters.
9.2.5.2 Sampling Verification
It is important for a researcher to check whether the interviewers are contacting proper subjects. It is a common tendency of an interviewer to replace the concerned subjects with easily available subjects. For example, if an interviewer has contacted a household and the respondent from it is not available then instead of contacting the concerned subject again, the interviewer tries to pick the convenient option by contacting the neighbouring household. This leads to a loss of data being collected as the subject from the neighbouring household may not possess the required characteristics that may be important from the research designer’s point of view.
To check the sampling verification, a supervisor has to maintain a day-to-day record. A direct supervision of daily contact, refusal, and postponement is of paramount importance. The supervisor has to clearly check whether the refusal is an actual refusal, because there is a possibility that the interviewer had put the subject in the refusal category due to his or her unavailability or non-cooperation. There should be a daily check on the number of completed interviews. In short, a careful supervision is required to track the interviewers who may otherwise make things happen on the basis of their comfort and convenience.
A careful supervision is required to track the interviewers who may otherwise make things happen on the basis of their comfort and convenience.
9.2.5.3 Cheating Control
Cheating occurs when an interviewer falsifies the interviews. Falsifying means an interviewer can provide false or fake answers to some questions or the entire questionnaire. The most severe falsifying occurs when the interviewer fills the entire questionnaire himself without contacting the respondent. A fair and good selection policy in recruiting legitimate fieldworkers is one of the ways to handle this problem.
The most severe falsifying occurs when the interviewer fills the entire questionnaire himself without contacting the respondent.
9.2.6 Debriefing and Fieldwork Validation
Debriefing involves verification or validation of the responses provided by the fieldworker and evaluation of the fieldwork process. Fieldwork validation is an exercise launched to check whether the fieldworkers have submitted authentic filled questionnaires. To validate the fieldwork, the supervisors generally conduct re-interviews of some of the subjects previously interviewed by the fieldworker. While re-interviewing, the supervisors do not repeat the entire interview, but try to re-check some of the information obtained by the fieldworker. If not a personal re-interview, the supervisors contact the respondents through telephone or postcard to detect whether any false interview has been conducted by the fieldworker. The supervisors generally ask about the quality and length of the interview. They check the demographic information of the respondents, revealed by the fieldworker. The supervisor will be conducting a re-interview for verification; this awareness among the fieldworkers reduces the possibility of falsifying. For a supervisor, there is no quota fixed for re-interview. Conducting re-interview is a matter of researcher’s discretion and the researcher or the supervisor ultimately decides the number of re-interviews to be conducted.
Debriefing involves verification or validation of the responses provided by the fieldworker and evaluation of the fieldwork process.
9.2.7 Evaluating and Terminating the Fieldwork
It is important
It is important to evaluate the fieldwork process.
to evaluate the fieldwork process. In fact, a researcher must supply the evaluation parameters to all the fieldworkers during the training session. The first component of the evaluation may be time and cost of conducting a fieldwork. Time and cost must also be evaluated in the light of quality of data. It is possible that if a fieldworker has devoted less time and the cost of conducting the interview is also low then he or she has not provided a quality data. In this manner, the fieldworker has actually wasted the time and cost in conducting the fieldwork. The other important evaluation parameter is the quality of interviewing. A supervisor must evaluate the quality of interviewing in person or by means of a recorded interview. This involves identifying the individual calibre of a fieldworker to conduct a quality interview in terms of handling various sensitive issues such as introduction of the interviewer, probing, gathering sensitive information, handling respondent’s reluctance to answer some questions, and so on. The supervisor also focuses on response rate, especially when it is low. In this case, the supervisor immediately provides support to the fieldworker to enhance the response rate.
At the end of the fieldwork, the supervisor takes care of every aspect of the fieldwork such as the address and telephone number of the respondents and the fieldworker (taking care of the change taken place during the fieldwork). The supervisor thanks the fieldworkers and settles their financial claims. The supervisor also makes a note of the star performers in fieldwork to build a good team of the fieldworkers in the near future.
9.3 DATA PREPARATION
There exist two stages between data collection and interpretation: data preparation and data analysis. Data preparation secures the first place in these two stages. The reason behind it is simple. Data collected by the researchers from the field happens to be in raw format. Before going for analysis, the researcher has to convert raw data into the data format that is ready for data analysis. This section opens the discussion on how data can be prepared to facilitate statistical data analysis.
There exist two stages between data collection and interpretation: data preparation and data analysis.
9.4 DATA PREPARATION PROCESS
The data preparation process starts from preliminary questionnaire screening followed by data editing and data coding. After editing and coding, data are entered into the computer spreadsheets, and then data analysis strategy is initiated. Data analysis strategies can be further categorized into descriptive data analysis and inferential data analysis. Descriptive data analysis is used to describe the data, whereas inferential statistical analysis is based on use of some sophisticated statistical analysis to estimate the population parameter from sample statistic. Inferential data analysis can be classified into univariate, bivariate, and multivariate data analyses. Figure 9.2 shows the discussed data preparation process.
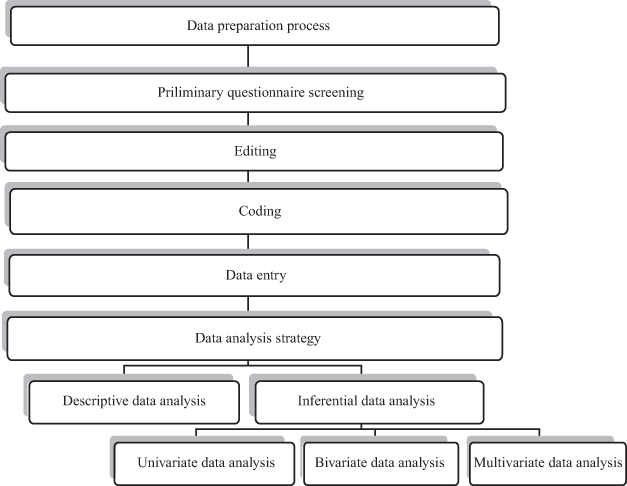
Figure 9.2 Data preparation process
9.4.1 Preliminary Questionnaire Screening
Although preliminary questionnaire screening takes place during the fieldwork, it is important to re-check the questionnaire. If the researcher has taken the service of any fieldwork agency then it is the responsibility of the concerned agency to take care of these problems during the fieldwork itself. There is a possibility that the questionnaire is technically complete, but there may be few issues that should be addressed by the research designer. Checking of the questionnaire is important, because there is a possibility that few pages of the questionnaire may be missing. Another possibility occurs in terms of irrational consistency in filling the answer on a rating scale. For example, on a 1- to 5-point rating scale, a respondent has chosen the rating point 3 for all the questions. This indicates that the respondent is not serious, and this must be taken care. During the preliminary screening of the questionnaire, the researcher can also identify the understanding of the respondent. This can be done by analysing the answer pattern to different questions. If there is a continuous skipping of some questions or if there is un-rationale selection of rating point as the answer to some questions, this is an indication of lack of understanding of the respondent. If these problems are serious in nature, the research designer can conduct the additional interviews to handle the situation. It is always advisable to take care of all the discussed issues during the fieldwork to avoid additional interview. Practically, some problems do appear even after considering all the precautions. This is the stage of research where the researcher finally addresses all these problems.
There is a possibility that the questionnaire is technically complete, but there may be few issues that should be addressed by the research designer.
9.4.2 Editing
Editing is actually checking of the questionnaire for suspicious, inconsistent, illegible, and incomplete answers visible from careful study of the questionnaire. Field editing is a good way to deal with the answering problems in the questionnaire and is usually done by the supervisor on the same day when the interviewer has conducted the interview. Editing on the same day of the interview has various advantages. In the case of any inconsistent or illogical answering, the supervisor can ask the interviewer about it, and the interviewer can also answer well because he or she has just conducted the interview and the possibility of forgetting the incident is minimal. The interviewer can then recall and discuss the answer and situation with the supervisor. In this manner, a logical answer to the question may be arrived. Field editing can also identify any fault in the process of the interview just on time and can be rectified without much delay in the interview process. In some interview techniques such as mail-interviewing technique, field editing is not possible. In such a situation, in-house editing is done, which rigorously examines the questionnaire for any deficiency and a team of experts edit and code these data.
Editing is actually checking of the questionnaire for suspicious, inconsistent, illegible, and incomplete answers visible from careful study of the questionnaire.
It has often been observed that the fieldworkers sometimes record the answers inappropriately. These answers generate some suspicion in the mind of a respondent at the first glance. For example, in a field survey of customers in a particular region, the average income of the household comes around Rs 1, 00,000 and one or two filled forms indicate this as Rs 10,00,000. This figure seems to be doubtful and a re-checking of the fact is required. It is also common that the filed questionnaire may be incomplete with respect to some questions.
Consistency in answering must be checked carefully. Few inconsistencies can be easily observed by mere screening of the questionnaire. A logical screening of the questionnaire can provide some inconsistent answers. For example, an extremely dissatisfied consumer providing a score of 5 to some of the product attributes on a 1- to 5-point rating scale. Checking consistency is also important to understand the accidental answers provided by the respondent. For example, in a series of two questions, the first question asks, “will you be purchasing a diesel car or a petrol car?” and the second question asks the respondent to prefer some of the salient attributes of a diesel or a petrol car. It may be possible that as a response to the first question, the respondent has selected diesel car and accidentally he or she ticked the salient attributes of a petrol car for the second question. This type of inconsistency in selecting the answer can be filtered out during the process of editing.
There is always a possibility that the respondent might have provided illegible answers. For example, for a particular question, the respondent might have selected a score point of both 4 and 5. For coding or further data analysis, the researcher essentially requires a single-digit number. Thus, there exists a question, which score point is to be selected, 4, 5, or an average of 4 and 5.
The researcher must examine the pattern of incomplete answers. It is always possible that some questions may be difficult to answer or understand, and there is an apparent pattern in skipping these questions. In some cases, it has also been observed that the respondent skips the first part of the question and answers the second part that actually is connected with the first part of the question. For example, the first question is, “in last year how many times you have gone out of the city for a personal trip” and the second question is, “please state the places where you have gone.” It is possible that the respondent has skipped the first part of the question but has mentioned three places as an answer to the second part of the question. This clearly specifies that the respondent has gone out of the city three times as he has mentioned the name of the places as an answer to the second part of the question. This type of incompleteness in the answer can be logically detected and settled down.
9.4.3 Coding
Before performing statistical analysis, a researcher has to prepare data for analysis. This preparation is done by data coding. Coding of data is probably the most crucial step in the analytical process.12 Codes or categories are tags or labels for allocating units of meaning to the descriptive or inferential information compiled during a study.13 In coding, each answer is identified and classified with a numerical score or other symbolic characteristics for processing the data in computers. While coding, researchers generally select a convenient way of entering the data in a spreadsheet (usually MS Excel). The data can be conveniently exported or imported to other software such as Minitab and SPSS. The character of information (points on which the information is collected such as age, gender, etc.) occupies the column position in the spreadsheet with the specific answers to the question entered in a row. Thus, each row of the spreadsheet will indicate the respondent’s answers on the column heads.
In coding, each answer is identified and classified with a numerical score or other symbolic characteristics for processing the data in computers.
Coding of open-ended questions is a typical task and must be done carefully. Most of the business research questionnaires are generally closed ended and the complexity is minimal as compared with the open-ended questionnaire. Coding alone is not sufficient but the correct coding and intelligent entry with respect to the coding is essentially required. Coding is an essential part of the analysis, but the questions of quality control in the coding process have received little attention.14 To enhance the quality in the coding exercise, training the persons involved in the coding and data entry is important. This is required especially when a researcher has to deal with large number of data in a limited time schedule. Data coders from different background may make the process more difficult. Similarities in knowledge and substance background of coders facilitate equivalence in the process of analysis.15
Figure 9.3 exhibits a sample questionnaire with coding. The questionnaire is developed to provide some information about toilet soap. Figure 9.4 in the spreadsheet showing data coding and entry of responses for the first 27 respondents belonging to different states. The first column is devoted for respondent identification number and the second column is devoted for the respective state to which the concerned respondent belongs. Question 1 is coded as Q1 and secures Column 3 and Question 2, coded as Q2, occupies Columns 4–10, and consists of seven different questions. These are further coded as Q2(a) to Q2(g) as the heading of Columns 4–10. Thus, the values are checked in the respective columns for the first concerned respondent as “4, 5, 2, 3, 4, 4, and 2” (see Figure 9.4).
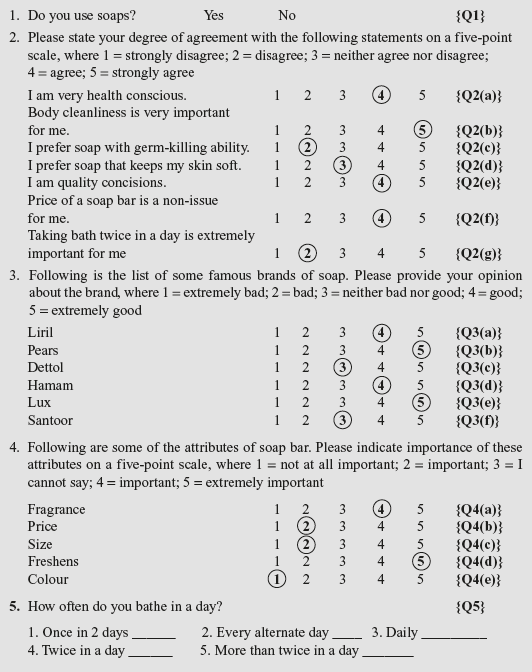
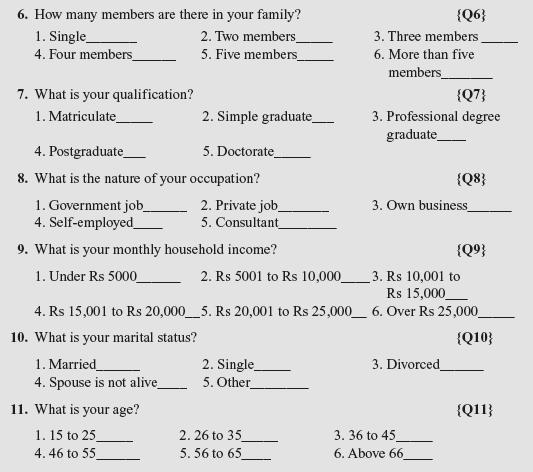
FIGURE 9.3 Questionnaire with coding
Microsoft Office 2007, copyright © 2007 Microsoft Corporation.
Question 3 coded as Q3 occupies Columns 11–16 and asks the respondents to provide their opinion about a particular brand in a list of six, which allows the question to be categorized into six parts each for one particular brand (see Figure 9.3). These are further coded as Q3(a) to Q3(f) as the heading of Columns 11–16. Thus the values are checked in Columns (11–16) for the concerned first respondent as “4, 5, 3, 4, 5, and 3” (see Figure 9.4).
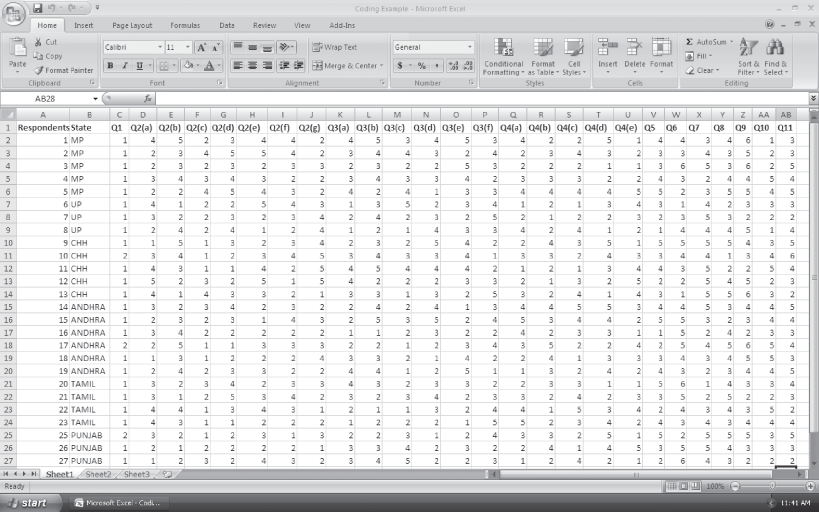
Figure 9.4 MS Excel spreadsheet exhibiting data coding for toilet soap questionnaire
Microsoft Office 2007, copyright © 2007 Microsoft Corporation.
Question 4 seeks respondent’s views on product attribute. Questionnaire presents five attributes to be rated on a five-point rating scale with 1 as not at all important and 5 as extremely important (Figure 9.3). These are further coded as Q4(a) to Q4(e) as the heading of Columns 17–21. Thus, the values are checked in Columns (17–21) for the concerned respondents as “4, 2, 2, 5, and 1” (see Figure 9.4).
Questions 5–11 are coded as Q5 to Q11 and occupy the head of Columns 22–28. The respective answers are checked in Columns (22–28) for the concerned first respondent as “4, 4, 3, 4, 6, 1, and 3.”
The process of data coding will become clear with the help of MS Excel spreadsheet as shown in Figure 9.4. Similarly, data can be entered for n number of respondents.
9.4.3.1 Codebook
A codebook contains instructions for coding and information of the variables taken for the study. It also contains variable location in the data set. Even if the questionnaire is pre-coded, coding helps researchers in identifying and locating the variables easily. A codebook generally contains the following information: (1) column number, (2) record number, (3) variable number, (4) variable name, (5) question number, and (6) instructions for coding.16
A codebook contains instructions for coding and information of the variables taken for the study.
9.4.4 Data Entry
At this stage, the data are entered in the spreadsheet. This is a crucial stage and is usually done by the computer typist. A careful supervision of the data entry is essentially required by the researcher. A re-check of the entire process is also important. A manual re-check of the data entry process can be done for a small set of data, whereas it is difficult and time consuming for the large. In this situation, the researcher can take help of another typist. Difference in entries can be easily pointed out and must be corrected with the help of originally filled questionnaire. After the data entry, the researcher has to launch data cleaning exercise. Data cleaning exercise is undertaken by any researcher to deal with the problem of missing data and illogical or inconsistent entries.
Data cleaning exercise is undertaken by any researcher to deal with the problem of missing data and illogical or inconsistent entries.
9.4.4.1 Data Cleaning
As discussed earlier, data cleaning involves two stages: handling missing data and checking data for illogical or inconsistent entries.
Handling Missing Data
Missing data are of two types: first, the data may be missing because the respondent has not provided any answer or has provided a vague answer; second, the data can be missed when the typist fails to type it, and as a result, the concerned cell is empty. The second category of missing problem is easy to deal with the help of the computer software solutions such as MS Excel, Minitab, SPSS, and so on, which provide the missing data number clearly. The concerned cell can be identified and the missing data can be re-entered with the help of the original questionnaire.
Missing data are of two types: first, the data may be missing because the respondent has not provided any answer or has provided a vague answer; second, the data can be missed when the typist fails to type the data, and as a result, the concerned cell is empty.
Dealing with the first category of missing data is relatively difficult. In this case, the data may be missed when a respondent deliberately or unknowing fails to tick an answer. This can be checked during the preliminary screening of the questionnaire stage or the data editing process by contacting the respondent again and getting the individual score for the concerned question. Difficulty occurs when the interviewer is unable to contact the respondent again or even if contacted, the respondent seems to be reluctant to provide an answer to the concerned question. Following are some of the guidelines to deal with such kind of missing data.
Leaving the missing data and performing the analysis: If the number of missing data is not too high then leaving the missing data as it is and performing the analysis is one of the options available to any researcher. Almost all the computer software solutions present the option of performing the analysis leaving the missing data and present the outputs by just mentioning the number of missing entries. A researcher cannot delete or allow the missing data to be a part of the data matrix when the number of missing observations is beyond a permissible limit. Now, there exists an important question, what is the permissible limit? There is no scientific guideline available pertaining to this permissible limit. As a general rule, the missing data should not exceed 10% of the total observations. In such case, deleting or leaving the observation does not solve the purpose.
If the number of missing data is not too high then leaving the missing data as it is and performing the analysis is one of the options available to any researcher.
Substituting a mean value: To deal with the problem of missing data, mean value to the concerned variable can be substituted. For example, for a particular survey, a researcher has collected 100 filled questionnaires. In the preliminary screening of the questionnaire, the researcher has observed that 15 responses pertaining to question 15 are missing. The researcher has re-conducted the interview and could get three responses but 12 are still missing. Now the researcher has an alternate option to deal with the problem of missing data. He can take the mean response of the 88 questions and can substitute it for the missing values. Although this approach is questionable because mean is the centric value, and it has got a poor match with the extreme observations like 1 or 7 in a seven-point rating scale.
To deal with the problem of missing data, mean value to the concerned variable can be substituted.
Case-wise deletion: Using this approach, a researcher can take a decision to discard the subject from the analysis. This approach has got a serious limitation. It will reduce the number of complete responses and the effort invested in data collection will be of no use. It is also possible for the missing data to be in a particular pattern and hence, a particular reason of not filling the answer for a question. Discarding all such subjects from the analysis will leave the subjects who have completed the questionnaire. This will miss an important aspect of the research, “why some respondents have not filled answer to some particular questions.” Case-wise deletion is possible when missing data are few, such as one in hundred and when there is no visible systematic pattern in missing data.
Each procedure in handling missing data has its own advantages and disadvantages. Each procedure can result in a different result. This is more possible when missing is not random and a sequence in missing can be detected. It is always advisable to keep the missing as minimum as possible because the procedures used to cope with the problem of missing is the repair process and can never compete with “no missing” situation. Principally, no missing is an ideal situation, but practically it is rare in a research. Hence, while dealing with the missing data, the researcher must examine the pros and cons of each method of handling the missing data and then should choose an appropriate method.
Principally, no missing is an ideal situation, but practically it is rare in a research.
Checking Data for Illogical or Inconsistent Entry
Before performing data analysis, the data must be checked for illogical or inconsistent entry. For example, on a 1- to 7-point rating scale, few respondents have provided entry as 8 and 9. It is illogical, as the rating scale has already been defined as 1 to 7 and the entries cannot be beyond that. This type of error must be detected and appropriate action must be taken. Nowadays, almost all the computer software solutions can detect this type of illogical data entries. Inconsistencies are common in the data set obtained from the respondents. For example, a respondent claims that he or she is a frequent user of Internet banking, and in the next response says that he or she does not have a bank account. This type of inconsistencies must be identified and a corrective action must be initiated.
Before performing data analysis, the data must be checked for illogical or inconsistent entries.
9.5 DATA ANALYSIS
Analysing data is an important and a scientific procedure and should be well described, documented, and explained.17 Data analysis exercise cannot be launched independently ignoring the previous steps of the research to deal with the problem. Data analysis technique is directly linked with the initial stages of conducting a research. For example, consider a research problem as “A comparative study of consumer attitude in two states, Gujarat and Chhattisgarh.” After establishing all the steps of the research, a researcher has to consider z-test for comparing the population in the two states. A change in the objective of the study as “A comparative study of consumer attitude in three states Gujarat, Chhattisgarh, and Madhya Pradesh” leads to the use of analysis of variance (ANOVA) technique for data analysis as the population has now been increased by one and the researcher should consider the population for three states. Hence, the data analysis technique is dependent on the previous stages of research.
Data analysis exercise cannot be launched independently ignoring the previous steps of the research to deal with the problem.
Another important factor in data analysis is the type of data gathered through questionnaire. As already discussed, for nominal and ordinal level of data, non-parametric tests are applied, and for interval and ration level of data, parametric tests are applied. A researcher cannot independently use any of the available technique and apply it on any type of data. These statistical analyses have some underlying assumptions. Before selecting any statistical analysis technique, these assumptions must be examined carefully. Few statistical analyses such as “time series analysis” are better used for predictions, whereas the others such as “multiple regression technique” can be used for prediction and determination of the relationship between the independent and dependent variables. Thus, each statistical analysis technique has its own assumptions, specifications, and abilities to confirm the hypothesized assumptions. All these cannot be applied together, because each technique presents a unique base of use and more or less is distinct from any other statistical technique. Hence, while selecting a tool for the data analysis some considerations are of paramount importance.
Thus, each statistical analysis technique has its own assumptions, specifications, and abilities to confirm the hypothesized assumptions. All these cannot be applied together, because each technique presents a unique base of use and more or less is distinct from any other statistical technique.
First, data analysis tool must be selected in light of the research objective. Second, the underlying assumptions associated with each analytical tool must be carefully examined and violation of assumptions must be clearly checked. Third, the statistical analysis technique must be selected in the light of scale of measurement. Fourth, nature of research problem also provides a base of selecting a statistical analysis. For example, consider a problem, “impact of age, gender, and income on consumer motive: a comparative study in Delhi and Mumbai”. This problem itself clearly states that a researcher has to first apply z-test for comparing the population of two states and subsequently apply the regression technique to determine the impact of independent variables, such as age, gender, and income, on a dependent variable consumer motive. Finally, the researcher’s interest, background, and knowledge play an important role in selecting a statistical tool. A researcher who has a deep knowledge about the analytical and statistical techniques will be able to deal with some advanced and sophisticated statistical techniques, whereas a conservative researcher has some hesitation in using them.
A researcher who has a deep knowledge about the analytical and statistical techniques will be able to deal with some advanced and sophisticated statistical techniques, whereas a conservative researcher has some hesitation in using them.
By and large statistical techniques for analysis can be placed in two categories: univariate and multivariate. Univariate statistical techniques are used only when one measurement of each element in the sample is taken or multiple measurement of each element are taken but each variable is analysed independently.18 Multivariate statistical techniques can be defined as “a collection of procedures for analysing the association between two or more sets of measurements that were made on each object in one or more samples of objects”.19
By and large statistical techniques for analysis can be placed in two categories: univariate and multivariate.
On the basis of scale of measurement (type of data), univariate techniques can be further classified into metric and non-metric statistical tests. When the data are nominal or ordinal, non-parametric statistical tests are used for data analyses, whereas when they are interval or ratio parametric, statistical tests are used. Parametric tests are the statistical techniques used to test a hypothesis based on some restrictive assumption about the population, whereas non-parametric tests are not dependent on the restrictive normality assumption of the population.20
When the data are nominal or ordinal, non-parametric statistical tests are used for data analyses, whereas when they are interval or ratio parametric, statistical tests are used.
A broad classification of univariate statistical techniques is shown in Figure 9.5. Univariate statistical techniques are categorized on the basis of metric or non-metric data. Type of data whether it is metric or non-metric presents a base for selecting appropriate test statistics. Parametric tests are applied for metric data, and non-parametric tests are applied for non-metric data. Selection of appropriate test statistics is based on one, two, or more than two samples from the population. When one sample is taken from one population, z- or t-test is applied for data analysis. When the sample size is more than 30 (a large sample), z-test statistic is used, and when sample size is less than or equal to 30 t-test statistic is used. In the category of parametric tests, two or more samples tests can be further classified on the basis of independent samples or related (dependent) samples category. When two independent samples are taken from two populations and the intention of the researcher is to find the mean difference of the population through sample means, then z- and t-tests are applied for large and small samples, respectively. When two samples are dependent on each other, matched-paired t-test is used. When a researcher wants to compare more than two samples taken from more than two populations, ANOVA technique is used.
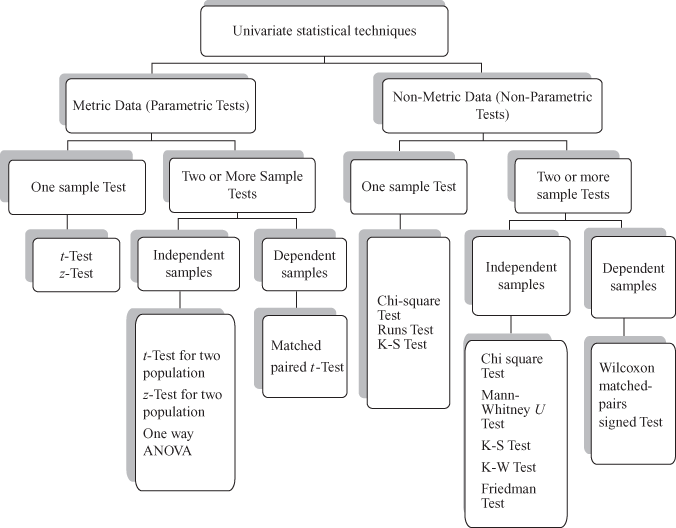
Figure 9.5 Classification of univariate statistical techniques
Type of data whether it is metric or non-metric presents a base of selecting appropriate test statistics. Parametric tests are applied for metric data and non-parametric tests are applied for non-metric data.
When data are non-parametric (nominal or ordinal data), non-parametric tests are applied. Similar to parametric tests, non-parametric tests can be further classified on the basis of the number of samples. The most important non-parametric test is the chi-square test. Few researchers place chi-square test in the category of parametric test, whereas the others consider it as non-parametric tests. For one sample, Runs test and Kolmogorov–Smirnov (K-S) tests are used by the researchers. In terms of application, non-parametric tests can be further categorized into two or more than two samples. This category is further classified into independent or dependent samples. Chi-square test, Mann–Whitney U test, K-S test, Kruskal–Wallis test, and Friedman test can be applied in two or more independent sample categories. When two samples are taken from the population of two states, which are dependent as a non-parametric test, Wilcoxon matched-pairs signed test is used for data analysis. Examination of the relationship between two variables is known as bivariate analysis. Measurement of correlation (sample correlation coefficient), coefficient of determination, and bivariate simple regression analysis are some of the commonly applied bivariate statistical analysis.
In the field of business, a variety of multiple factors intervene between the business activities of companies and response from the market. A simple approach of examining the problem seems to be inappropriate in handling these complex problems. Multivariate techniques are now widely used by the business researchers, especially after the introduction of computers. It has also been observed that there is an eagerness to apply these techniques without considering the rationale of its use. The seeming statistical sophistication of multivariate techniques, coupled with the ready access to computer programs incorporating them, may tempt researchers to rush into using them without adequately considering their appropriateness in the given situation.21 To obtain optimum result, researcher should to be cautious in using these sophisticated multivariate techniques.
Multivariate techniques are now widely used by the business researchers, especially after the introduction of computers.
Figure 9.6 presents a classification of multivariate techniques. This classification is done on the basis of the three judgments that a business researcher must consider while applying multivariate statistical techniques. The first judgment and classification parameter is the dependence of variables, and the second judgment and classification parameter is the “number of variables treated as dependent in a single analysis.” The final judgment and classification parameter is the type of data: metric data or non-metric data. ANOVA, analysis of covariance (ANCOVA), multiple regression, and conjoint analysis are some of the commonly used dependence techniques, when there is only one dependent variable and the data are metric in nature. Multiple discriminant analysis is a dependence technique when the data are categorical (non-metric) in nature. When there are many dependent variables and the data are metric in nature, multivariate ANOVA and ANCOVA are used as the statistical techniques. When there are many dependent variables and the data are non-metric in nature, canonical correlation is used as the multivariate statistical techniques. Factor analysis, cluster analysis, and metric multidimensional scaling are some of the commonly used interdependence techniques when there is only one dependent variable and the data are metric in nature. Non-metric scaling and latent structural analysis are some of the interdependence techniques, when there is one dependent variable and the data are non-metric in nature.
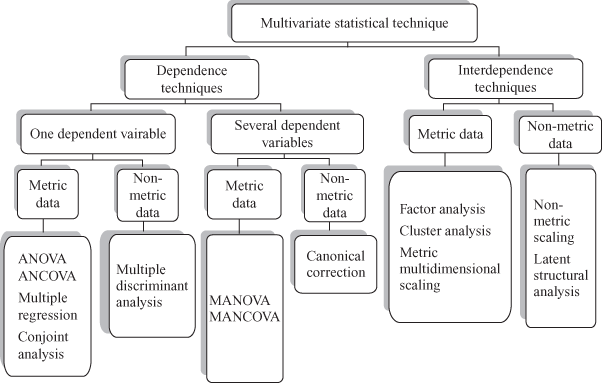
Figure 9.6 Classification of multivariate statistical techniques
Endnotes |
1. Meckel, M., D. Walters and P. Baugh (2005). “Mixed-Modes Surveys Using Mail and Web Questionnaires”, The Electronic Journal of Business Research Methodology, 3(1): 69–80.
2. Scott, S., F. Miller and K. Lloyd (2006). “Doing Fieldwork in Development Geography: Research Culture and Research Space in Vietnam”, Geographical Research, 44(1): 28–40.
3. Nilan, P. (2002). “‘Dangerous Fieldwork’ Re-Examined: The Question of Researcher Subject Position”, Qualitative Research, 2(3): 363–86.
4. Alam, I. (2005). “Fieldwork and Data Collection in Qualitative Marketing Research”, Qualitative Market Research: An International Journal, 8(1): 97–112.
5. Dessler, G. (2003). Human Resource Management, 8th ed., p. 84. Pearson Education Singapore Pte. Ltd.
6. Nilan, Op.Cit., p. 188.
7. Malhotra, N. K., J. Agarwal and M. Peterson (1996). “Methodological Issues in Cross-Cultural Marketing Research”, International Marketing Review, 13(5): 7–43.
8. Olaniyan, D. A. and L. B. Ojo (2008). “Staff Training and Development: A Vital Tool for Organizational Effectiveness”, European Journal of Scientific Research, 24(3): 326–31.
9. De Leon J. P. and J. H. Cohen (2005). “Objects and Walking Probes in Ethnographic Interviewing”, Field Methods, 17(2): 200–4.
10. Grim, B. J., A. H. Harmon and J. C. Gromis (2006). “Focused Group Interviews as an Innovative Quanti-Qualitative Methodology (QQM): Integrating Quantitative Elements into a Qualitative Methodology”, The Qualitative Report, 11(3): 516–37.
11. Zikmund, W. G. (2007). Business Research Methods, 7th ed., p. 441. South-Western Thomson Learning.
12. Sinkovics, R. R., E. Penz and P. N. Ghauri (2009). “Enhancing the Trustworthiness of Qualitative Research in International Business”, Management International Review, 48(6): 689–714.
13. Basit, T. N. (2003). “Manual or Electronic? The Role of Coding in Qualitative Data Analysis”, Educational Research, 45(2):143–53.
14. Hruschka, D. J., D. Schwartz, D. C. St. John, E. Picone-Decaro, R. A. Jenkins, and J. W. Carey (2004). “Reliability in Coding Open-Ended Data: Lessons Learned from HIV Behavioral Research”, Field Methods, 16(3): 307–31.
15. Polsa, P. (2007). “Comparability in Cross-Cultural Qualitative Marketing Research: Equivalence in Personal Interviews”, Academy of Marketing Science Review, 2007(8): 1–18.
16. Malhotra, N. K., (2004). Marketing Research: An Applied Orientation, 4th ed., p. 407. Pearson Education.
17. Haring, R. (2008). “Conducting Culturally Appropriate Qualitative Market Research in the Native American Landscape”, Qualitative Market Research: An International Journal, 11(1): 7–16.
18. Shao, A. T. (2002). Marketing Research: An Aid to Decision Making, 2nd ed., p. 438. South-Western Thomson Learning.
19. Aaker, D. A., V. Kumar and G. S. Day (2000). Marketing Research, 7th ed., p. 436. Wiley.
20. Bajpai, N. (2009). Business Statistics, p. 678. Pearson Education.
21. Parasuraman, A., D. Grewal and R. Krishnan (2004). Marketing Research, p. 537. Boston, NY: Houghton Mifflin Company.
SUMMARY |
In business research, fieldwork is important and requires a systematic approach. Fieldwork is the most exciting part of the research that provides an opportunity to a researcher to have a new thinking and a new way to look at various things. A systematic fieldwork is performed using the following seven steps: job analysis, job description, and job specification; selecting fieldworkers; providing training to fieldworkers; briefing and sending fieldworkers to the field for data collection; supervising the fieldwork; debriefing and fieldwork validation; and evaluating and terminating fieldwork.
There exist two stages between data collection and interpretation, they are data preparation and data analysis. Data preparation secures the first place in these two stages. The data preparation process starts from preliminary questionnaire screening. In the subsequent steps, data editing and data coding are executed. After editing and coding, the data are entered into computer spreadsheets and then the data analysis strategy is initiated. Data analysis strategies can be further categorized into descriptive data analysis and inferential data analysis. Descriptive data analysis is used in describing the data, whereas inferential statistical analysis is based on the use of some sophisticated statistical analysis to estimate the population parameter from sample statistic. Inferential data analysis can be classified into univariate, bivariate, and multivariate data analyses.
KEY TERMS |
Briefing, 191
Briefing session, 194
Codebook, 201
Coding, 199
Data analysis strategy, 197
Data cleaning, 202
Data entry, 201
Data preparation process, 197
Debriefing, 196
Descriptive data analysis, 197
Editing, 198
Evaluation and termination of fieldwork, 191
Fieldwork validation, 196
Handling missing data, 202
Inferential data analysis, 197
Initial contact, 192
Job analysis, 191
Job description, 191
Job specification, 191
Preliminary questionnaire screening, 197
Probing, 193
Providing training to fieldworkers, 191
Selection of fieldworkers, 191
Strategic silence, 193
Supervising the fieldwork, 191
Univariate, bivariate, and multivariate data analyses, 197
NOTES |
- 1. http://www.escortsgroup.com/the_group/group_about_us.html
- 2. http://economictimes.indiatimes.com/News/News-By-Industry/Indl-Goods–Svs/Engineeri…
DISCUSSION QUESTIONS |
- 1. What is fieldwork and how fieldwork is an integral part of conducting any research?
- 2. Explain the various stages of fieldwork process.
- 3. What are job analysis, job description, and job specification, and how a researcher can explore these in recruiting good fieldworkers?
- 4. Why training is essential before sending fieldworkers for data collection?
- 5. What is the role of briefing, supervising, and debriefing in conducting fieldwork programme?
- 6. Why fieldwork validation and fieldwork evaluation are essential for a business researcher?
- 7. What are the various steps of data preparation process?
- 8. What is the role of editing and coding in data preparation process?
- 9. What are the precautions a researcher has to keep in mind while entering data?
- 10. Explain data cleaning in the light of handling missing data and checking data for illogical or inconsistent entry.
- 11. What are the important considerations while performing data analysis?
- 12. Write a short note on the following terms:
- Univariate statistical analysis
- Bivariate statistical analysis
- Multivariate statistical analysis
CASE STUDY |
Case 9: ITC: A Long Way Journey from a Pure Tobacco Company to a Well-diversified FMCG Company
Introduction
The Indian Tobacco Company (ITC) has come a long way from being a pure tobacco company to become a well-diversified fast moving consumer goods (FMCG) company. Slower growth in cigarettes business with the global anti-tobacco movement gaining momentum and the heavy taxation policy followed by the government for cigarettes prompted ITC to diversify into other businesses. Today, it has a strong presence in paperboards, paper and packaging, hotels, and other FMCG products including branded packaged food, apparels, safety matches, agarbattis, greeting cards, and agribusiness. Although manufacturing cigarettes still remains the company’s prime economic activity, its share in total sales has come down to 65.8% in 2006–2007.1
In 1925, ITC first diversified into packaging and printing. This division contributes around 10% of the company’s revenue. ITC entered into hospitality business in 1975 by opening its first hotel in Chennai, “Hotel Chola.” Today, the company operates over 70 hotels across India classified under five brands: ITC Hotels - Luxury collection, ITC-Welcomgroup Sheraton Hotels, WelcomHotels, Fortune Hotels, and WelcomHeritage. It is the second largest company in the Indian hotel and restaurant business with a market share of 11.9% (2005–2006). However, the hotel business contributes 4% to the company’s gross sales. Table 9.01 exhibits the growth story of ITC through net profit (in million rupees) of ITC Ltd in different quarters.1
Table 9.01 Net profit (in million rupees) of ITC Ltd in different quarters
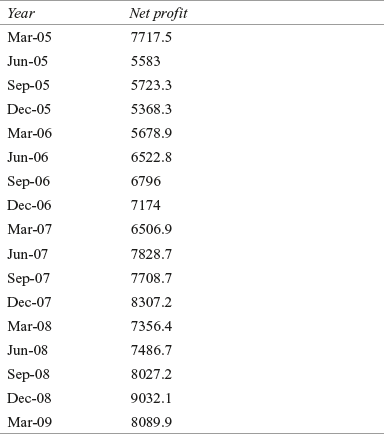
Source: Prowess (V. 3.1): Centre for Monitoring Indian Economy Pvt. Ltd, Mumbai, accessed September 2009, reprinted with permission.
As one of the valued and prestigious organizations of the country, ITC is perceived to be dedicatedly nation-oriented. Mr Y. C. Deveshwar, Chairman of the ITC Ltd, terms it as the source of inspiration “a commitment beyond the market.” He says that “ITC believes that its aspiration to create enduring value for the nation provides the motive force to sustain growing shareholder value. ITC practices this philosophy by not only driving each of its businesses towards international competitiveness but by also consciously contributing to enhancing the competitiveness of the larger value chain which it is a part”.2
Focus on Hotel Industry
The strong growth witnessed by the Indian hospitality industry in the last few years was driven by increased business traffic and leisure travel in the wake of favourable economic conditions and higher order integration of India with the global economy. The premium segment that accounts for 60% of the hotel industry’s revenues grew at an impressive 27% between 2003–2004 and 2007–2008. This growth momentum continued into the first half of the fiscal year 2008–2009 reflected in the growth of the Company’s revenues by 14%. The effect of the economic slowdown started to impact from the middle of the year with clampdown on domestic-corporate travel and steep reduction in international travel as a fallout of the global financial crisis. Lack of consumer confidence also adversely affected leisure travel. The situation worsened with the horrific terror strikes at Mumbai, which triggered off negative travel advisories leading to a sharp reduction in occupancies and average room revenues. This cyclical downturn affected the hospitality industry, although the business has been able to demonstrate some resilience during this challenging period. However, the business continues to pursue an aggressive investment-led growth strategy recognizing the inadequate capacity and the longer term potential of this sector.1
ITC Ltd has lined up an investment of Rs 80,000 million to grow its hotel businesses. Addressing the company’s 98th AGM in Kolkata, the chairman of ITC Ltd, Mr Y. C. Deveshwar clearly stated the company’s strategy, “We are looking at various opportunities in the hotel space within the country. Senior officials from ITC led by the chief executive of development cell are scouting for the properties in the country. Talks are on with a number of people including real estate developers for acquiring properties. The hotel business continues to pursue an aggressive investment led growth strategy recognizing the long-term potential of this sector and the need for greater room capacities commensurate with India’s economic growth. We are extremely bullish about the hotels business”.3
Highlighting more details of the hotels business development plan, the senior executive vice president (hotels division) of ITC presented the aim of 2012, “Our plan is to have 100 hotels under the Fortune brand across the country by 2012 with an inventory of around 8,000 rooms.” With an optimistic vision he further added, “Leisure travellers comprise around 15–20 per cent of our customers, while the ratio between foreign and domestic customers is 75:25. We are now planning to put more emphasis on attracting domestic visitors in the leisure segment”.4
As discussed in the case, ITC Ltd wants to attract domestic customers for its hotel business. Suppose that ITC Ltd wants to ascertain aspirations of domestic customers related to hotel facility on some grounds such as food, swimming pool facility, room service, recreation facility, room cleaning facility, and launched an extensive survey programme. How company will organize fieldwork and data collection process? What will be the way of framing questions and how company will decide about the initial contact? What should be the finest way to supervise the fieldwork? How will the company validate and evaluate the fieldwork?
NOTES |
- 1. Prowess (V. 3. 1): Centre for Monitoring Indian Economy Pvt. Ltd, Mumbai, accessed September 2009, reprinted with permission.
- 2. http://www.itcportal.com/the_itc_profile/itc_profile.html, accessed September 2009.
- 3. http://economictimes.indiatimes.com/News/News-By-Industry/Services/Hotels-Restaurant… accessed August 2009.
- 4. http://www.telegraphindia.com/1090411/jsp/ business/story_10806478.jsp accessed October 2009.