12
How to Connect Category Creation Programs to Growth for Executives and Investors
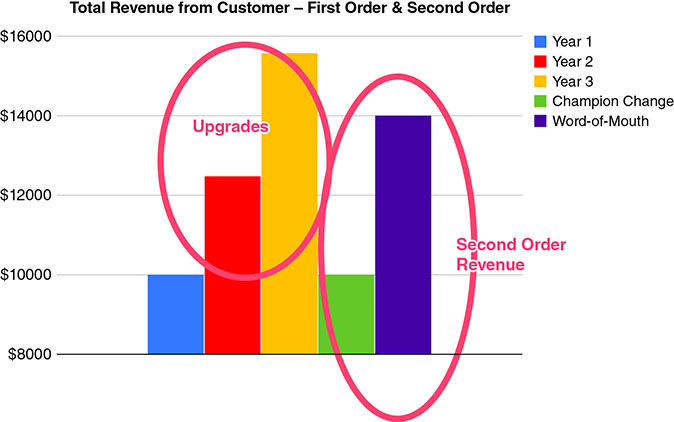
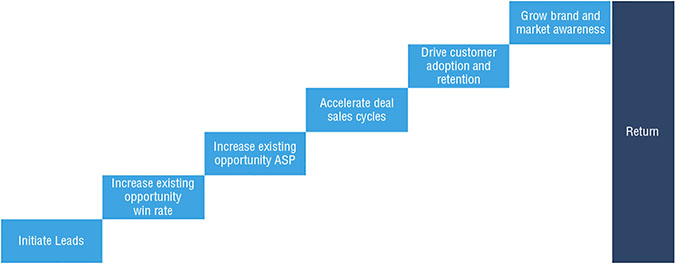
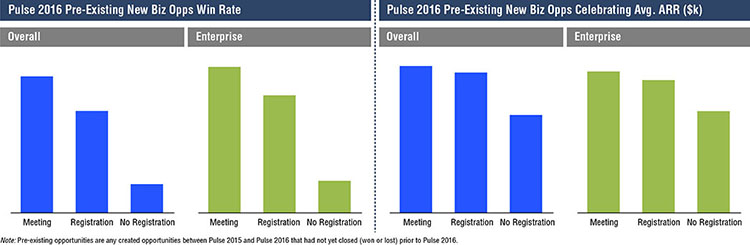
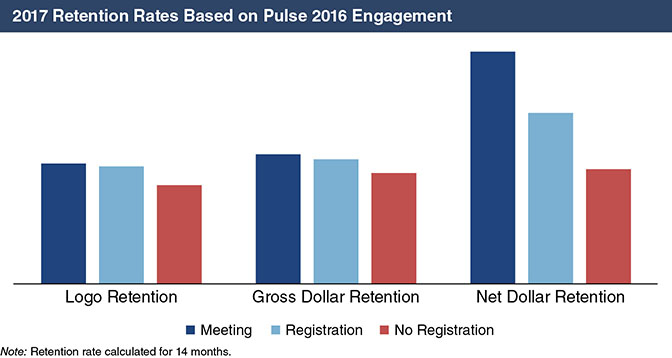
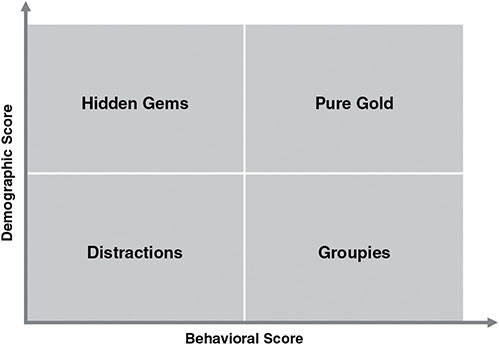
Iconic theoretical physicist Albert Einstein once said that “not everything that can be counted counts, and not everything that counts can be counted.” There’s freedom in that quote for marketers—a business discipline that lives under constant pressure to prove the impact of their investments on business outcomes such as pipeline creation and revenue growth. While brand programs may be more difficult to quantify or attribute (at least directly) to growth relative to more traditional demand generation programs, a CFO or board member won’t accept an Einstein reference as an excuse. The reality is that brand marketing efforts do indeed drive growth, and getting your executive team and investors to understand how these efforts correlate to revenue is critical to both cross-functional alignment on vision and securing the investment required to execute a category creation strategy successfully. Proving the value of brand on growth is hard enough; however, as I described in Chapter Three, it’s an even more difficult exercise for category creators. Recall the two funnel effect—this idea of a chasm existing in the market between interest in the category (funnel one) and interest in your products (funnel two). Success in funnel one means broad category awareness, identification of your company brand as a contributor to the discussion within the new category, and ongoing engagement around the best practices and resources that your team produces. Success in funnel two means hypergrowth. The momentum behind the first funnel must eventually correlate to momentum in the second funnel, otherwise, an observer may be right to question whether there’s a real business to be built (beyond perhaps a media company) in your category. It may take some time, and benchmarking funnel performance against disruption-oriented companies may prove to be misleading, which can explain why only the long-term greedy have the patience to create a category. But we know that successfully creating and dominating a category will lead to more sustainable shareholder value creation than almost any other strategy, on the magnitude of 53% incremental revenue growth and 74% incremental market capitalization growth, according to Harvard Business Review.1 That upside is certainly worth the effort, but creating a common language and orientation around data is a necessary step to prove correlation and build the repeatable processes required to create and scale a generational company. In this chapter, we’ll walk through the different growth outcomes that category creation can impact, empowering you with a language to speak to the value you are creating within the business in terms that a CFO or investor would appreciate. Ultimately, you’ll be hard-pressed to convince anyone that category creation is working unless you can tie performance back to the funnel. However, before we get there, I want to introduce a series of phrases and acronyms that we’ll use throughout the chapter to refer to various funnel stages. The stage names and definitions in Table 12.1 might be slightly different from how your company thinks about the funnel, but in general, should be fairly close to best practice. Table 12.1 Funnel Stage Names and Definitions The list in Table 12.1 is far from complete—most notably absent are the various sales stages that make up early- and late-stage pipeline between the SAL stage and Closed Won. However, each of the seven strategies that I introduced in Part II will ultimately impact growth outcomes that show up in the stages described here—but let’s talk about how. Category creation is both a company-wide philosophy and marketing practice, but as we’ve discussed throughout the book, many of the programs in the playbook overlap with traditional marketing principles—just expressed through the lens of category creation. Therefore, all of the universally accepted growth outcomes that CFOs and investors care about for any business are relevant and directly impacted by a category creation strategy. Here are six examples of those outcomes and how to set expectations across the business on the impact of category creation: Building and maintaining an opt-in marketing database of prospects and customers is at the heart of the modern marketing organization. Nearly all campaigns—whether content launches, event promotions, or personalized nurture—leverage email as a function of driving engagement. If your database is small or unfocused, you won’t have an audience size large enough to drive the growth that your company desires. If your database is disengaged, or worse, spammed, your audience will unsubscribe. Therefore, the health of your marketable database is a reflection of the health of your marketing strategy. Building your database typically comes from either organic or paid media efforts at the very top of the funnel. For category creators, creating enough early stage content that’s SEO friendly around the search terms relevant to your category is the best way to drive organic value. Over time, the organic effort will influence search volume on your company and category brand, which can be measured using the free Google Trends utility. Some companies will allocate budget to syndicate their content across high authority web properties, or pay advertising services to help drive more engagement with their content from their target audience. There are many leading indicators to account for the successful execution of organic and paid strategies, but ultimately, the number of conversions your team is able to generate is the appropriate lagging indicator. Are you getting the right persons opting into your database? Are they coming from the right company profile? Conversions are the right metric to use in order to quantify the impact of brand awareness of your new category (funnel one), as well as a leading indicator into future sales (funnel two) given the campaigns that will be driven into your database. The gross number in aggregate is interesting, but reporting on conversions by demographic considerations such as persona, company size, or industry vertical can lead to important revelations that can inform your go-to-market approach in your new category. As an example, are SMB companies gravitating to the messaging that you’re putting out in the marketplace more than large enterprises? Are you finding strong resonance with director-level and below titles rather than above the line decision makers? Educating your executive team on how to think about conversions is bigger than the health of your database, but an early indicator on the health of your entire category. Scaling your database by driving conversions—both widespread and targeted—is important, but so is the ongoing engagement of those who have already converted. In Chapters Six and Seven, I discussed how content cadence plays just as important a role in category creation as content quality. An expectation gets set in the market that your brand is leading the conversation around industry best practices, along with a responsibility to deliver new and relevant content regularly into your marketable database. If contacts in your database are showing high engagement with the content that you’re creating, that is a clear signal of their interest in your category. Signs of engagement for an already opted-in conversion can include interesting moments such as webinar attendance, regular visits to your blog or website, or registering to attend a live event. These moments impact that particular individual’s behavioral data within the lead scoring component of your marketing automation system, which when correlated to demographic data, could be a good signal of “funnel two” interest in your products. We’ll talk more about lead scoring from a category creation perspective later in this chapter. It’s worth measuring and communicating both conversions and ongoing marketing engagement through an account-based lens. While our focus in category creation must prioritize and empower people over logos, at the end of the day, companies in the B2B context enter into contractual agreements with other entities. Understanding how engaged contacts within your target accounts are with your content may signal where they are currently in their maturity within your category (funnel one) and whether or not they are in an active evaluation process for products (funnel two). Engagement with early stage content topics such as how to build the team may indicate they are still in strategy definition mode, while engagement with late stage content topics such as how to use [your product] to solve X problem may indicate they’re in-market for a solution. Engagement can also correlate to how likely a forecasted deal is to close. If your sales team has deals in the forecast that haven’t engaged with your website or content in some time, that opportunity may be at risk. Conversions alone won’t establish a category. Ultimately, you’ll need to build the bridge from funnel one to funnel two by generating enough interest in your product to justify investments in category marketing. We’ll spend a lot of time later in this chapter walking through some tactics to do just that, but the way to talk about converting category energy into product energy is in terms of MQLs, SQLs, and SALs. By implementing a lead scoring methodology, the conversions you’ve sourced at the top of the funnel are exhibiting demographic and behavioral context that can signal buying intent. Once they pass through a certain scoring threshold or exhibit behavior such as “hand raising” (asking for direct contact from sales), these conversions become MQLs that warrant a prospecting or qualification motion. The conversion-to-MQL conversion ratio is a good metric to observe for implied conversion from funnel one to funnel two. What happens next is contextual to each company. In some organizations, MQLs generate alerts for the sales development team to follow up with in order to set a meeting for the account executive, and thus generating an SQL. Once the discovery call takes place, if the AE believes the SDR correctly qualified the opportunity, they would accept the opportunity, thus creating an SAL. The rules of engagement, units of measurement, and compensation levers will differ from company to company. At the end of the day, these processes help mine category creation efforts for sales opportunities leveraging available data in marketing automation systems. Most marketing organizations are measured by pipeline creation, whether that shows up as MQLs, SQLs, or SALs. The trend, however, is to measure marketing further down the funnel, as pipeline created is only relevant if enough of it eventually turns into revenue. That’s why sales and marketing alignment is absolutely critical to ensure that each organization is doing its part, especially in category creation where popular qualification methodologies like BANT (budget, authority, needs, and timeline) may not apply. All individuals operating in a new category are in a constant state of learning, whether or not they are in-market for enabling products. In the previous scenarios, we discussed how category education efforts such as early stage content and event programs can generate interest in your brand, and when mined, can signal interest of buying intent. However, prospects who are already actively engaged in a sales process with your company also benefit from category education activities in profound ways. In fact, opportunities that are exhibiting increased levels of activity and engagement with your marketing programs have a higher propensity to buy. This means that when done right, marketing should influence nearly 100% of every deal closed in new categories, even if sourced by Sales, Customer Success, or other channels. Measuring influence and deal attribution is often a difficult (and contentious) exercise, but capturing interesting moments at an account level—as explored earlier in the database engagement section—is a great place to start. We’ll cover some ideas later on how marketing can personalize thought leadership for sales to package at a specific account and, also, how late stage content can become a powerful lever to influence buyers in new categories and teach them how to buy. None of what I’ve shared in this book will matter unless the programs ultimately contribute to bookings—or a lead’s successful journey through funnel two. The outcomes above are great leading indicators, but ARR (or revenue) is the lagging indicator of a category created. Typically, investors are interested in understanding how many new “lands”—or new logos—were closed in a given timeframe and, of those, how many transactions can be attributed to category marketing effort. To get ahead of that conversation, create a process around pulling together a detailed analysis of every deal closed, as well as conducting win (and even loss) interviews that capture qualitative feedback on why buyers buy. We’ve found time and time again in our customer interviews at Gainsight that customers loved our products, but when asked, it was our brand that compelled them to work with us over the competition. Gainsight created an entire movement around the belief that closing a new deal is only the beginning of a brand’s relationship with that customer. According to Harvard Business Review, the cost of acquiring a new customer is anywhere from five to 25 times more expensive than retaining an existing one.2 Landing is clearly an important starting point, but Customer Success effort to help customers get value from the products we sell them generates powerful new revenue opportunities around (a) ensuring they renew their contracts, (b) upselling additional licenses or enhancements, or (c) cross-selling net new products. We’ll talk about the value of category creation on customers in the final chapter of the book, but from the growth perspective, the same correlation of impact can be drawn to expansion revenue opportunities as new business opportunities. The financial KPI that CFOs and investors care about here may differ from company to company, but is typically net revenue retention (NRR). This metric measures the total value of your renewed contracts as well as the revenue gained through upsells and cross-sells. You can evaluate NRR on a monthly or annual basis, depending on your needs. Once you’ve determined the period of time you want to measure, add the value of your renewed contracts with your expansion revenue and divide it by the total value of all contracts that were up for renewal. Because upsells and cross-sells are taken into account, your NRR can be over 100%, and this is what best-in-class companies strive for. There’s another powerful way to connect category marketing effort to customer growth outside of the models described in the outcomes above—second order revenue. The idea is that the book has already been written on how to optimize sales and marketing spend as a function of customer lifetime value (CLTV). While imperfect, the calculation will typically be something to the tune of spending the first year’s contract value (ACV) to acquire a new customer. But this calculation does not take into consideration virality and “second order” customers (as seen in Figure 12.1) that are sourced as opportunities when companies invest in Customer Success. Jason Lemkin, founder of SaaStr, illustrates a scenario3 of second-order revenue as follows: Figure 12.1 Visualizing the Effects of Second Order Revenue (via SaaStr) Typically new markets will see a lot of executive turnover as demand for category experience and skill set outweighs supply. For category creators, that natural law creates an opportunity for champion change, repeat buyers, and viral word-of-mouth phenomena that creates second order pipeline creation—and therefore revenue. Making your customers successful is no longer just a “post-sales” responsibility, but rather an important contributor to how revenue is generated. I hope by now you understand that category creation is directly correlated to growth. You won’t need to invent any new metrics to convince your CFO or investors that these programs are working. But while results are typically measured using the point-in-time outcomes previously described, the reality is that executing the category creation playbook ends up feeling more like a perfect storm of activity and impact. One of the best examples of “success in chaos” is conference marketing, a strategy that I described in great detail in Chapter Eight. At Gainsight, as it is with every company that produces its own conference, the program impacts each of the growth outcomes described earlier in one powerful campaign. However, Pulse certainly comes at a price. Pulse represents Gainsight’s single largest allocation of spend, so it’s important that we seriously and objectively analyze each aspect of the conference with an eye toward optimization and evolution. After analyzing the data collected in the first five years of the conference (2013–2018), here’s what we learned about Pulse’s impact on Gainsight’s growth. Figure 12.2 Charting Opportunity Cost in Conference Marketing Figure 12.3 Understanding ACV Impact of Pulse Conference Attendance Figure 12.4 Understanding Retention Impact of Pulse Conference Attendance We’ve concluded over the years that, hands down, Pulse is the single most important program that Gainsight runs—in terms of expanding the total addressable market (TAM) of the category, driving the growth of the company, as well as advancing the company’s relationship and leadership equity with customers, investors, and employees. Our strategy over time is to keep scaling the growth of the conference and the experience we create for attendees, while also driving down our operational costs on the program. Both economies of scale (registration revenue) and a growing partner ecosystem (sponsor revenue) help in that effort. Successfully building a bridge from category interest (funnel one) to product interest (funnel two) is the single biggest challenge in category creation. It’s entirely possible the conversions are spiking and interest in the category is extremely high, and yet, Sales is still forecasting below plan. The primary reason for this phenomenon comes back to education—with the exception of early adopters, the market at large will typically need to define strategy prior to taking a chance at a product to operationalize that very strategy. That process takes time, and category creators play an important role in serving the market as thought partners throughout that phase of the journey. This chasm will manifest to executives and investors in a few ways, but most interesting is in opportunity loss reasons, which in new categories typically tend not to be losses to competition, but rather, losses to time (or not now). Prospects in funnel one are learning how to solve the problem that you’ve observed in the category—a process that for some companies could take a long time. How can you short-circuit the new category learning curve? The first step is to understand how to prioritize marketing programs in context of those companies that are showing signals of interest in funnel two, over companies that are very happy living in funnel one. Time is an important currency in business, so aligning marketing and sales resources against accounts with the highest propensity to buy now is important. To understand what’s going on in your marketable database, you need to implement a lead scoring methodology. Lead scores are assigned to each contact in your database and measure important factors such as demographic data (e.g., Is this the right type of company, or are they a buyer or influencer persona?) and behavioral data (e.g., How often is this contact on our website, or has she registered for an event recently?). As the contact engages with your brand through various programs, his or her behavioral score improves, which can indicate intention and prioritize action for sales and marketing. By passing a certain scoring threshold, that contact becomes an MQL. Figure 12.5 introduces a framework for thinking about lead scoring in context of category creation. The idea is that each contact in your database can be organized into four buckets, indicating where the contact is in the journey with your brand. Figure 12.5 Lead Scoring Framework for New Categories The idea is that contacts receive a demographic score when they enter your database initially as a conversion. A buyer or influencer from a target account, for example, would likely rank in the upper quartile of the vertical axis, rather than an individual contributor from a vertical outside of your core market in the lower quartile. Once someone becomes a conversion, her ongoing engagement with your brand will move the behavioral score left and right on the horizontal axis, with an arbitrary threshold in the middle that separates the two columns. Here’s how the different cohorts break down in order of priority: Once you’ve made sense of your database, you are now ready to run programs to uncover buying intent for your product. Even the most engaged contacts (Pure Golds and Groupies) can appear to have bought into your value proposition, but are not actually empowered to buy product. You’ve won their hearts, but you won’t be successful in bridging to funnel two until you’ve won their minds. Here are some of the hacks you can deploy to aid in that effort: These hacks are characterized as “late stage” content assets and campaigns, which, as I described in Chapter Six, are typically either locked behind a gate or in a content management system for the sales team to use in deal cycles. In order to build the bridge into funnel two, category creators need to create widespread awareness and urgency around their product value by promoting these assets at the very top of the funnel. Social, blog posts, email—these evangelism channels are typically reserved for early stage content about the category (and not your products), but are appropriate channels to win the minds of your market and enable them to self-actualize in your category to an even greater degree through the use of your products and services. As they engage with late stage content, make sure to apply the appropriate weighting to those moments, as they are even stronger indicators of buying interest than early stage signals. Category creation programs drive growth—but the truth is that each market will have its own nuance. Use the tools presented in this chapter as a means of measuring the success of your programs and communicating the impact of your efforts on growth, but a spirit of humility will serve you well on your journey. Marketers will benefit from taking a servant leadership position with their Sales counterparts—anticipating their needs and putting their sellers in a position to win. Sales will benefit from sharing their learning with Marketing. But these two constituencies are only two of the many actors who contribute to, and benefit from, category creation—and as Einstein said, “Not everything that counts can be counted.” Our final chapter will explore the intangible benefits of category creation, particularly the impact on its most important benefactors—customers and teammates.
Funnel Stage
Definition
Conversions
Conversions are individuals who have decided to visit one of your web properties and identify themselves to your brand in exchange for information. Each conversion is someone new to your marketable database. Consider an example where an unknown person visits Google and searches “VP Customer Success job description.” She lands on a Gainsight blog post that has a sidebar element for a download. She enters her name and email address to get access to the content—signaling that she is interested in learning more about the thought leadership you are providing (funnel one).
Marketing Qualified Leads (MQLs)
MQLs are conversions who are signaling buying intent—typically this means interest in your products or services (funnel two). This can occur from a drip sequence, form checkbox, request a demo button, direct response PPC (pay-per-click) ad, or if a behavioral activity has pushed his lead score over the threshold for an MQL. In this case it’s important to remember that a contact could be both a conversion and an MQL at the exact same time—for example, imagine an unknown person clicking on a PPC ad and landing on a page where the CTA is to request a demo and he completes the form. If that is the first contact that we have ever had with that person, he would be a conversion, but also an MQL.
Sales Qualified Leads (SQLs)
SQLs are MQLs that some qualification team—typically Sales Development or SDRs—decides are ready for an account executive (AE) to engage. These teams are operating on an agreed-on set of qualification criteria in order to determine which contacts are actively in market for your products and are willing to take a meeting with a sales professional. If an MQL gets thrown out and never becomes an SQL, that doesn’t mean they shouldn’t be marketed to; it simply means she isn’t yet ready for sales. We’ll talk about what to do with those folks later on in the chapter.
Sales Accepted Leads (SALs)
SALs are SQLs that are “accepted” by AEs and are considered active sales opportunities in the pipeline. There are a countless number of sales processes that companies can implement to progress SALs from early stage pipeline to late, and finally to “Closed Won” revenue—each methodology with its own merits. Marketing’s job is not done when the opportunity is created, especially in new categories where prescriptive education on how to think about purchasing and deploying new products is critical to doing deals.
Closed Won
A signed contract! Congratulations, you’ve successfully brought a new customer on board or have closed a renewal or expansion opportunity with an existing customer.
Six Growth Outcomes Impacted by Category Creation
1. Marketable Database Growth
2. Marketing Database Engagement
3. Pipeline Creation (Sourcing)
4. Pipeline Acceleration (Influence)
5. New Business ARR
6. Expansion ARR
Case Study on Growth: The Gainsight Pulse Conference
How to Build a Bridge into Funnel Two
Notes