
This chapter does not cover one particular topic of the Certified OpenStack Administrator exam requirements. Instead, it shows general troubleshooting practices for OpenStack. Please note that backing up OpenStack instances is discussed in Chapter 9, and analyzing storage status is discussed in Chapters 5, 7, and 9.
The Main Principles of Troubleshooting
Troubleshooting OpenStack is not often straightforward because it consists of many separate projects that work with one another in different combinations. That is why the troubleshooting discussion is near the end of this book. You need to know the previous material before you learn the troubleshooting techniques.
- 1.
Define the problem clearly as you can. You may want to make sure the issue is reproducible.
- 2.
Collect all relevant information. It can be log files, debug output, etc.
- 3.
Form a hypothesis based on observed symptoms.
- 4.
Test the hypothesis. You can start from the easiest to test or from a theory with a higher probability or mix.
- 5.
Try to fix issues based on tests.
- 6.
The process must be restarted from the top of the proposed fixes that do not resolve the case.
You should be aware of the concerns about generic debugging. Always make a backup copy of your configuration file before you begin changing it. It is very important to make only one change at a time. Finally, do not forget to revert your configuration files to the original if any test is unsuccessful.
Basic GNU/Linux Troubleshooting Commands
GNU/Linux Command | Useful Options and Examples |
|---|---|
ps: Report list of the current processes | To see every process on the system, use the aux option. It can be useful with the grep command for searching exact processes, or you can use pgrep. |
# ps aux | grep cinder cinder 1400 0.6 0.3 354936 126036 ? Ss 08:52 1:19 /usr/bin/python3 /usr/bin/cinder-api --config-file /usr/share/cinder/cinder-dist.conf --config-file /etc/cinder/cinder.conf --logfile /var/log/cinder/api.log | |
top: Shows a dynamic view of the system processes. Unlike the ps output, this command continuously refreshes the view. | You can use interactive keystrokes in the top environment. ? - help, q - quit, l - toggles for load header line, t - toggles for threads header line, m - toggles for memory header line, u - filter process for user name, M - sorts process listing by memory usage in descending order, P - sorts process listing by processor utilization in descending order, k - kill a process. |
df: Reports file system disk space usage. | Usually, df is used with the -h option, which means human-readable format (e.g., 1K 234M 2G) |
# df -h Filesystem Size Used Avail Use% Mounted on devtmpfs 16G 0 16G 0% /dev tmpfs 16G 4.0K 16G 1% /dev/shm tmpfs 6.3G 50M 6.3G 1% /run /dev/mapper/cs-root 60G 9.0G 51G 15% / /dev/vda1 1014M 266M 749M 27% /boot /dev/mapper/cs-home 30G 331M 29G 2% /home | |
du: Estimate file space usage | The same -h option as in df is often used. |
# du -h /var/lib/glance/images/ 889M /var/lib/glance/images/ | |
ip: Show/manipulate routing, devices, policy routing, and tunnels | The most common subcommands are show - for displaying IP information, route - for showing routing information. |
# ip addr show ens3 2: ens3: <BROADCAST,MULTICAST,UP,LOWER_UP> mtu 1500 qdisc fq_codel state UP group default qlen 1000 link/ether 52:54:00:4e:51:9f brd ff:ff:ff:ff:ff:ff altname enp0s3 inet 192.168.122.10/24 brd 192.168.122.255 scope global dynamic noprefixroute ens3 valid_lft 2923sec preferred_lft 2923sec inet6 fe80::5054:ff:fe4e:519f/64 scope link noprefixroute valid_lft forever preferred_lft forever | |
ss and netstat: Utilities to investigate sockets | The ss command is similar to the netstat command and is used to display socket statistics. They have similar options. Options are -t - show TCP sockets, -u - show UDP sockets, -a - show listening and established sockets, -p - show process using the sockets. |
# ss -ta State Recv-Q Send-Q Local Address:Port Peer Address:Port LISTEN 0 128 *:8776 *:* LISTEN 0 128 *:25672 *:* LISTEN 0 128 *:8777 *:* LISTEN 0 128 10.0.2.15:27017 *:* LISTEN 0 64 10.0.2.15:rsync *:* LISTEN 0 50 *:mysql *:* | |
find: Search for files in a directory hierarchy | There are many options for the find utility: -name - find by name, -iname - like -name, but the match is case insensitive, -group and -user - find file that belongs to group or user, -type with f or d to find only files or directories. |
# find /etc -name swift* /etc/swift /etc/swift/swift.conf /etc/logrotate.d/openstack-swift | |
Traditionally, network interfaces are enumerated as eth0,1,2... In most modern Linux distributions, the default naming behavior can differ. The names of interfaces can be based on device topology, type, and firmware. For example, the ethernet interface on PCI slot 0 and port 3 can be named enp0s3.
Checking the OpenStack Version
It is always good to know which version of the OpenStack environment you are working with. Before the Liberty version, all projects except Swift had a version based on the year and month. Starting with Liberty, all components have a traditional version structure, X.Y.Z., where X is always the same in one release.
OpenStack Releases
Series | Releases | Initial Release Date |
|---|---|---|
Victoria | Nova 22.0; Keystone 18.0; Neutron 17.0; Swift 2.26 | October 14, 2020 |
Wallaby | Nova 23.0; Keystone 19.0; Neutron 18.0; Swift 2.27 | April 14, 2021 |
Xena | Nova 24.0; Keystone 20.0; Neutron 19.0; Swift 2.28 | October 6, 2021 |
Yoga | Nova 25.0; Keystone 21.0; Neutron 20.0; Swift 2.29 | March 30, 2022 |
Zed | Nova 26.0; Keystone22.0; Neutron 21.0; Swift 2.29 | October 5, 2022 |
Finding and Analyzing Log Files
As you see, parts of the content are directories, and other parts are files. If one of the services has more than one log file, usually, such logs are placed in their own subdirectory. For example, the /var/log/cinder/ directory contains five files for several Cinder subsystems. You see that the files’ names have -YYYYMMDD at the end. They are compressed by the Gzip tool. Usually, your lab must be one week old to find such compressed files. The logrotate utility renames, rotates, and compresses old logs. Instructions for logrotate are stored in the /etc/logrotate.d/ directory and /etc/logrotate.conf contains the configuration file.
The logging subsystem of GNU/Linux is based on the syslog protocol. In modern distributions the rsyslog and journald services in charge of logging.
The systemd-journald service is based on the operating system event logging architecture. It collects event messages from different sources like the Linux kernel, standard output, and standard error from daemons, boot messages, and syslog events. Then it converts them into a common format and writes them into a structured, indexed system journal. The rsyslog service reads syslog messages received by systemd-journald from the journal. It then records them to its log files under the /var/log directory or forwards them to other services according to its configuration.
messages: Most of the syslog messages are stored in this file.
secure: All authentication-related and security messages are stored here.
cron: The log file related to periodically executed jobs.
The first part of the message is the timestamp, then the priority, the name of the host, then the name of the program that sends the message, and the last part is a message.
A -f /var/log/logfilename command tail is useful for real-time log monitoring. This command prints the last ten lines of a log and continues to output new lines as they are added to this log file.
Backing up the Database Used by an OpenStack Instance
The mysqldump command asks for a password. You can avoid this by adding the –p option with the password; for example, –p apress.
Analyzing Host/Guest OS and Instance Status
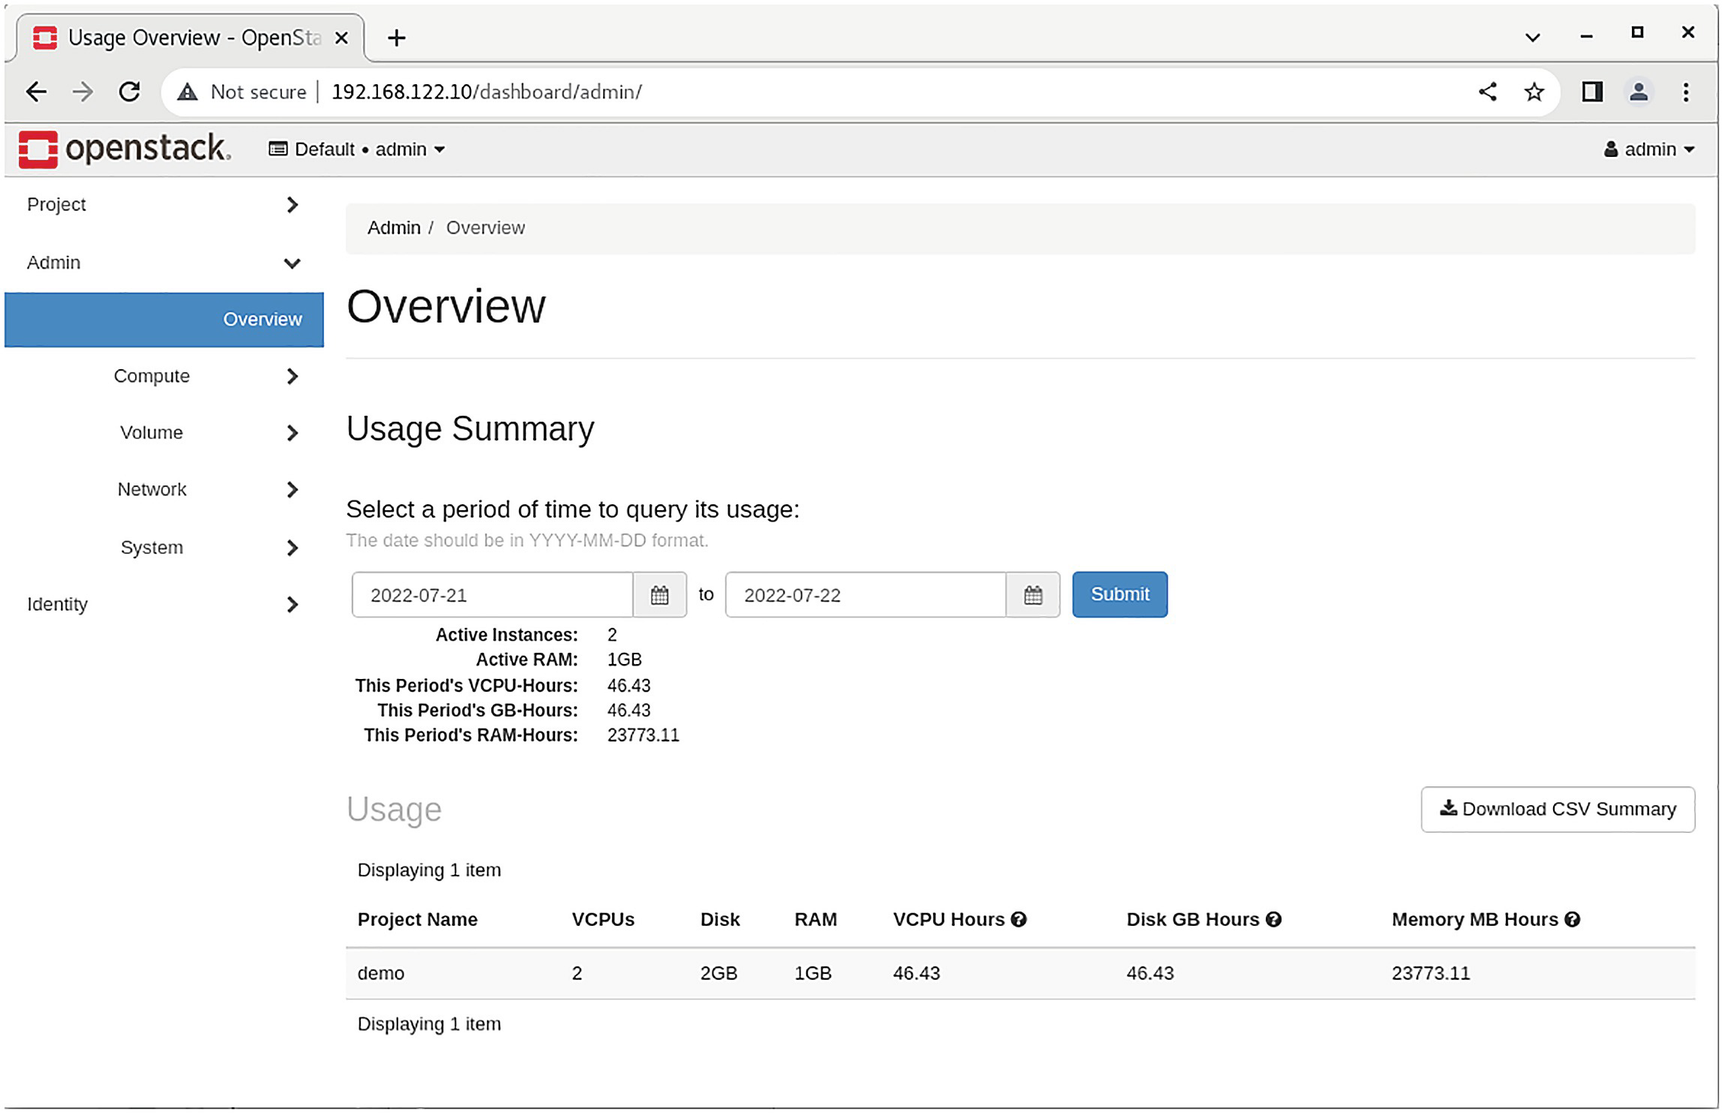
A screenshot represents a web page interference of OpenStack, wherein the main menu under the admin tab, the overview option is selected and explains the usage summary.
OpenStack usage summary

A screenshot of the OpenStack dashboard depicts the direction of the hypervisor summary.
Hypervisor usage summary
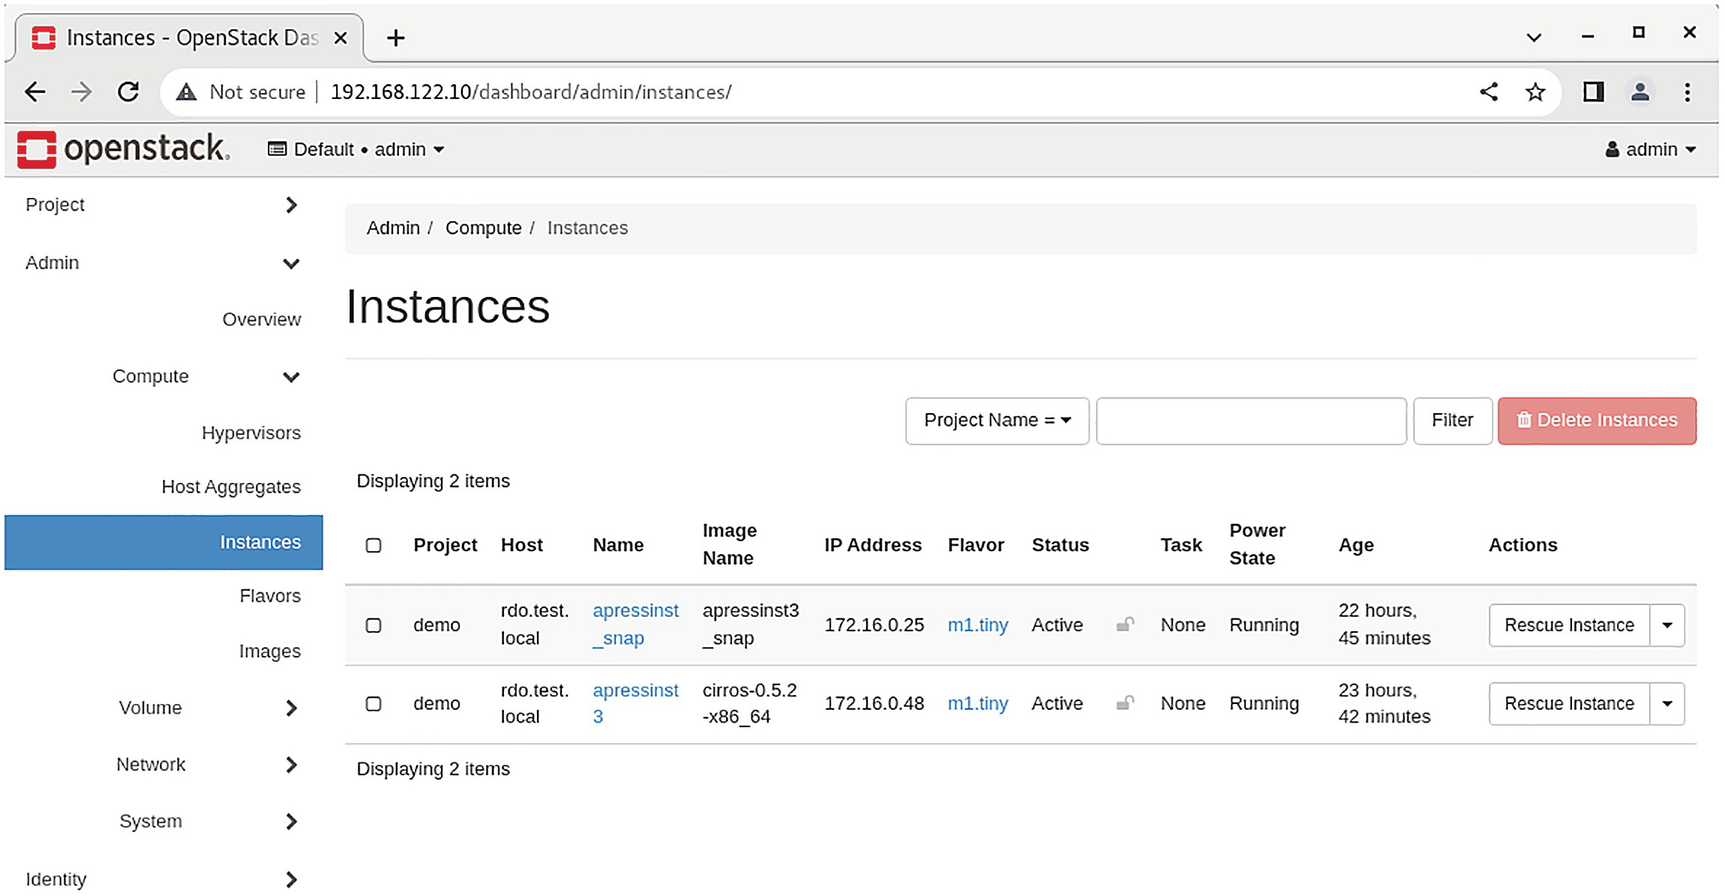
A screenshot of the OpenStack dashboard depicts the instances on the right.
All instances summary
Analyzing Messaging Servers
As mentioned earlier, a messaging server is used by almost all OpenStack services. Nowadays, the most common messaging server for OpenStack is RabbitMQ. Alternatives for RabbitMQ are Qpid and ZeroMQ. For transmitting information between OpenStack services, these servers use AMQP (Advanced Message Queuing Protocol). Let’s briefly go over the functions of RabbitMQ.
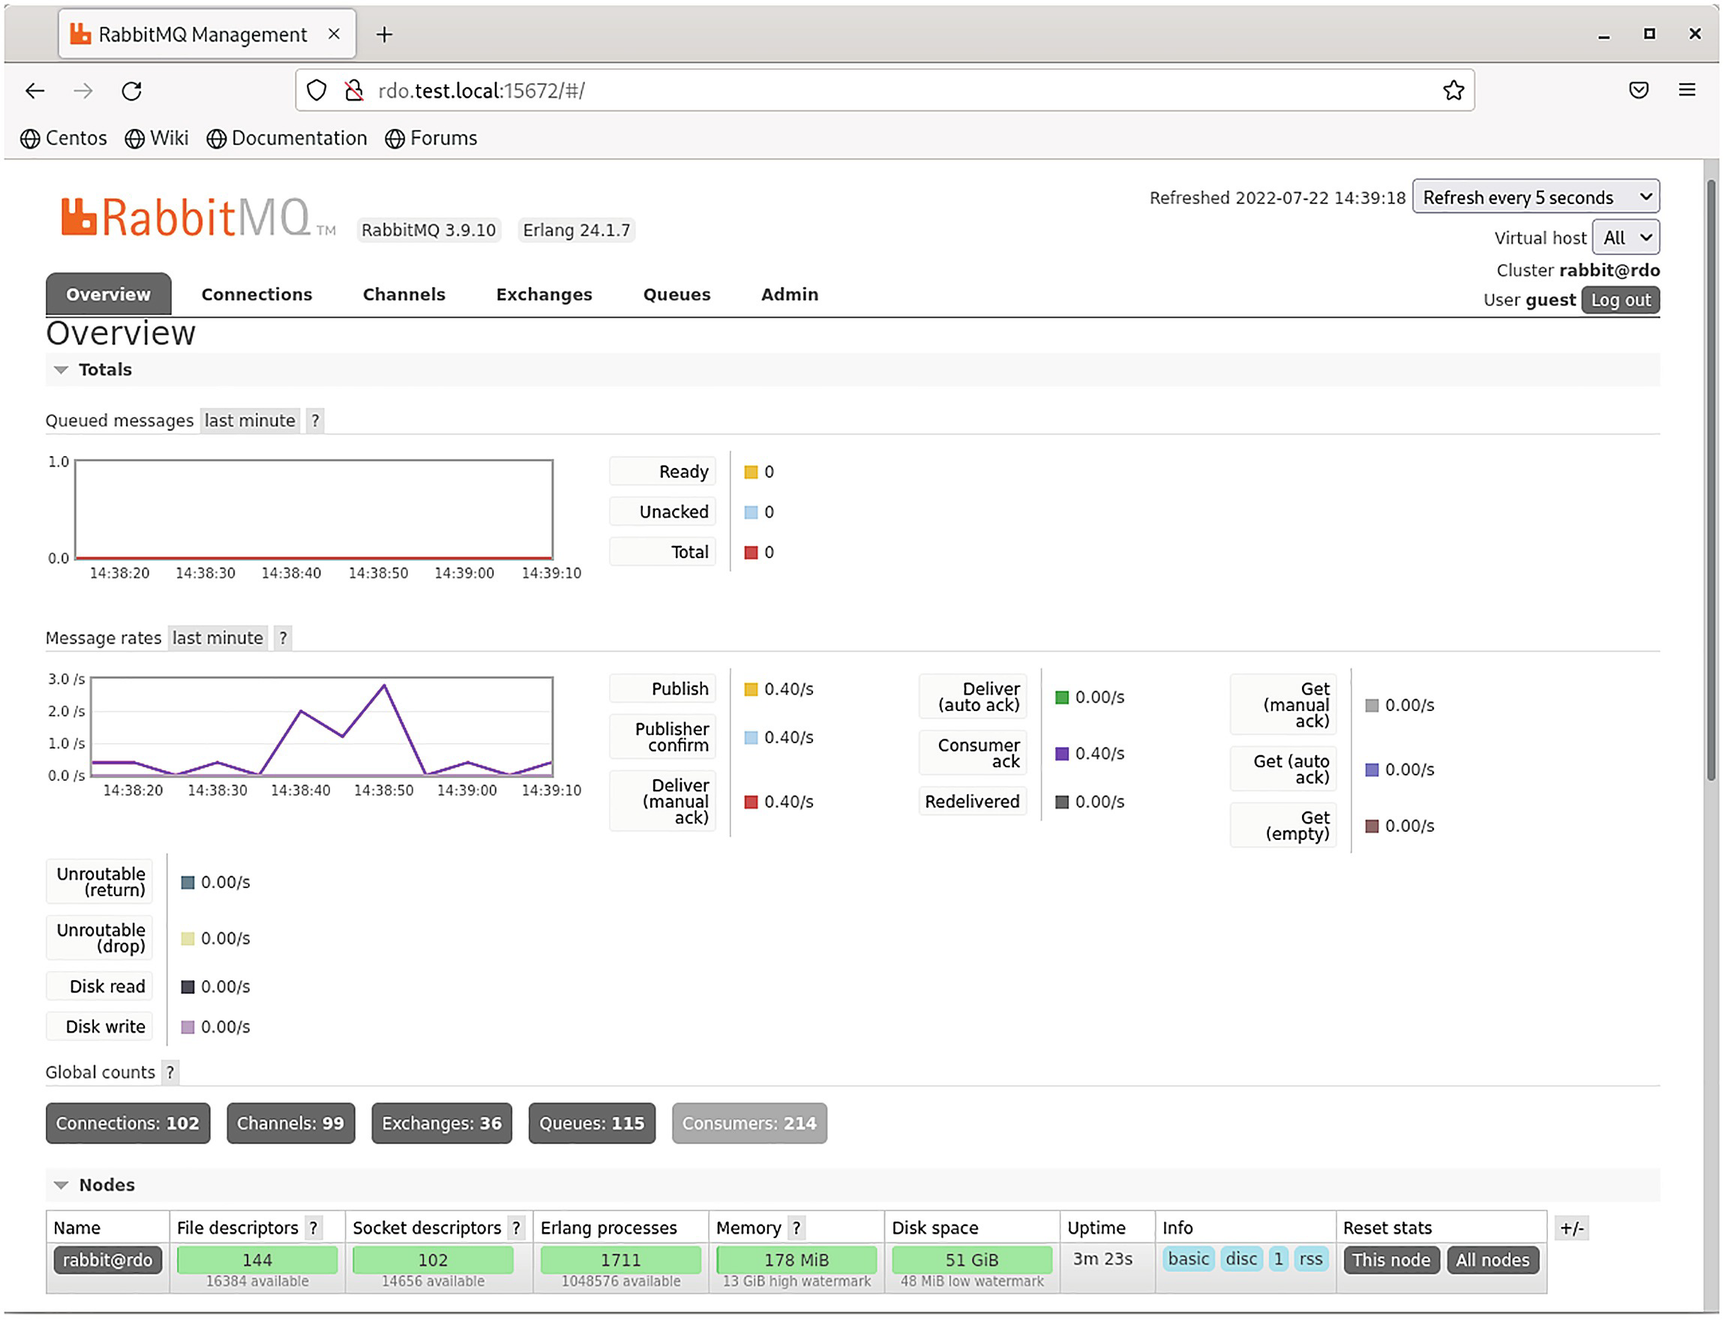
A screenshot of the rabbit MQ web plug-in dashboard depicts the overview.
RabbitMQ web plug-in
Analyzing Network Status
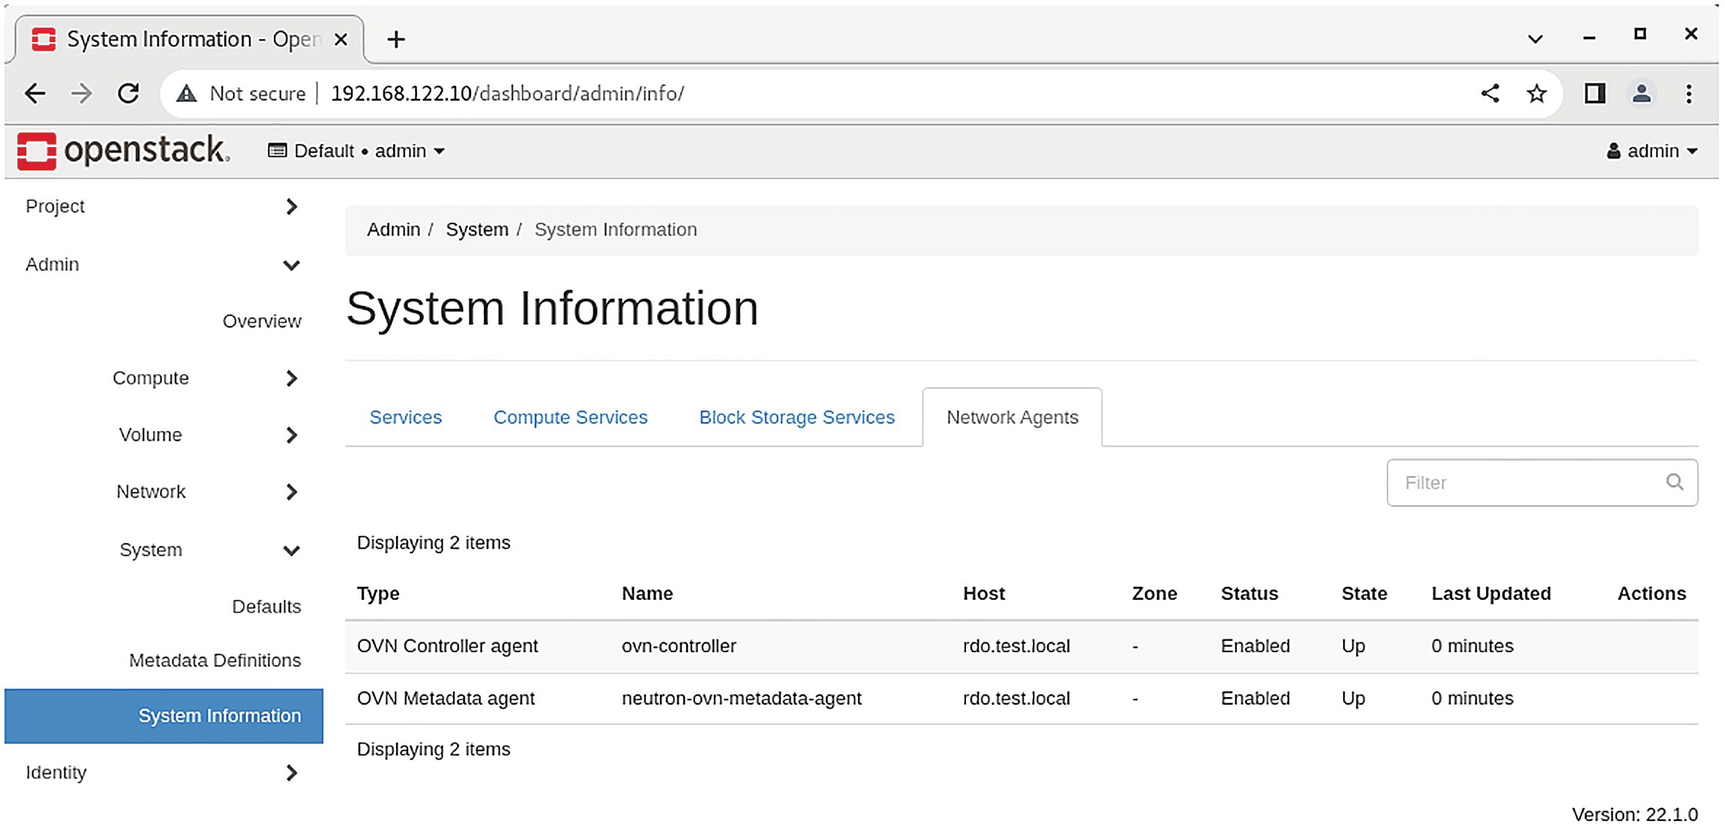
A screenshot of the OpenStack dashboard depicts the system information on the right.
OpenStack Neutron agents list

A screenshot of the OpenStack dashboard depicts the system information on the right.
OpenStack networks page
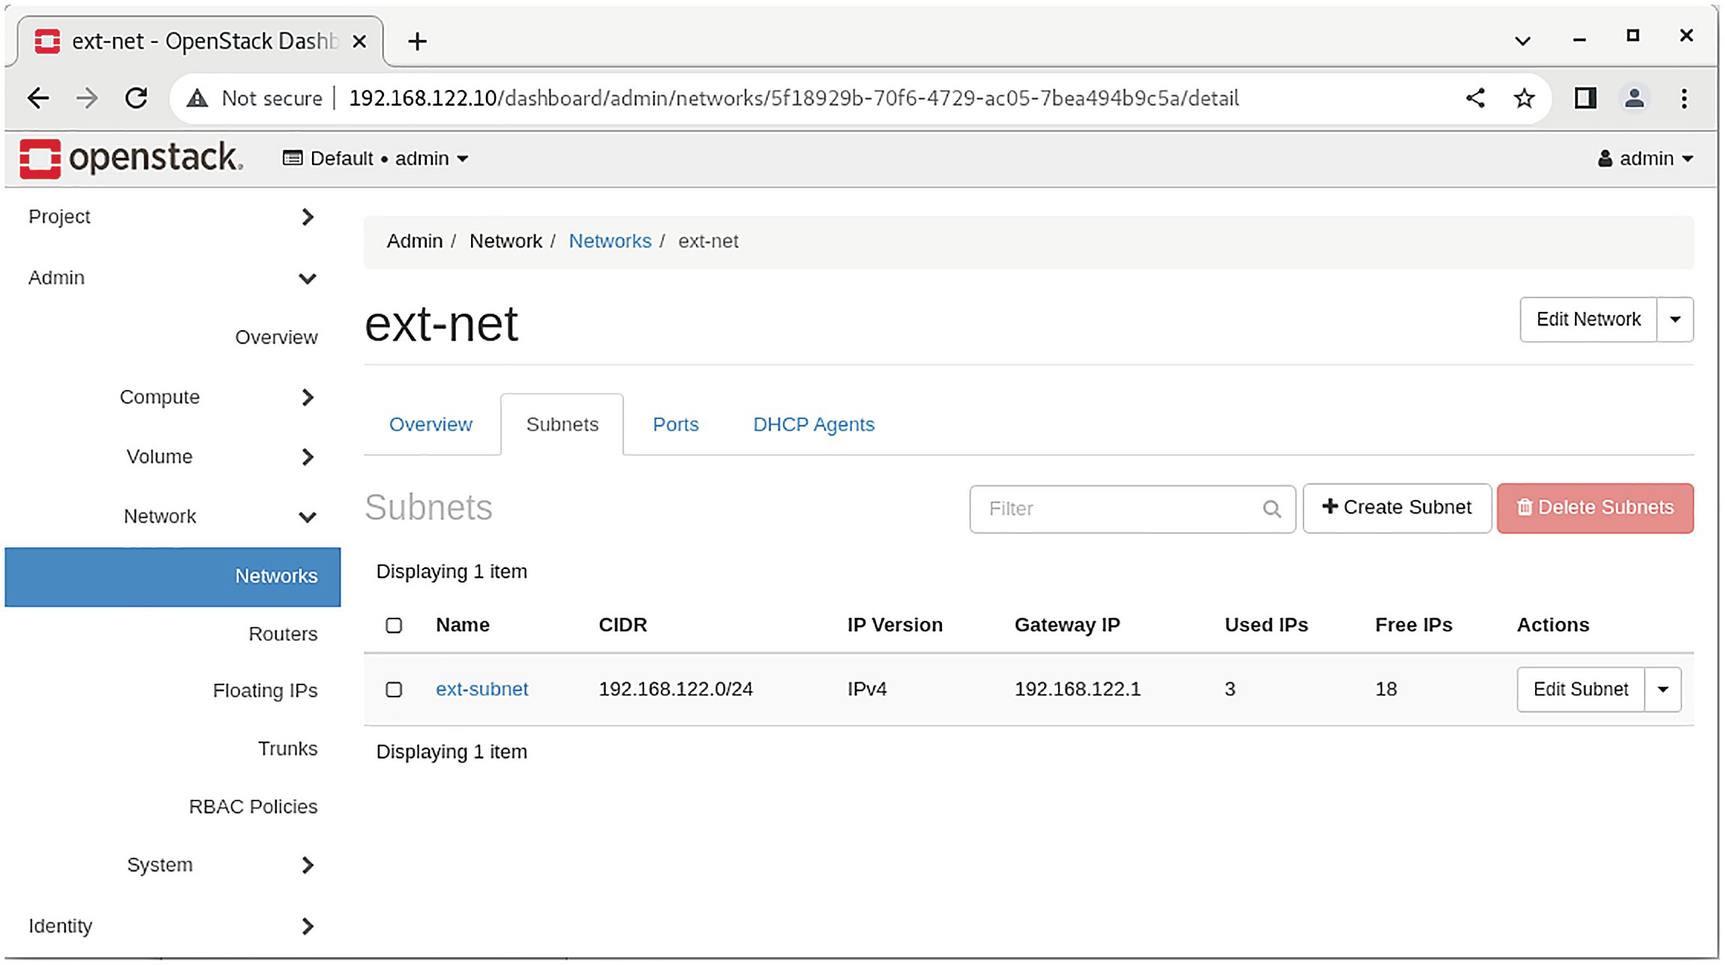
A screenshot of the OpenStack dashboard depicts the subnets of the ext-net network on the right.
Network overview details

A screenshot of the OpenStack dashboard depicts the network status.
OpenStack routers
For real-world network problems and troubleshooting, the utility plotnetcfg can be useful. It creates a network configuration diagram that can be visualized with the help of the dot utility. For more information, check the project website (https://github.com/jbenc/plotnetcfg).
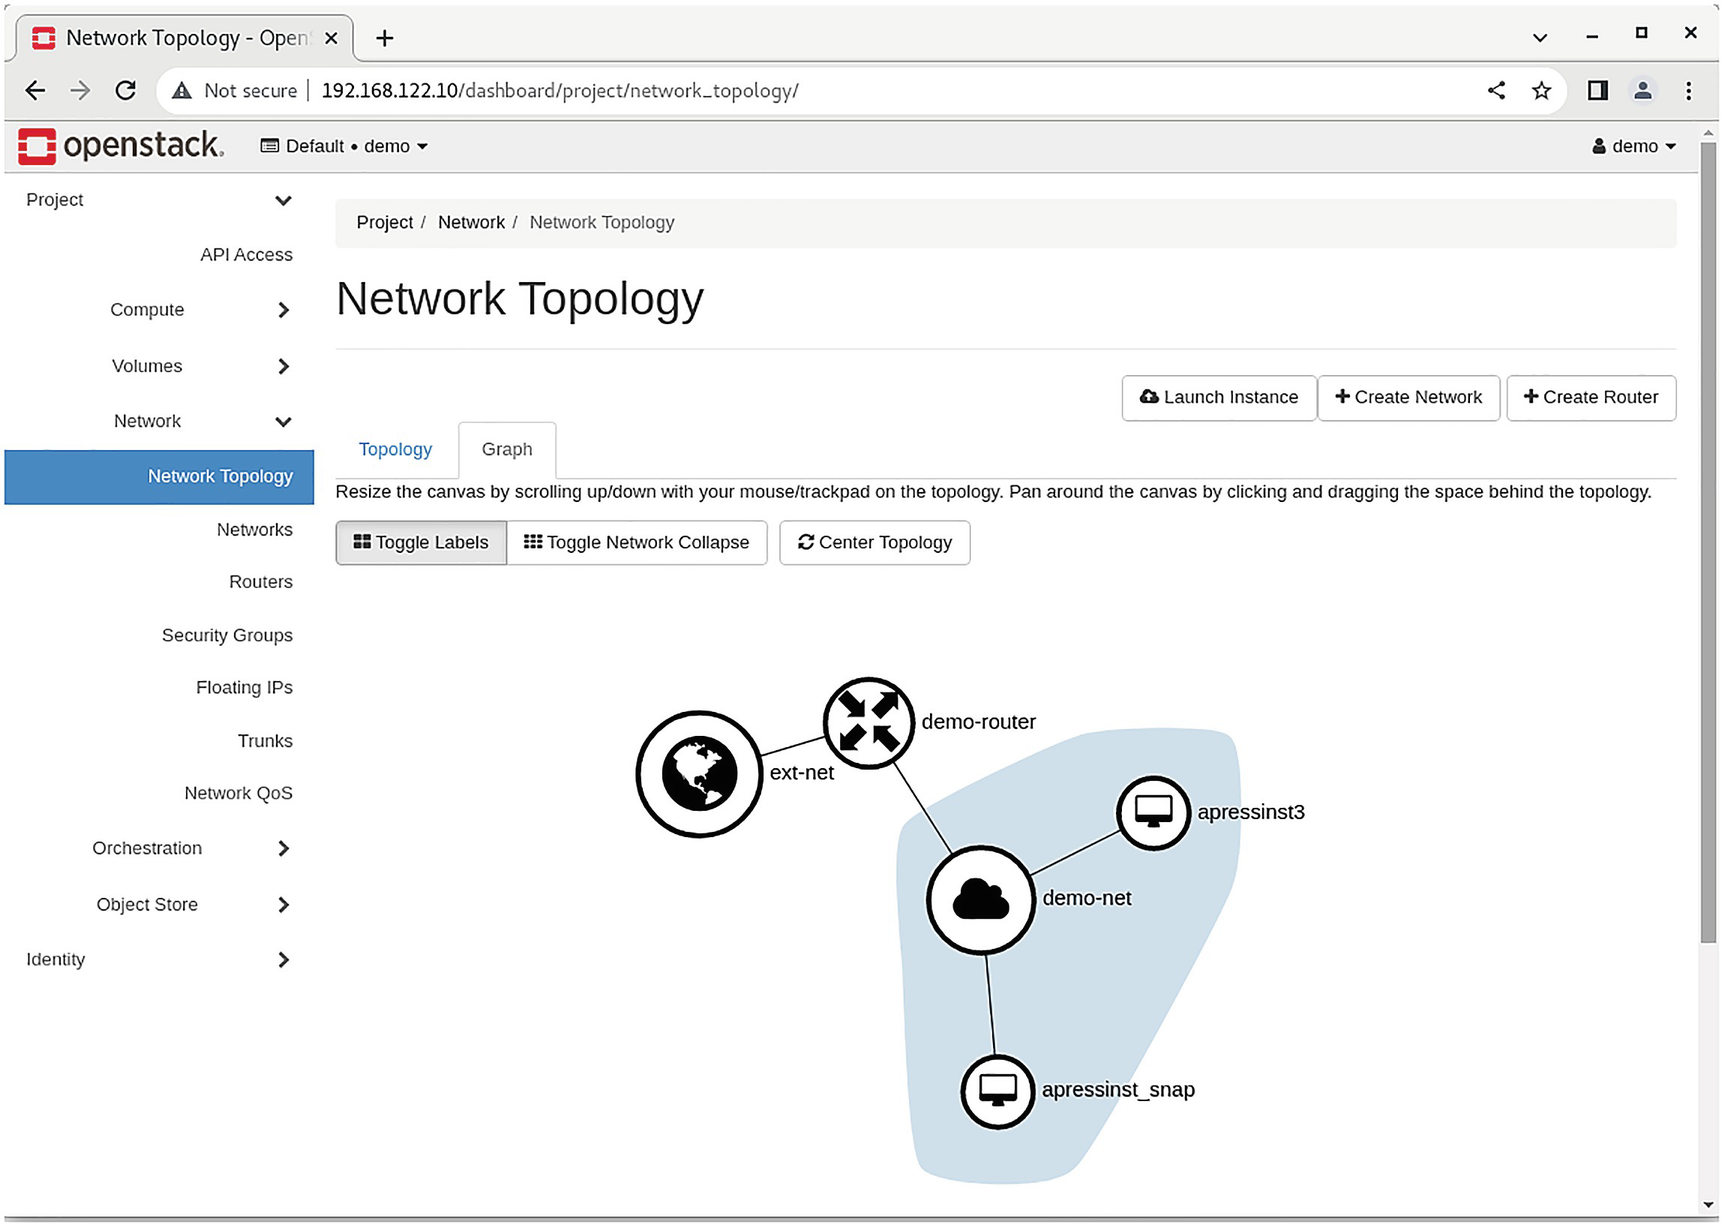
A screenshot of the OpenStack dashboard depicts the graph on the right.
Project Network Topology tab
Digesting the OpenStack Environment
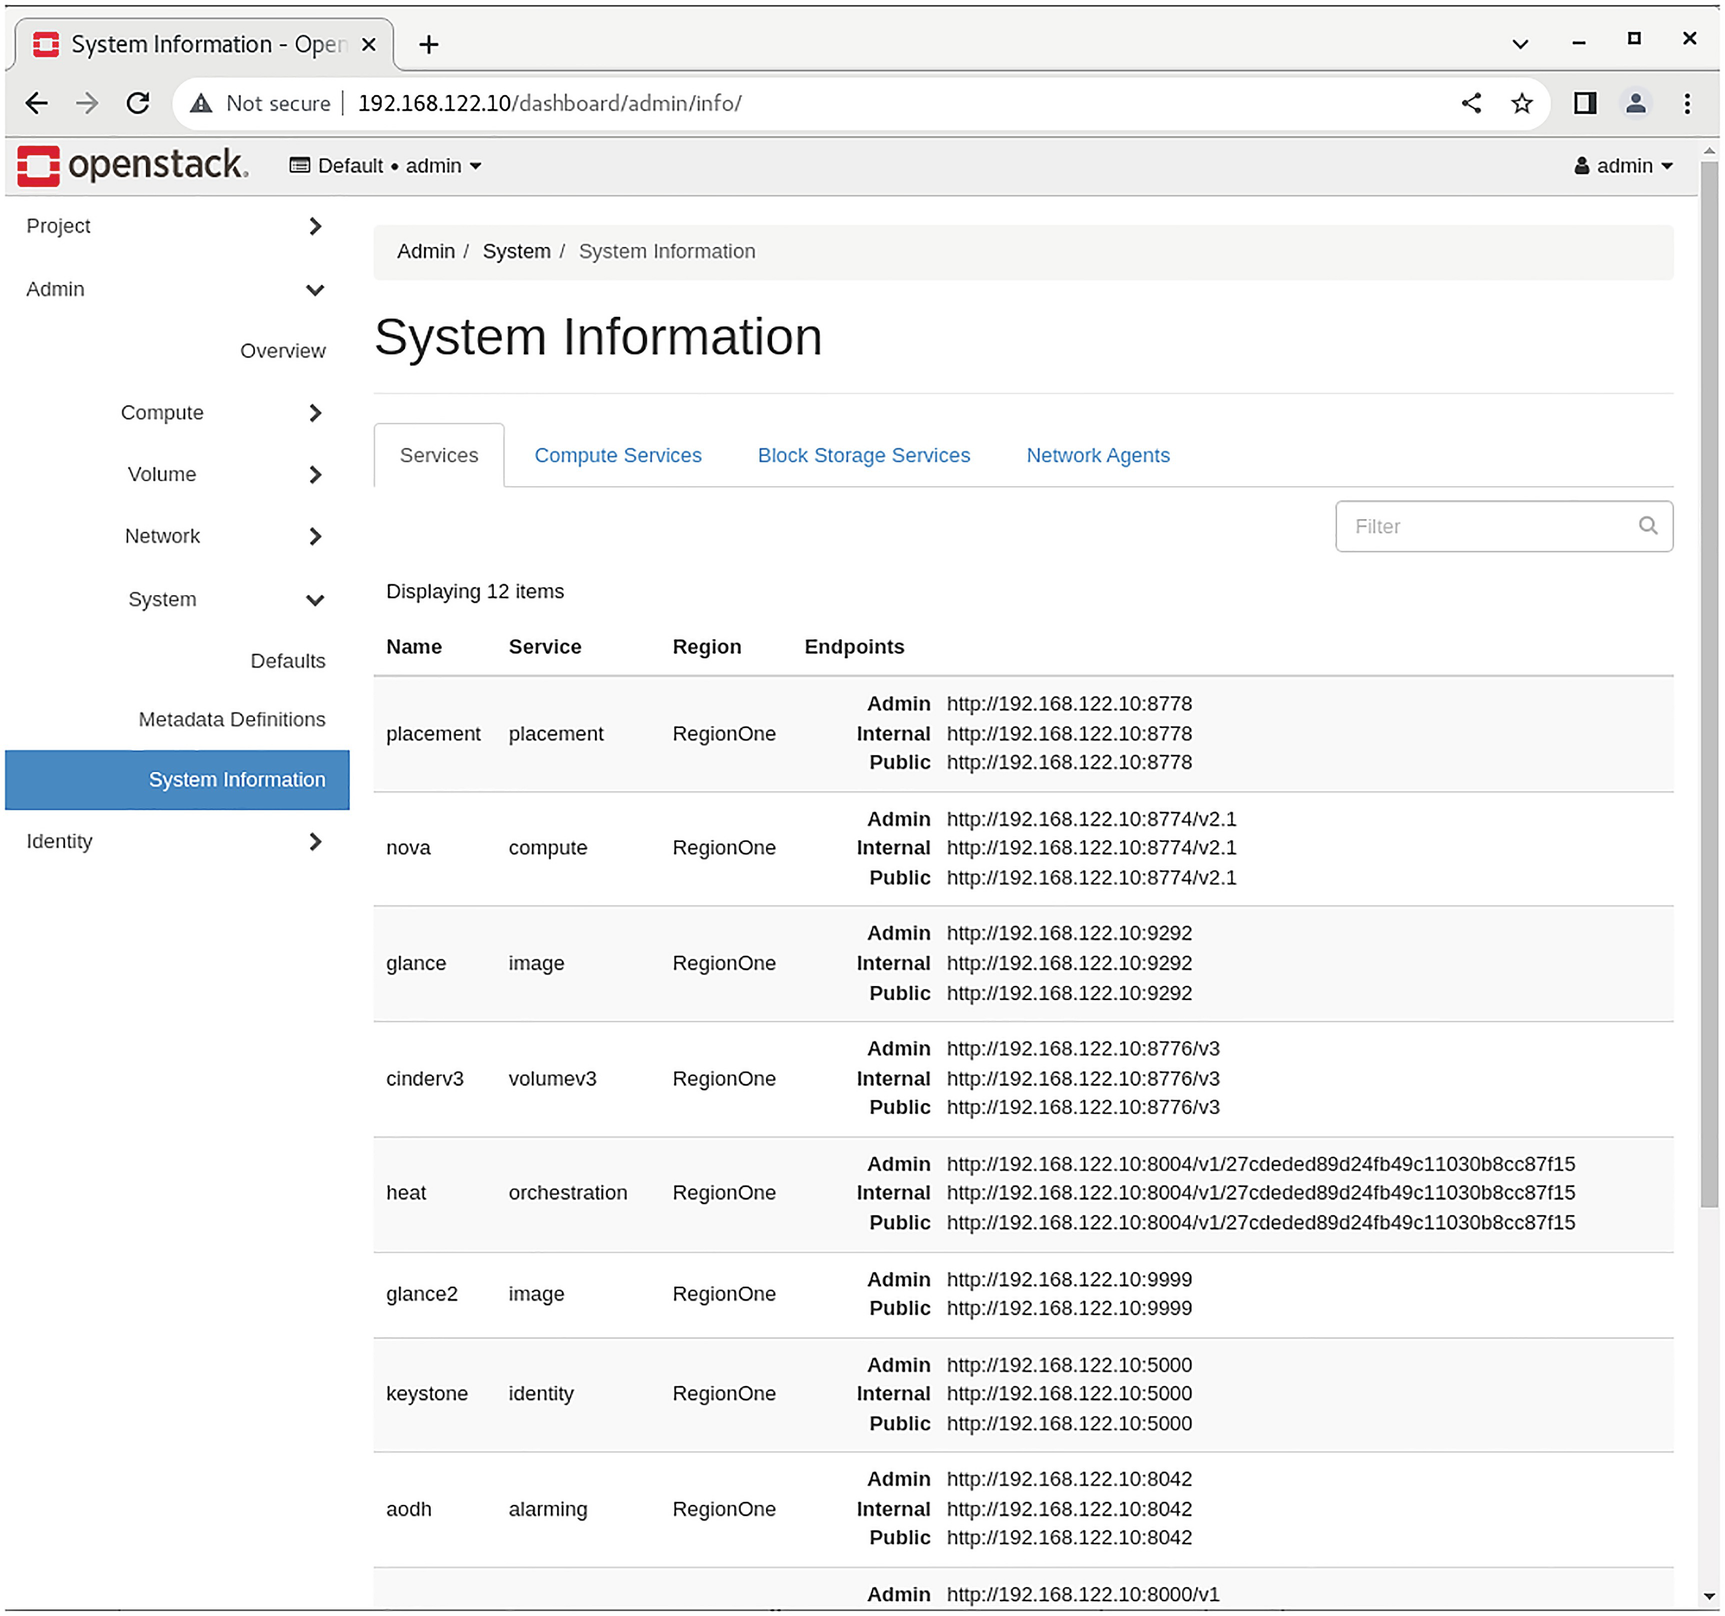
A screenshot of the OpenStack dashboard depicts the system information.
OpenStack services information
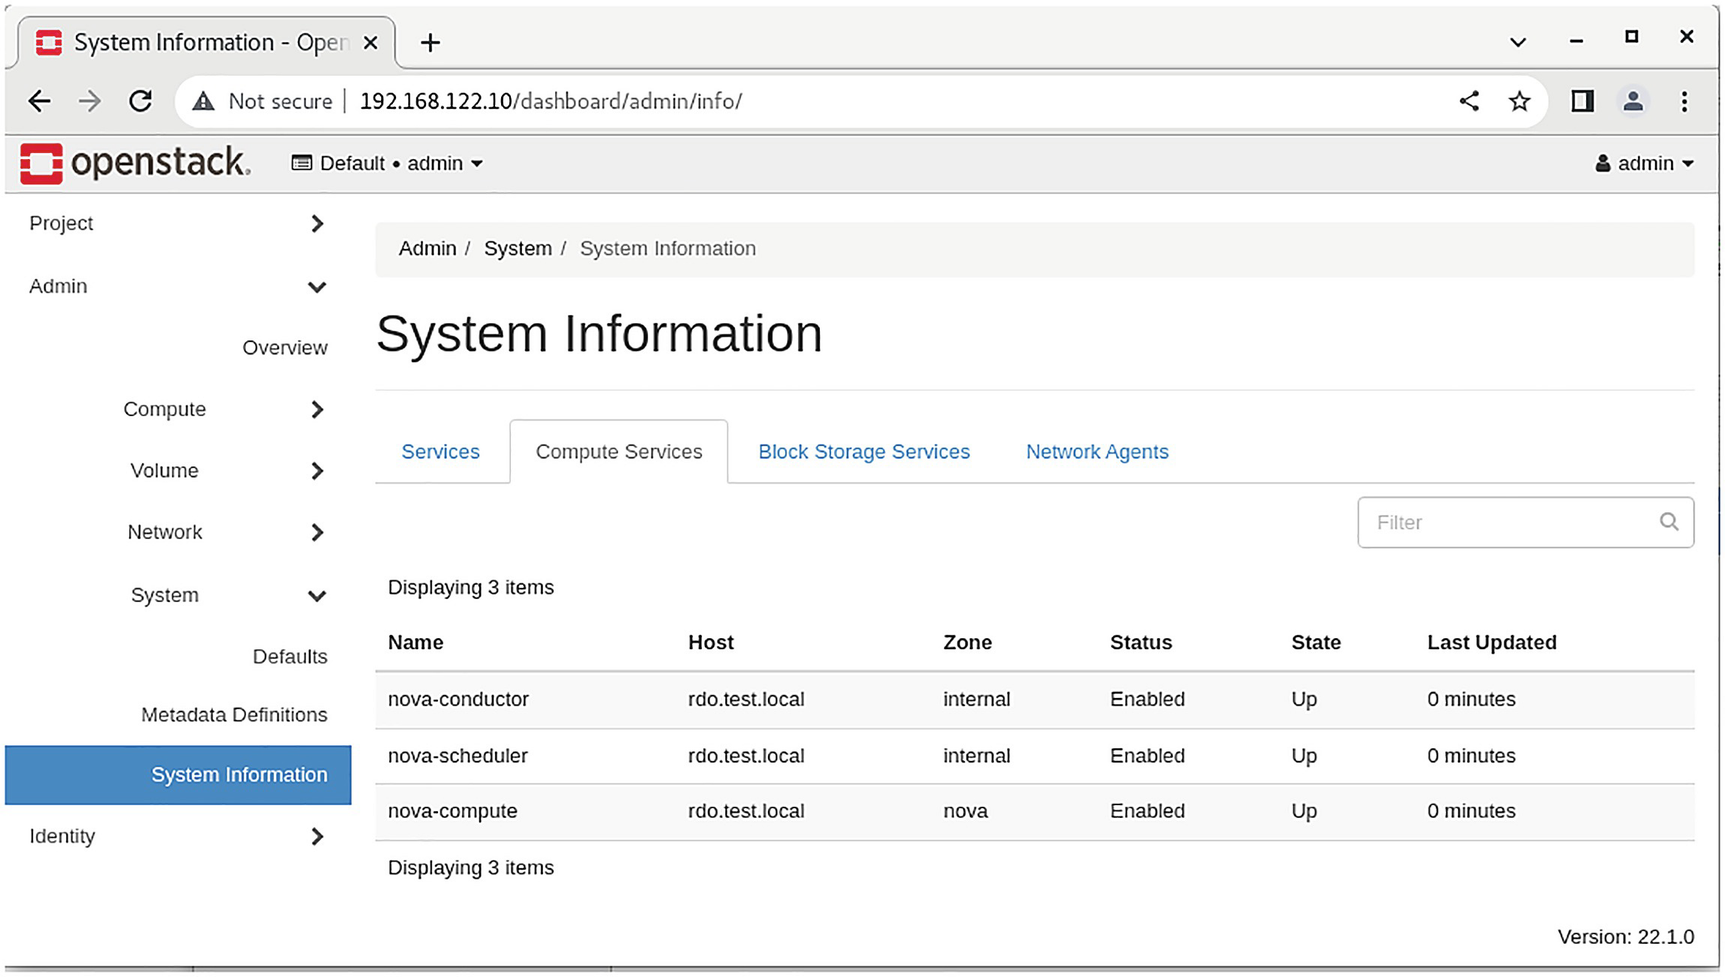
A screenshot of the OpenStack dashboard depicts the system information.
OpenStack compute services
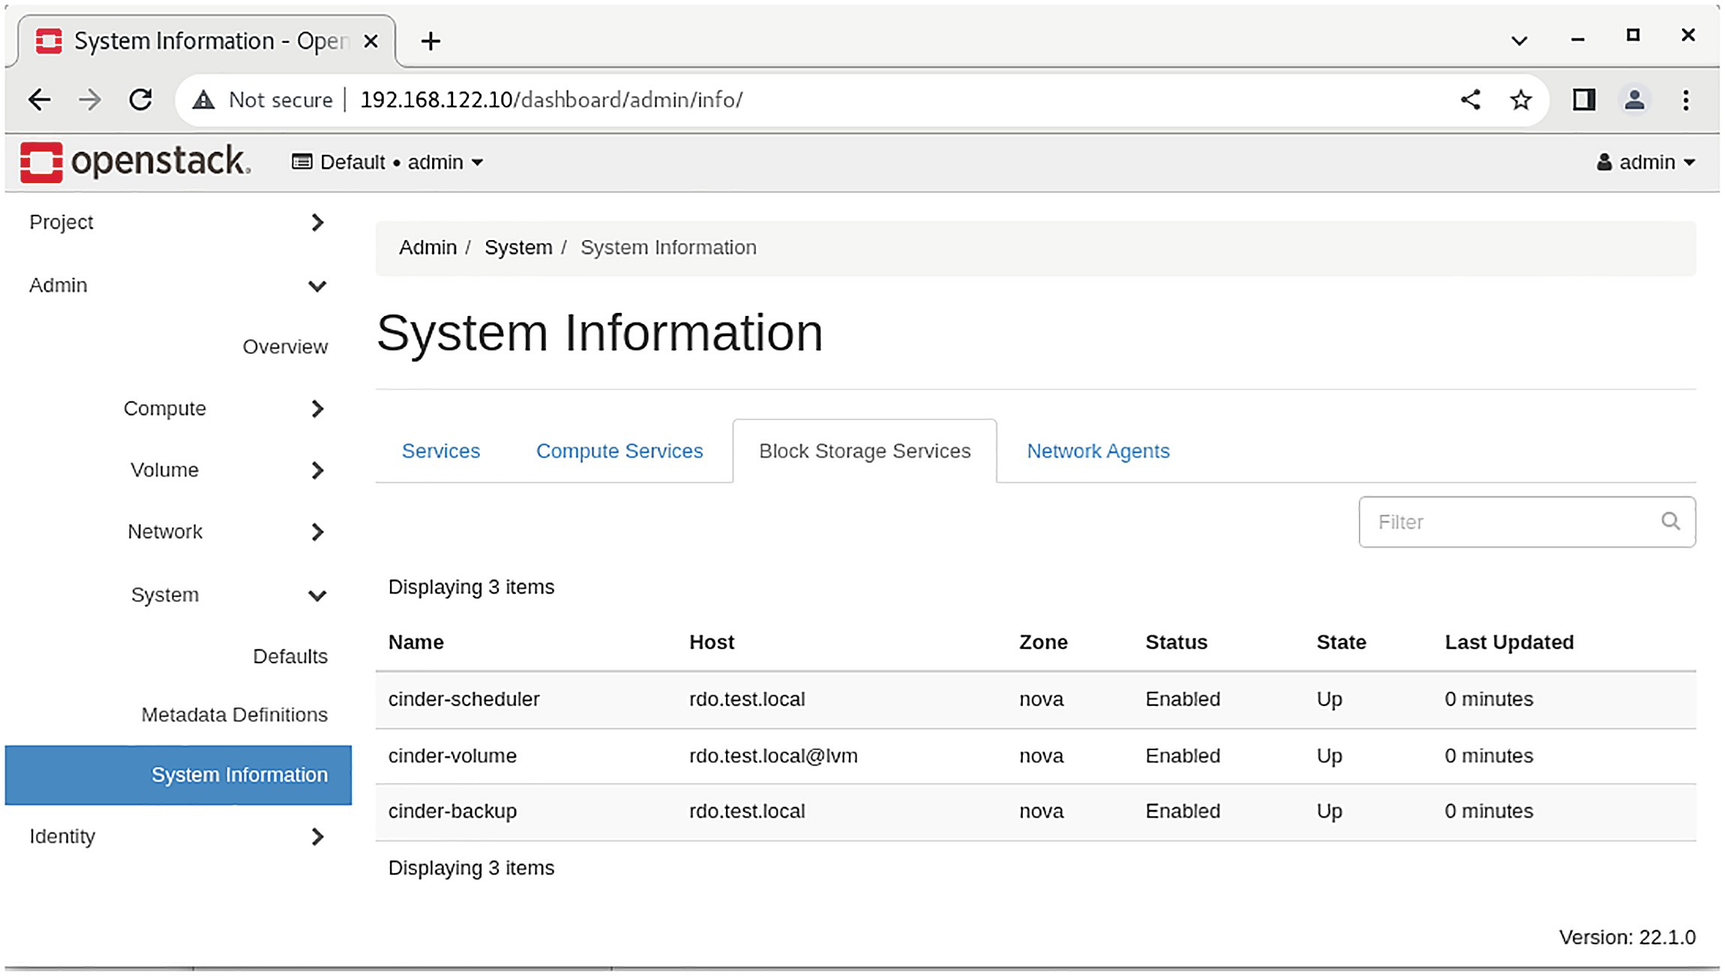
A screenshot of the OpenStack dashboard depicts the system information.
OpenStack block storage services
Summary
A troubleshooting topic is bigger than one particular chapter or even book. Solid knowledge of GNU/Linux is needed. In the past, troubleshooting was a separate topic of the exam. In general, you still need troubleshooting skills as part of the exam.
Review Questions
- 1.Which do you use to search for the identity service configuration files in a configuration directory hierarchy?
- A.
find /etc -name *keystone.*
- B.
find /etc --name heat.*
- C.
find /var --name *keystone.*
- D.
find / --name heat.*
- 2.Where would you find the messages from the Cinder service? (Choose all that are applicable.)
- A.
/var/log/messages
- B.
/var/log/cinder/api.log
- C.
/var/log/cinder/scheduler.log
- D.
/var/log/cinder/backup.log
- 3.Which backs up all the OpenStack databases?
- A.
mysqlbackup --opt --all-db > /tmp/all-openstack.sql
- B.
mysqlbackup --opt --all-databases > /tmp/all-openstack.sql
- C.
mysqldump --opt --all-db > /tmp/all-openstack.sql
- D.
mysqldump --opt --all-databases > /tmp/all-openstack.sql
- 4.Which enumerates all the compute hosts? (Choose all that are applicable.)
- A.
openstack hypervisor list
- B.
openstack host list
- C.
nova host-enumerate
- D.
nova hypervisor-list
- 5.Which provides a list of all virtual machines?
- A.
openstack vm list
- B.
openstack server list
- C.
openstack host list
- D.
openstack instance list
- 6.Which checks the status of the RabbitMQ messaging server?
- A.
rabbitmqctl stat
- B.
rabbitmq status
- C.
rabbitmqctl status
- D.
rabbitmq state
- 7.Which checks the status of the Neutron agents?
- A.
openstack network agent list
- B.
neutron plugin-list
- C.
openstack agent list
- D.
openstack network list
- 8.Which gives the details of a given router?
- A.
neutron router list router
- B.
neutron router show router
- C.
openstack router list router
- D.
openstack router show router
Answers
- 1.
A
- 2.
A, B, C, D
- 3.
D
- 4.
B, D
- 5.
B
- 6.
C
- 7.
A
- 8.
D