Introduction: Using Excel 2010 to Create Charts
Good charts should both explain and arouse curiosity. A chart can summarize thousands of data points into a single picture. The arrangement of a chart should explain the underlying data but also enable the reader to isolate trouble spots worthy of further analysis.
Excel makes it easy to create charts. Even though the improvements in Excel 2010 enable you to create a chart with only a few mouse clicks, it still takes thought to find the best way to present your data.
Choosing the Right Chart Type
Suppose you are an analyst for a chain of restaurants, and you are studying the lunch-hour sales for a restaurant in a location at a distant mall. Corporations that provide a steady lunchtime clientele during the week surround the mall. The mall does well on weekends during the holiday shopping months but lacks weekend crowds during the rest of the year.
From the data contained in the chart in Figure I.1, you can spot a periodicity in sales throughout the year. An estimated 50 spikes indicate that the periodicity might be based on the day of the week. You can also spot that there is a general improvement in sales at the end of the year, which you attribute to the holiday shopping season. However, there is an anomaly in the pattern during the summer months that needs further study.
After studying the data in Figure I.1, you might decide to plot the sales by weekday to understand the sales better. Figure I.2 shows the same data presented as seven line charts. Each line represents the sales for a particular day of the week. Friday is the dashed line. At the beginning of the year, Friday was the best sales day for this particular restaurant. For some reason, around week 23, Friday sales plummeted.
Figure I.1 This chart shows the sales trend for 365 data points.

Figure I.2 When you isolate sales by weekday, you can see a definite problem with Friday sales in the summer.
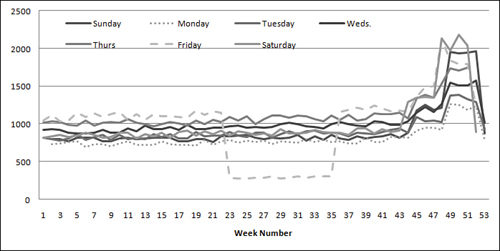
The chart in Figure I.2 prompts you to make some calls to see what was happening on Fridays at this location. You might discover that the city was throwing free Friday lunchtime concerts from June through August. The restaurant manager was offered a concession at the concert location but thought it would be too much trouble. Using this pair of charts enabled you to isolate a problem and equipped you to make better decisions in the future.
Using Excel as Your Charting Canvas
Excel 2007 offered a complete rewrite of the 15-year-old charting engine from legacy versions of Excel. Excel 2007 introduced plenty of new bugs to the charting engine. Excel 2010 fixes many of those bugs, and brings back features like pattern fills that were missing from Excel 2007. Although the software offers no new charting types, Excel 2010 provides plenty of tools that allow you to make eye-catching charts. In Excel 2010, you can create better versions of the 11 existing chart types.
Creating charts in Excel 2010 basically requires these steps:
- Set up and select your data in an Excel worksheet.
- Choose the appropriate chart type from the Insert tab.
- Change the chart layout or color scheme by using the Design tab.
- Customize chart elements by using the Layout tab.
- Micromanage formatting for individual data points by using the Format tab.
Most charts require steps 1 and 2. The remaining steps are optional and are used with decreasing frequency. It should be rare that you will need to venture to step 5. However, you are likely to customize at least a couple items in step 4.
Topics Covered in This Book
This book covers the Excel 2010 charting engine and three new types of word-sized charts called Sparklines. It also covers the Data Visualization and SmartArt Business diagramming tools that were introduced in Excel 2007.
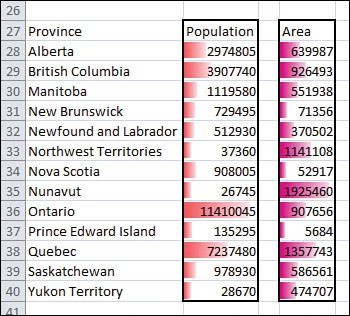
Besides charts, Excel 2010 offers many other ways to display quantitative data visually. This book explains how to use the new conditional formatting features such as data bars, color scales, and icon sets to add visual elements to regular tables of numbers. In Figure I.3, conditional formatting features make it easy to see that Ontario has the largest population and that Nunavut has the largest land area. You can also add in-cell data bars such as these with a couple of mouse clicks, as described in Chapter 9, “Using Sparklines, Data Visualizations, and Other Nonchart Methods.”
Figure I.3 In-cell data bars draw the eye to the largest values in each column.
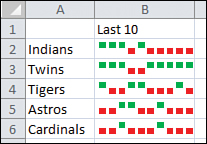
The three new types of word-sized charts in Excel 2010 called Sparklines enable you to create tiny line charts, tiny column charts, and win/loss charts. As shown in Figure I.4, these tiny charts can show win/loss events that paint a better picture than a simple 7-3 record.
Figure I.4 The Twins baseball team made the post-season in 2009 because they won 8 of their last 10 games while the Tigers struggled.
This book also takes a look at tools that you can purchase to add functionality to Excel 2010. Many vendors offer tools to create speedometer charts, supply curves, and specialized stock analysis tools. Perhaps one of the best tools is a Microsoft product called MapPoint. Using MapPoint, you can plot your Excel data in a geographic orientation on a map. See Chapter 10, “Presenting Your Excel Data on a Map Using Microsoft MapPoint,” for more information about the cool tricks available with MapPoint.
This Book’s Objectives
The goal of this book is to make you more efficient and effective in creating visual displays of information using Excel 2010.
In the early chapters of this book, you will learn how to use the new Excel 2010 charting interface. Chapters 3 through 6 walk you through all the built-in chart types and talk about when to use each chart type. Chapter 7 discusses creating unusual charts. Chapter 8 covers pivot charts, and Chapter 9 covers creating visual displays of information right in the worksheet. Chapter 10 covers mapping, and Chapter 11 covers the new SmartArt business graphics and Excel 2010’s shape tools. Chapter 12 covers exporting charts for use outside of Excel. Chapter 13 presents macro tools you can use to automate the production of charts using Excel VBA. In Chapter 14, you will see several techniques that people can use to stretch the truth with charts. Finally, Appendix A provides a list of resources that will give you additional help with creating charts and graphs.
Versions of Excel
Excel charting was largely unchanged for the dozen years leading up to Excel 2003. This book will refer to Excel 2003 and earlier collectively as “legacy” versions of Excel.
Microsoft rewrote the charting engine for Excel 2007. Excel 2010 continues with the addition of Sparklines, improvements to data bars and SmartArt, and general fixes of bugs introduced in Excel 2007. Although this book uses screen shots from Excel 2010, most of the concepts will apply equally well to Excel 2007.
Special Elements in This Book
This book contains the following special elements:
NOTE
Notes provide additional information outside the main thread of the chapter discussion that might be useful for you to know.
TIP
Tips provide you with quick workarounds and timesaving techniques to help you do your work more efficiently.
CAUTION
Cautions warn you about potential pitfalls you might encounter. It is important to pay attention to Cautions because they alert you to problems that could cause hours of frustration.
![]() A video on YouTube will demonstrate how to perform one task in most chapters.
A video on YouTube will demonstrate how to perform one task in most chapters.
DESIGNING LIKE THE PROS
Throughout the book, several non-Excellers were asked to contribute charts unlike those found in Excel. After showing the designer’s chart, you can walk through how to adjust the Excel settings to create a chart that approximates the designer’s chart.
Next Steps
Chapter 1, “Introducing Charts in Excel 2010,” presents the new Excel 2010 interface for creating charts. You will learn how to create your first chart and read about the various elements available in a chart.