We briefly discussed profiler types in Chapter 1, Performance by Design. The JVisualVM tool we discussed with respect to introspection in the previous section is also a CPU and memory profiler that comes bundled with the JDK. Let's see them in action— consider the following two Clojure functions that stress the CPU and memory respectively:
(defn cpu-work []
(reduce + (range 100000000)))
(defn mem-work []
(->> (range 1000000)
(map str)
vec
(map keyword)
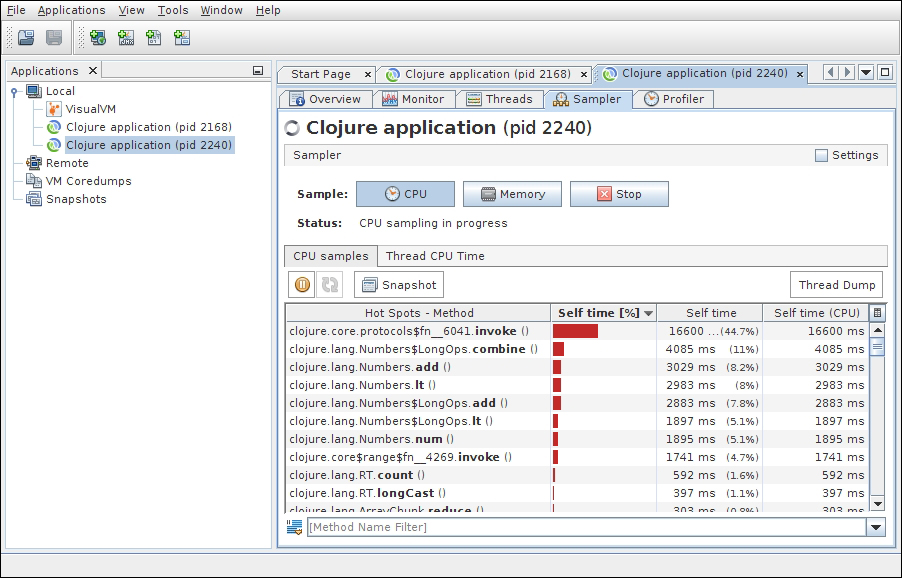
count))Using JVisualVM is pretty easy—open the Clojure JVM process from the left pane. It has sampler and regular profiler styles of profiling. Start profiling for CPU or memory use when the code is running and wait for it to collect enough data to plot on the screen.
The following shows memory profiling in action:
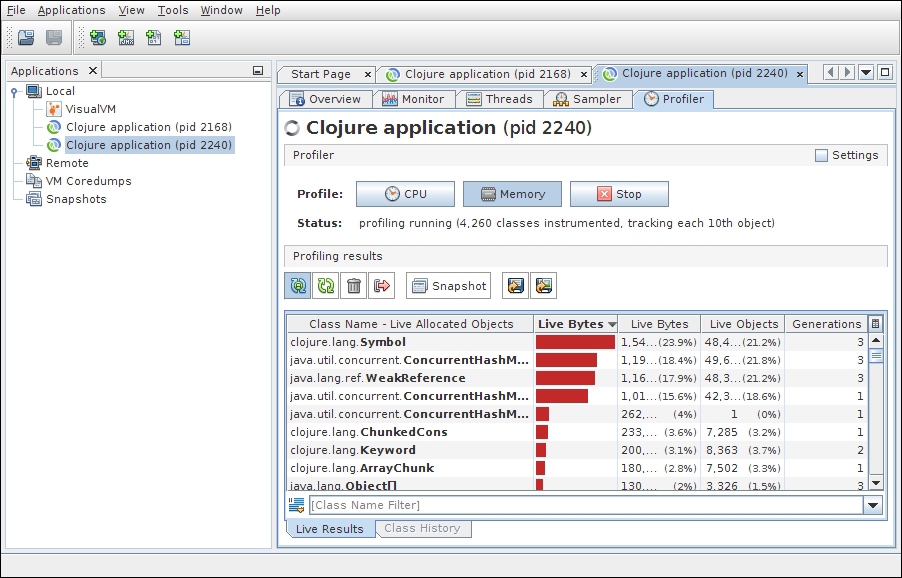
Note that JVisualVM is a very simple, entry-level profiler. There are several commercial JVM profilers on the market for sophisticated needs.
Profiling only the JVM may not always tell the whole story. Getting down to OS and hardware-level profiling often provides better insight into what is going on with the application. On Unix-like operating systems, command-line tools such as top, htop, perf, iota, netstat, vista, upstate, pidstat etc can help. Profiling the CPU for cache misses and other information is a useful source to catch performance issues. Among open source tools for Linux, Likwid (http://code.google.com/p/likwid/ and https://github.com/rrze-likwid/likwid) is small yet effective for Intel and AMD processors; i7z (https://code.google.com/p/i7z/ and https://github.com/ajaiantilal/i7z) is specifically for Intel processors. There are also dedicated commercial tools such as Intel VTune Analyzer
for more elaborate needs.
Profiling I/O may require special tools too. Besides iota and blktrace, ioping (https://code.google.com/p/ioping/ and https://github.com/koct9i/ioping) is useful to measure real-time I/O latency on Linux/Unix systems. The vnStat tool is useful to monitor and log network traffic on Linux. The IOPS of a storage device may not tell the whole truth unless it is accompanied by latency information for different operations, and how many reads and writes can simultaneously happen.
In an I/O bound workload one has to look for the read and write IOPS over time and set a threshold to achieve optimum performance. The application should throttle the I/O access so that the threshold is not crossed.