1
![]()
THE NATURE OF
ANALYTICAL COMPETITION
Using Analytics to Build a
Distinctive Capability
IN 1997, A THIRTY-SOMETHING man whose resume included software geek, education reformer, and movie buff rented Apollo 13 from the biggest video-rental chain on the block—Blockbuster—and got hit with $40 in late fees. That dent in his wallet got him thinking: why didn’t video stores work like health clubs, where you paid a flat monthly fee to use the gym as much as you wanted? Because of this experience—and armed with the $750 million he received for selling his software company—Reed Hastings jumped into the frothy sea of the “new economy” and started Netflix, Inc.
Pure folly, right? After all, Blockbuster was already drawing in revenues of more than $3 billion per year from its thousands of stores across America and in many other countries—and it wasn’t the only competitor in this space. Would people really order their movies online, wait for the U.S. Postal Service (increasingly being referred to as “snail mail” by the late 1990s) to deliver them, and then go back to the mailbox to return the films? Surely Netflix would go the route of the many Net-based companies that had a “business model” and a marketing pitch but no customers.
And yet we know that the story turned out differently, and a significant reason for Netflix’s success today is that it is an analytical competitor. The movie delivery company, which has grown from $5 million in revenues in 1999 to about $1 billion in 2006, is a prominent example of a firm that competes on the basis of its mathematical, statistical, and data management prowess. Netflix offers free shipping of DVDs to its roughly 6 million customers and provides a return shipping package, also free. Customers watch their cinematic choices at their leisure; there are no late fees. When the DVDs are returned, customers select their next films.
Besides the logistical expertise that Netflix needs to make this a profitable venture, Netflix employs analytics in two important ways, both driven by customer behavior and buying patterns. The first is a movie-recommendation “engine” called Cinematch that’s based on proprietary, algorithmically driven software. Netflix hired mathematicians with programming experience to write the algorithms and code to define clusters of movies, connect customer movie rankings to the clusters, evaluate thousands of ratings per second, and factor in current Web site behavior—all to ensure a personalized Web page for each visiting customer.
Netflix has also created a $1 million prize for quanitative analysts outside the company who can improve the cinematch algorithm by at least 10 percent. Netflix CEO Reed Hastings notes, “If the Starbucks secret is a smile when you get your latte, ours is that the Web site adapts to the individual’s taste.”1 Netflix analyzes customers’ choices and customer feedback on the movies they have rented—over 1 billion reviews of movies they liked, loved, hated, and so forth—and recommends movies in a way that optimizes both the customer’s taste and inventory conditions. Netflix will often recommend movies that fit the customer’s preference profile but that aren’t in high demand. In other words, its primary territory is in “the long tail—the outer limits of the normal curve where the most popular products and offerings don’t reside.”2
Netflix also engages in a somewhat controversial, analytically driven practice called throttling. Throttling refers to how the company balances the distribution of shipping requests across frequent-use and infrequent-use customers. Infrequent-use customers are given priority in shipping over frequent-use customers. There are multiple reasons for this practice. Because shipping is free to customers and the monthly charge to the customer is fixed, infrequent-use customers are the most profitable to Netflix. Like all companies, Netflix wants to keep its most profitable customers satisfied and prevent them from leaving. And while frequent-use customers may feel they are being treated unfairly (there have been complaints by a small number of customers, according to Hastings), Netflix must distribute its shipping resources across its most and least profitable customers in a way that makes economic sense. Hastings refers to the practice as a fairness algorithm. Netflix recently settled a class action suit involving the practice, because it had advertised that most movies were shipped in a day.
Analytics also help Netflix decide what to pay for the distribution rights to DVDs. When the company bought the rights to Favela Rising, a documentary about musicians in Rio de Janeiro slums, Netflix executives were aware that a million customers had ordered from the company the 2003 movie City of God, a realistic drama set in the slums of Rio. It also knew that 500,000 customers had selected a somewhat related documentary about slum life in India, Born into Brothels, and 250,000 ordered both DVDs from Netflix. Therefore, the company’s buyers felt safe in paying for 250,000 rentals. If more are ordered, both Favela Rising’s producers and Netflix benefit.
Like most analytical competitors, Netflix has a strong culture of analytics and a “test and learn” approach to its business. The chief product officer, Neil Hunt, notes,
From product management all the way down to the engineering team, we have hired for and have built a culture of quantitative tests. We typically have several hundred variations of consumer experience experiments running at once. For example, right now we’re trying out the “Netflix Screening Room,” which lets customers see previews of movies they haven’t seen. We have built four different versions of that for the test. We put 20,000 subscribers into each of four test cells, and we have a control group that doesn’t get the screening room at all. We measure how long they spend viewing previews, what the completion rate is, how many movies they add to their queue, how it affects ratings of movies they eventually order, and a variety of other factors. The initial data is quite promising.
Netflix’s CEO, Hastings, has a master’s in computer science from Stanford and is a former Peace Corps math teacher. The company has introduced science into a notably artistic industry. As a BusinessWeek article put it, “Netflix uses data to make decisions moguls make by gut. The average user rates more than 200 films, and Netflix crunches consumers’ rental history and film ratings to predict what they’ll like . . . ‘It’s Moneyball for movies [referring to the Oakland Athletics’ usage of statistics in professional baseball], with geeks like Reed looking at movies as just another data problem,’ says Netflix board member Richard N. Barton.”
In its testing, Netflix employs a wide variety of quantitative and qualitative approaches, including primary surveys, Web site user testing, concept development and testing, advertising testing, data mining, brand awareness studies, subscriber satisfaction, channel analysis, marketing mix optimization, segmentation research, and marketing material effectiveness. The testing pervades the culture and extends from marketing to operations to customer service.
The company’s analytical orientation has already led to a high level of success and growth. But the company is also counting on analytics to drive it through a major technological shift. It’s already clear that the distribution of movies will eventually move to electronic channels—the Internet, cable, or over the air. The exact mix and timing aren’t clear, but the long-term future of the mailed DVD isn’t bright. Netflix, however, is counting on its analytics to help it prosper in a virtual distribution world. If Netflix knows more than anyone else about what movies its customers want to see, the logic goes, customers will stay with the company no matter how the movies get to their screens.
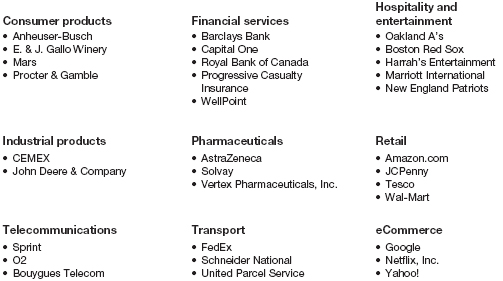
Netflix may seem unique, but in many ways it is typical of the companies and organizations—a small but rapidly growing number of them—that have recognized the potential of business analytics and have aggressively moved to realize it. They can be found in a variety of industries (see figure 1-1). Some, like Netflix, are not widely known as analytical competitors. Others, like Harrah’s Entertainment in the gaming industry or the Oakland A’s in baseball, have already been celebrated in books and articles. Some, such as Amazon.com, Yahoo!, and Google, are recent start-ups that have harnessed the power of the Internet to their analytical engines. Others, such as Mars and Procter & Gamble, have made familiar consumer goods for a century or more. These companies have only two things in common: they compete on the basis of their analytical capabilities, and they are highly successful in their industries. These two attributes, we believe, are not unrelated.
Analytic competitors are found in a variety of industries
What Are Analytics?
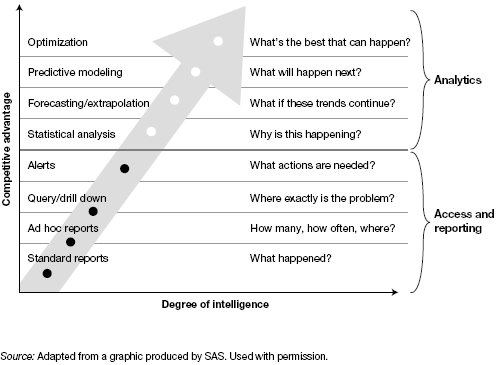
By analytics we mean the extensive use of data, statistical and quantitative analysis, explanatory and predictive models, and fact-based management to drive decisions and actions. The analytics may be input for human decisions or may drive fully automated decisions. Analytics are a subset of what has come to be called business intelligence: a set of technologies and processes that use data to understand and analyze business performance. As figure 1-2 suggests, business intelligence includes both data access and reporting, and analytics. Each of these approaches addresses a range of questions about an organization’s business activities. The questions that analytics can answer represent the higher-value and more proactive end of this spectrum.
In principle, analytics could be performed using paper, pencil, and perhaps a slide rule, but any sane person using analytics today would employ information technology. The range of analytical software goes from relatively simple statistical and optimization tools in spreadsheets (Excel being the primary example, of course), to statistical software packages (e.g., Minitab), to complex business intelligence suites (SAS, Cognos, BusinessObjects), predictive industry applications (Fair Isaac), and the reporting and analytical modules of major enterprise systems (SAP and Oracle). And as we’ll describe later in the book, good analytical capabilities also require good information management capabilities to integrate, extract, transform, and access business transaction data. Some people, then, would simply equate analytics with analytical information technology. But this would be a huge mistake—as we’ll argue throughout this book, it’s the human and organizational aspects of analytical competition that are truly differentiating.
Business intelligence and analytics
Why Compete on Analytics?
At a time when companies in many industries offer similar products and use comparable technology, high-performance business processes are among the last remaining points of differentiation. Many of the previous bases for competition are no longer available. Unique geographical advantage doesn’t matter in global competition, and protective regulation is largely gone. Proprietary technologies are rapidly copied, and breakthrough innovation in products or services seems increasingly difficult to achieve. What’s left as a basis for competition is to execute your business with maximum efficiency and effectiveness, and to make the smartest business decisions possible. And analytical competitors wring every last drop of value from business processes and key decisions.
Analytics can support almost any business process. Yet organizations that want to be competitive must have some attribute at which they are better than anyone else in their industry—a distinctive capability.3 This usually involves some sort of business process or some type of decision. Maybe you strive to make money by being better at identifying profitable and loyal customers than your competition, and charging them the optimal price for your product or service. If so, analytics are probably the answer to being the best at it. Perhaps you sell commodity products and need to have the lowest possible level of inventory while preventing your customer from being unable to find your product on the shelf; if so, analytics are often the key to supply chain optimization. Perhaps you compete in a people-intensive business and are seeking to hire, retain, and promote the best people in the industry. There too, analytics can be the key (though thus far they have largely been used for this purpose in professional sports and not much in businesses).
On the other hand, perhaps your operational business processes aren’t much different from anybody else’s, but you feel you compete on making the best decisions. Maybe you can choose the best locations for your stores—if so, you’re probably doing it analytically. You may build scale through mergers and acquisitions, and select only the best candidates for such combinations. Most don’t work out well, according to widely publicized research, but yours do. If so, you’re probably not making those decisions primarily on intuition. Good decisions usually have systematically assembled data and analysis behind them.
Analytical competitors, then, are organizations that have selected one or a few distinctive capabilities on which to base their strategies, and then have applied extensive data, statistical and quantitative analysis, and fact-based decision making to support the selected capabilities. Analytics themselves don’t constitute a strategy, but using them to optimize a distinctive business capability certainly constitutes a strategy. Whatever the capabilities emphasized in a strategy, analytics can propel them to a higher level. Capital One, for example, calls its approach to analytical competition “information-based strategy.” Harrah’s distinctive capabilities are customer loyalty and service, and it has certainly optimized them with its analytically driven strategy.
Can any organization in any industry successfully compete on analytics? This is an interesting question that we’ve debated between ourselves. On the one hand, virtually any business would seem to have the potential for analytical competition. The cement business, for example, would seem to be as prosaic and nonanalytical an industry as one could find. But the global cement giant CEMEX has successfully applied analytics to its distinctive capability of optimized supply chains and delivery times.
On the other hand, some industries are clearly more amenable to analytics than others. If your business generates lots of transaction data—such as in financial services, travel and transportation, or gaming—competing on analytics is a natural strategy (though many firms still don’t do it). If your business model is based on hard-to-measure factors—like style, as in the fashion business, or human relationships, as in the executive search industry—it would take much more ground-breaking work to compete on analytics. Still, virtually every day we find examples of businesses that were previously intuitive but are now becoming analytical. The wine business, for example, was once and (in some quarters) still is highly intuitive and built on unpredictable consumer preferences. Today, however, it’s possible to quantitatively analyze and predict the appeal of any wine, and large winemakers such as E. & J. Gallo are competing on analytics in such domains as sales, agriculture, and understanding of consumer preferences.4
How This Book Can Help
We didn’t invent the idea of competing on analytics, but we believe that this book (and the articles we wrote that preceded it) are the first to describe the phenomenon.5 In this book, you’ll find more on the topic than has ever been compiled: more discussion of the concept, more examples of organizations that are pursuing analytical competition, more management issues to be addressed, and more specific applications of analytics. Part I of the book lays out the definition and key attributes of analytical competition, and discusses (with some analytics!) how it can lead to better business performance. The end of this part describes a variety of applications of competitive analytics, first internally and then externally, with customers and suppliers.
Part II of the book is more of a how-to guide. It begins with an overall road map for organizations wishing to compete on their analytical capabilities. Whole chapters are devoted to each of the two key resources—human and technological—needed to make this form of competition a reality. We conclude by discussing some of the key directions for business analytics in the future.
There are a lot of words here, but we know they won’t be the last on the topic. We know of several other authors planning books on it, and we hope there will be a raft of articles too. We hope that many academics and consultants will embrace the topic. If this field is to prosper, the world will have to spend a lot of time and energy focusing on it, and we’ll need all the guidance we can get.
How Did We Get Here?
The Origins of Analytical Competition
The planets are clearly aligned for the move to analytical competition by organizations. At the same time that executives have been looking for new sources of advantage and differentiation, they have more data about their businesses than ever before. Enterprise resource planning (ERP) systems, point-of-sale (POS) systems, and Web sites, among other sources, have created more and better transaction data than in the history of humankind. A new generation of technically literate executives—the first to grow up with computers—is coming into organizations and looking for new ways to manage them with the help of technology. Finally, the ability to make sense of data through computers and software has finally come of age. Analytical software makers have dramatically expanded the functionality of their products over the past several years, and hardware providers have optimized their technologies for fast analysis and the management of large databases.
The use of analytics began as a small, out-of-the-way activity performed in a few data-intensive business functions. As early as the late 1960s, practitioners and researchers began to experiment with the use of computer systems to analyze data and support decision making. Called decision support systems (DSS), these applications were used for analytical, repetitive, and somewhat narrow activities such as production planning, investment portfolio management, and transportation routing. Two DSS pioneers, Peter Keen and Charles Stabell, argue that the concept of decision support arose from studies of organizational decision making done at Carnegie Tech (now Carnegie Mellon) by researchers such as Herbert Simon during the late 1950s and early ‘60s, and technical work on interactive computer systems, mainly carried out at MIT in the 1960s.6 Others would argue that their origins were closely connected to military applications in and following World War II, although computers as we know them were not yet available for those applications.
Statistical analysis on computers became a much more mainstream activity in the 1970s, as companies such as SAS Institute and SPSS introduced packaged computer applications that made statistics accessible to many researchers and businesspeople. Yet despite the greater availability of statistics, DSS did not prosper in the period and evolved into executive support systems.7 These applications involved direct use of computers and data by senior executives for monitoring and reporting of performance (with a lesser emphasis on decision making). This activity also never took off broadly, in part because of the reluctance of executives to engage in hands-on use.
Analytical technology became most frequently used for storing relatively small amounts of data and conducting ad hoc queries in support of decisions and performance monitoring. The focus on managing data became important because vast amounts of it were becoming available from transaction systems such as ERP and POS systems, and later from Internet transactions. Versions of this data-oriented focus were referred to as OLAP (online analytical processing) and later data warehousing. Smaller data warehouses were called data marts.
Today, as we mentioned, the entire field is often referred to with the term business intelligence and incorporates the collection, management, and reporting of decision-oriented data as well as the analytical techniques and computing approaches that are performed on the data. Business intelligence overall is a broad and popular field within the IT industry—in fact, a 2006 Gartner survey of 1,400 chief information officers suggests that business intelligence is the number one technology priority for IT organizations.8 Two studies of large organizations using ERP systems that we did in 2002 and 2006 revealed that better decision making was the primary benefit sought, and (in 2006) analytics were the technology most sought to take advantage of the ERP data.
Despite the variation in terminology, these movements—each of which lasted about a decade—had several attributes in common. They were largely technically focused, addressing how computers could be used to store, analyze, and display data and results of analysis. They were focused on fairly narrow problems—with the exception of the executive and performance monitoring systems, which only displayed the condition of the business. They were also relegated to the “back office” of organizations—used by technicians and specialists, with little visibility to senior executives. With only a few exceptions, they could rarely be said to influence the nature of competition.
Today, most large organizations have some sort of analytical applications in place and some business intelligence tools installed. But they are typically marginal to the success of the business and are managed at the departmental level. An insurance company, for example, may have some analytical tools and approaches in the actuarial department, where pricing for policies is determined. A manufacturing company may use such tools for quality management. Marketing may have some capabilities for lifetime value analysis for customers. However valuable these activities are, they are invisible to senior executives, customers, and shareholders—and they can’t be said to drive the company’s competitive strategy. They are important to individual functions but insignificant to competition overall.
Our focus in this book, however, is on companies that have elevated data management, statistical and quantitative analysis, and fact-based decision making to a high art. These organizations have analytical activities that are hardly invisible; they are touted to every stakeholder and interested party by CEOs. Rather than being in the back room, analytics in these companies are found in the annual report and in the press clippings. These organizations have taken a resource that is ostensibly available to all, and refined it to such a degree that their strategies are built around it.
When Are Analytical Decisions Appropriate?
There is considerable evidence that decisions based on analytics are more likely to be correct than those based on intuition.9 It’s better to know—at least within the limits of data and analysis—than to believe or think or feel, and most companies can benefit from more analytical decision making. Of course, there are some circumstances in which decisions can’t or shouldn’t be based on analytics. Some of these circumstances are described in Malcolm Gladwell’s popular book Blink, which is a paean to intuitive decision making.10 It’s ironic that a book praising intuition would arise and become popular just when many organizations are relying heavily on analytics, but then perhaps that’s part of its romantic appeal. The book is fun and persuasive, but it doesn’t make clear that intuition is only appropriate under certain circumstances. Gladwell is undoubtedly correct, for example, that human beings evolved a capability to make accurate and quick decisions about each other’s personality and intentions, and it’s rare for formal analysis to do that as well. Yet even Gladwell argues that intuition is a good guide to action only when it’s backed by many years of expertise. And many of Gladwell’s examples of intuition are only possible because of years of analytical research in the background, such as Dr. John Gottsman’s rapid and seemingly intuitive judgments of whether a married couple he observes will stay together. He’s only able to make such assessments because he observed and statistically analyzed thousands of hours of videotaped interactions by couples.
It’s also clear that decision makers have to use intuition when they have no data and must make a very rapid decision—as in Gladwell’s example of police officers deciding whether to shoot a suspect. Gary Klein, a consultant on decision making, makes similar arguments about fire-fighters making decisions about burning buildings.11 Even firms that are generally quite analytical must sometimes resort to intuition when they have no data. For example, Jeff Bezos, CEO of Amazon.com, greatly prefers to perform limited tests of new features on Amazon.com, rigorously quantifying user reaction before rolling them out. But the company’s “search inside the book” offering was impossible to test without applying it to a critical mass of books (Amazon.com started with 120,000). It was also expensive to develop, increasing the risk. In that case, Bezos trusted his instincts and took a flier. And the feature did prove popular when introduced.12
Of course, any quantitative analysis relies upon a series of assumptions. When the conditions behind the assumptions no longer apply, the analyses should no longer be employed. For example, Capital One and other credit card companies make analytical predictions about customers’ willingness to repay their balances under conditions of general economic prosperity. If the economy took a sharp downturn, the predictions would no longer apply, and it would be dangerous to continue using them.
The key message is that the frontier of decisions that can be treated analytically is always moving forward. Areas of decision making that were once well suited for intuition accumulate data and analytical rigor over time, and intuition becomes suboptimal. Today, for example, some executives still consider it feasible to make major decisions about mergers and acquisitions from their gut. However, the best firms are already using detailed analytics to explore such decisions. Procter & Gamble, for example, used a variety of analytical techniques before its acquisition of Gillette, including those for logistics and supply chains, drivers of stock market value, and human resources. In a few years, firms that do not employ extensive analytics in making a major acquisition will be considered irresponsible.
Indeed, trends point to a more analytical future for virtually every firm. The amount of data available will only continue to increase. Radio frequency identification (RFID) devices will be put on virtually every pallet or carton that moves through the supply chain, generating vast amounts of new data for companies to collect and analyze. In retail, every shopping cart will be intelligent enough to gather data on “pickstreams,” or a record of which products are taken off the shelves in what order. In oil exploration and mining, the amount of data—already massive—will expand geometrically. In advertising, more businesses are already shifting to media such as the Internet and cable television that can monitor which ads are seen by whom—again creating a huge new stream of data.
Analytical software will become more broadly available and will be in reach of every organization. Statistically oriented software firms such as SAS and SPSS have made increasingly sophisticated analyses available to average companies and users for over thirty years, and they will continue to do so. Business intelligence firms such as SAS, Business Objects, and Cognos are adding more analytical capabilities to their software toolsets. New industry applications targeting different business capabilities will become available from vendors such as Fair Isaac Corporation. Enterprise systems vendors such as SAP and Oracle are making it more possible to analyze their systems’ data and monitor the performance of the business. And Microsoft is incorporating increasing amounts of analytical capability into basic office software. In the future, software availability will not be an issue in analytical competition, although the ability to use analytical software well won’t ever be a commodity.
It’s also safe to assume that hardware won’t be a problem. Today the 64-bit processors from Intel and others that can do extensive quantitative analysis on large data sets are considered cutting-edge, but they won’t be for long. Specialized computers from providers such as Teradata and Netezza can easily manage multiterabyte data warehouses. No doubt the personal computer of the near future will be able to perform serious analyses. The bigger issue will be how organizations control their data and analysis, and ensure that individual users make decisions on correct analyses and assumptions.
To remain an analytical competitor, however, means staying on the leading edge. Analytical competition will be something of an arms race, requiring continual development of new measures, new algorithms, and new decision-making approaches. Firms embracing it will systematically eliminate guesswork from their processes and business models. Analytical competitors will have to conduct experiments in many aspects of their businesses and learn from each one of them. In order for quantitative decisions to be implemented effectively, analysis will have to be a broad capability of employees, rather than the province of a few “rocket scientists” with quantitative expertise.
We’ve developed a road map describing the primary steps needed to build an effective analytical competitor. It involves key prerequisites, such as having at least a moderate amount and quality of data about the domain of business that analytics will support, and having the right types of hardware and software on hand. The key variables are human, however. One prerequisite is that some manager must have enough commitment to analytics to develop the idea further. But then the pivotal factor in how fast and how well an organization proceeds along the analytical path is sponsorship. Firms such as Netflix, Harrah’s, and Capital One have CEO-level sponsorship and even passion for analytical competition that lets them proceed on a “full steam ahead” path.
Other organizations that lack passionate executive sponsorship must first go through a “prove it” path to demonstrate the value of analytical competition. This path is slower, and even those who take the prove-it path have to eventually arrive at strong executive sponsorship if they are to become true analytical competitors. We will discuss this road map—and the steps on each of the two paths—in greater detail in the second part of this book (chapter 6 in particular). For now, we simply want to emphasize that although analytics seem to be dispassionate and computer based, the most important factors leading to success involve passionate people.
Analytics in Professional Sports—and Their
Implications for Business
We can perhaps best understand the progression of analytical competition across an industry by focusing on professional sports. While sports differ, of course, they have in common large amounts of data and talented but expensive human resources (the athletes). Sports also differ from businesses, but both domains of activity have in common the need to optimize critical resources and of course the need to win.
Perhaps the most analytical professional sport is baseball, which has long been the province of quantitative and statistical analysis. The use of statistics and new measures in baseball received considerable visibility with the publication of Moneyball, by Michael Lewis.13 The book described the analytical orientation of the Oakland A’s, a professional team that had a record of consistently making the playoffs despite a low overall payroll (including the 2006 playoffs—although, even the best analytical competitor doesn’t win all the time, as in 2005). Lewis described the conversion of Oakland’s general manager (GM), Billy Beane, to analytics for player selection when he realized that he himself had possessed all the traditional attributes of a great player, according to major league scouts. Yet Beane had not been a great player, so he began to focus more on actual player performance as revealed in statistics than on the potential to be great. Beane and the A’s also began to make use of relatively new measures of player performance, eschewing the traditional “runs batted in,” or RBIs, and focusing on “on-base percentage” and “on-base plus slugging percentage.” Like analytical competitors in business, they invented new metrics that assessed and stretched their performance.
Yet Beane was not actually the first Oakland general manager to take a statistical orientation.14 In the early 1980s, Sandy Alderson, then the GM (now CEO of the San Diego Padres, another 2006 playoff contender), adopted a more statistical approach for two reasons. First, Oakland had performed badly for a number of years before the decision and was on the brink of going out of business. Second, Alderson was offered an early version of a PC-based (actually, Apple II–based) statistical database and analysis package. Baseball statistics are widely available from firms such as STATS, Inc., and the Elias Sports Bureau, although the statistics were available to teams well before they started taking advantage of them. These reasons are typical of why businesses often adopt analytical competition: a combination of pressing business need, the availability of data, and IT that can crunch all the numbers.
The analytical approach to baseball has broadened considerably over the last few years. One team that has adopted the “moneyball” approach is the Boston Red Sox—a team with both analytical capabilities and the money to invest in expensive players. The Red Sox also had a business need, having failed to win the World Series for eighty-six years by the 2004 season. The Sox also exemplify another reason why organizations adopt analytical competition: new leadership. The team’s two new principal owners in 2002 were John Henry, a quantitative hedge fund manager, and Tom Werner, a television producer who had previously owned the San Diego Padres. The appeal of analytics to Henry was obvious, but Werner had also realized with the Padres that the traditional baseball establishment didn’t know as much about what led to championships as it purported to. As we mentioned earlier, the high level of executive sponsorship at the Sox let the team take the full-steam-ahead approach to analytical competition.
Like other organizations committed to analytical strategies, the Red Sox quickly hired as a consultant the best analytical talent: Bill James, who was widely regarded as the world’s foremost practitioner of “sabermetrics,” or baseball statistics (James even invented the term himself). The fact that no other team had seen fit to hire such an underemployed analytical genius suggests that analytical competition in baseball was not yet widespread. The analytical approach—along with some new and expensive talent—paid off for the Sox quickly, and they made the American League Championship Series (ALCS) against their perennial rivals, the New York Yankees, in 2003.
Yet one game in that series illustrates a key difficulty of analytical competition: it has to spread everywhere within an organization if analytical decisions are to be implemented. In the fifth and deciding game of the series, Red Sox ace Pedro Martinez was pitching. Sox analysts had demonstrated conclusively that Martinez became much easier for opposing batters to hit after about 7 innings or 105 pitches (that year, the opposing team’s batting average against Martinez for pitches 91–105 was .231; for pitches 106–120 it was .370). They had warned manager Grady Little that by no means should Martinez be left in the game after that point. Yet when Martinez predictably began to falter late in the seventh, Little let him keep pitching into the eighth (even against the advice of his pitching coach), and the Yankees shelled Martinez. The Yanks won the ALCS, but Little lost his job. It’s a powerful story of what can happen if frontline managers and employees don’t go along with the analytical program. Fortunately for long-suffering Red Sox fans (including one of the authors of this volume), the combination of numbers and money proved insurmountable in the 2004 season, and the Sox broke the eighty-six-year World Series championship drought.
Analytical competition has not fully triumphed in baseball, however. Some teams—including some perennially good teams, such as the Atlanta Braves—still rely heavily on traditional scouting criteria, although they use numbers too. The Braves’ general manager, John Schuerholz, argued in an interview that “to suggest that new, statistical, chromeplated, digitally enhanced, new-age-thinking statistics alone can replace scouting instincts and human judgment and analysis, I take great exception to that. So what we do is use both.”15 St. Louis Cardinals coach Tony La Russa (whose team won the 2006 World Series), one of the best coaches in the game, brilliantly combines analytics with intuition to decide when to substitute a charged-up player in the batting lineup or whether to hire a spark plug personality to improve morale. In his recent book, Three Nights in August, Buzz Bissinger describes that balance: “La Russa appreciated the information generated by computers. He studied the rows and the columns. But he also knew they could take you only so far in baseball, maybe even confuse you with a fog of overanalysis. As far as he knew, there was no way to quantify desire. And those numbers told him exactly what he needed to know when added to twenty-four years of managing experience.”16
Analytics have also spread to professional football. The New England Patriots, for example, have been particularly successful of late, winning three Super Bowls in four years. The team uses data and analytical models extensively, both on and off the field. In-depth analytics help the team select its players and stay below the salary cap (last year the team had the twenty-fourth-highest payroll in the National Football League). The team selects players without using the scouting services that other teams employ, and it rates potential draft choices on such nontraditional factors as intelligence and willingness to subsume personal ego for the benefit of the team.
The Patriots also make extensive use of analytics for on-the-field decisions. They employ statistics, for example, to decide whether to punt or “go for it” on fourth down, whether to try for one point or two after a touchdown, and whether to challenge a referee’s ruling. Both its coaches and players are renowned for their extensive study of game films and statistics, and head coach Bill Belichick has been known to peruse articles by academic economists on statistical probabilities of football outcomes. Off the field, the team uses detailed analytics to assess and improve the “total fan experience.” At every home game, for example, twenty to twenty-five people have specific assignments to make quantitative measurements of the stadium food, parking, personnel, bathroom cleanliness, and other factors. External vendors of services are monitored for contract renewal and have incentives to improve their performance.17
Other NFL teams that make extensive usage of statistics include the Kansas City Chiefs, Tennessee Titans, and Green Bay Packers. The Titans, for example, have determined that the traditional performance measures of yards allowed or gained are relatively meaningless, and have come up with alternative measures. The Packers analyzed game films of one running back with a fumbling problem, and determined that the fumbles only happened when the player’s elbow wasn’t horizontal to the ground when he was hit.18 Despite the success of the Patriots and these other teams, many teams in the NFL have yet to grasp the nature and value of analytical competition.
Professional basketball has historically been less quantitatively oriented than baseball or football, but the numeric approach is beginning to take off there as well. Several teams, including the high-performing San Antonio Spurs, have hired statistical consultants or statistically oriented executives. The Houston Rockets have recently selected as general manager a young, quantitatively oriented executive who previously managed information systems and analytics for the Boston Celtics. Daryl Morey, an MIT MBA, considers baseball sabermetrician Bill James to be his role model, and argues that analytics in basketball are similar to those for moneyball in baseball. “It’s the same principle. Generate wins for fewer dollars.”19 As in baseball and football, teams and their analysts are pursuing new measures, such as a player’s value to the team when on the court versus when off of it (called the Roland Rating after amateur statistician Roland Beech).
Analytical competition is taking root not only in U.S. sports. Some soccer teams in Europe have also begun to employ similar techniques. AC Milan, one of the leading teams in Europe, uses predictive models to prevent player injuries by analyzing physiological, orthopedic, and psychological data from a variety of sources. Its Milan Lab identifies the risk factors that are most likely to be associated with an injury for each player. The lab also assesses potential players to add to the team. Several members of the World Cup–winning Italy national team trained at Milan Lab. The Bolton Wanderers, a fast-rising English soccer team, are known for the manager’s use of extensive data to evaluate player performance and team strategies. The team also uses analytics to identify its most valuable customers and to offer them benefits that help build loyalty.
Why all this activity in professional sports, and what difference does it make for other types of organizations? There are many themes that could cut across sports and business. Perhaps the most important lesson from professional sports analytics is its focus on the human resource—on choosing and keeping the best players at the lowest price. This is not a widespread practice in the business “talent management” domain, but perhaps it should be. As executive and individual contributor salaries continue to rise, it may be time to begin to analyze and gather data on which people perform well under what circumstances, and to ensure that the right players are on the team. A few firms are beginning to adopt a more analytical approach to human resource management, but sports teams are still far ahead of other organizations.
Analytical competition in sports also illustrates the point that analysis rises first when sufficient data is present to analyze. If there is a business area in which large amounts of data are available for the first time, it will probably soon become a playing field for analytical competition. Analytical innovators in professional sports also often create new measures, and businesspeople should do the same.
While analytics is a somewhat abstract and complex subject, its adoption in professional sports illustrates the human nature of the process. When a team embraces analytical competition, it’s because a leader makes a decision to do so. That decision can often be traced to the leader’s own background and experiences. Analytical competition—whether in sports or business—is almost always a story involving people and leadership.
It’s also no accident that the sports teams that have embraced analytical competition have generally done well. They won’t win championships every year, of course, but analytical competitors have been successful in every sport in which they have arisen. However, as analytical competition spreads—and it spreads quickly—teams will have to continue innovating and building their analytical capabilities if they wish to stay in front. Whatever the approach to competition, no team (or firm) can afford to rest on its laurels.
What’s in This Book
We’ve attempted to lay out the general outlines of analytical competition in this chapter and to provide a few examples in the worlds of business and sports. There are many more examples to come, and throughout part I of the book, we’ll go into much more detail about what it means to compete on analytics and how companies can move in that direction. Chapter 2 describes the specific attributes of firms that compete on analytics and lays out a five-stage model of just how analytically oriented an organization is. Chapter 3 describes how analytics contribute to better business performance, and includes some data and analysis on that topic. Chapters 4 and 5 describe a number of applications of analytics in business; they are grouped into internally oriented applications and those primarily involving external relationships with customers and suppliers.
In part II of the book, our goal is to discuss the key steps and capabilities involved in analytical competition. We begin that part with a discussion in chapter 6 of the overall road map for analytical competition. Chapter 7 is about the most important factor in making a company analytical: its people. Chapter 8 is about the important resources of technology and data, and how they can be combined in an overall analytical architecture. We conclude the book in chapter 9 with a discussion of the future directions that analytical competition might take.
We do our best to help organizations embark upon this path to business and organizational success. However, it’s important to remember that this is just an overview. There are many books on how to implement business intelligence, how to create and modify analytical models in such areas as supply chain and marketing, and how to do basic quantitative and statistical analysis. Our goal is not to give businesspeople all the knowledge they’ll ever need to do serious analytical work, but rather to get you excited about the possibilities for analytical competition and motivated enough to pursue further study.