CHAPTER 3
Why Data and Analytics Are Important
The digital economy is providing companies with unlimited possibilities to create value across the entire organization. Data and analytics have become the primary driver of business organizations with the potential for real-time analytics-driven decision making. It is a significant part of every decision that companies consider before taking actions. However, for many organizations the ability to “think data” and “act analytically” is still a challenge. The transition to a data-driven organization requires data and analytics leaders, such as chief analytics officers (CAOs), CEOs, and CIOs to elevate data and develop analytics strategies, which requires a vision to advance new business problem solving across the entire company. An analytics strategy and vision significantly impacts the work of data and analytics teams and the organization's competencies to solve challenges caused by unexpected disruptions. It requires a corporate cultural shift in philosophy. As data and analytics mature within organizations, the positive returns on their investments will become more evident. Nevertheless, data and analytics leaders must adopt new disciplines and technologies to solve the challenges of data collection, processing, and storage before they can drive business value across the entire organization. As is well known, customer experiences are all connected by data and enabled by analytics.
Advancements in analytics have ignited renewed interest in the consumer products industry, as analytics capabilities are now delivering greater value across major areas of their companies, including marketing, sales, merchandising, supply chain, and others. Advanced analytics is helping consumer goods companies become more consumer and customer focused across all aspects of their business. They are considering next generation AI/machine learning capabilities as the key to unlocking a deeper understanding of their consumers. They are counting on using more data and applying advanced analytics to successfully launch new products, optimize distribution channels and ultimately shape future demand. As consumer goods companies continue to work diligently to achieve this vision, they are quickly realizing that the journey from raw data to actionable insights is a long one riddled with many obstacles. Advanced analytics is not just a tool for better customer and consumer insights—it is also a competitive advantage. As analytics technologies become more widely adopted, the pressure to do more with data increases as companies become more analytics-diagnostic relative to maturity.
ANALYTICS MATURITY
Analytics maturity starts with standard reporting (also known as descriptive analytics), then evolves through statistical analysis and predictive analytics to AI/machine learning capabilities. At highly advanced levels, analytics are used to transform the business by driving new product launches, understanding markets, and creating new business models; however, there is more to analytics adoption and maturity than simply a progression to more sophisticated analytics and technologies. Successful realization of the most advanced applications requires a corporate culture and technology infrastructure that are prepared to implement and make key business decisions based on the results. For example, leveraging more comprehensive data about consumers and developing a hyper view of a target brand for optimizing marketing investment to drive consumption requires investing in new statistical skills and in-house capabilities such as cloud-based analytics solutions. Consumer product companies seeking to move along the maturity curve must find a way to maintain current competencies and integrate them with forward-thinking capabilities. (See Figure 3.1.)

Figure 3.1 Analytics Maturity Model
Standard reporting remains extremely popular and represents the dominant maturity level across many organizations. The exception is marketing, which represents the largest area that taps into more advanced analytics (e.g. statistical analysis, forecasting, and predictive analytics) by using advanced predictive models for predictions to drive more precision in marketing spend, thus improving return on investment (ROI). They also lead the way as the largest group using analytics to transform the business. The supply chain tends to lag behind marketing in the use of more advanced analytics. Ironically, according to a recent custom research report by Consumer Goods Technology (CGT) and IBM, consumer products companies are near unanimous (91.4%) in predicting that the most impact and benefit from advanced analytics will come from forecasting and planning (see Figure 3.2), which includes both consumer as well as supply chain forecasting and planning. This is an area that has already benefited from analytics to date, so it's reasonable to assume that greater advancements will drive greater impact.1
The personalized consumer engagement is a dominant theme in the consumer products industry, and the goal of many analytics-driven programs is to gain better insights about consumers. So, it is not surprising that uncovering a broader understanding of consumer insights is an absolute business imperative. One underlying assumption for many consumer goods companies is the ability to factor new data streams into the analysis, such as social media, customer loyalty data, e-commerce, and weather data to achieve not just nuance, but reduce guesswork and latency to take decisive actions. Furthermore, most consumer goods companies are starting to feel less reliance on IT for data access as software vendors have automatically integrated data directly into most business applications. Also, as data scientists are embedded in the business, it will further reduce the dependency on IT. It appears that analytics and insights from these new data sources are being integrated into other processes and systems for many organizations, particularly in the front office.

Figure 3.2 Functions and Processes Most Impacted by Advanced Analytics
Source: “Transforming Core Consumer Products Functions with Advanced Analytics,” A CGT Custom Research Report Partnered with IBM, pp. 1–10.
COLLECTING AND STORING CONSUMER DATA
Consumer goods companies have always desired to collect and store data to help them better understand consumers' buying and consumption patterns. For several decades, the primary sources of data collected by consumer goods companies include point of sale (POS), 66.7%; syndicated scanner, 75.8%; marketing and panel data, 60.6% and 48.5%, respectively; and those trends continue. Many companies purchase data snapshots from each of these sources, packaging data for specific business uses (see Figure 3.3). Two-thirds of consumer goods companies still purchase retail data, despite a decade-long industry-wide effort to demonstrate the value of sharing POS data, which helps companies to understand consumer demand, driving replenishment and reducing out-of-stocks. This happens, however, only when this data is given rather than sold. Remarkably, consumer goods companies with revenues under $1 billion are most likely buying POS and distributor data. The trend is for large retailers to continue sharing more data and information, particularly from e-commerce, with their large consumer goods supplier partners, even as the gap between leaders and others is growing.2
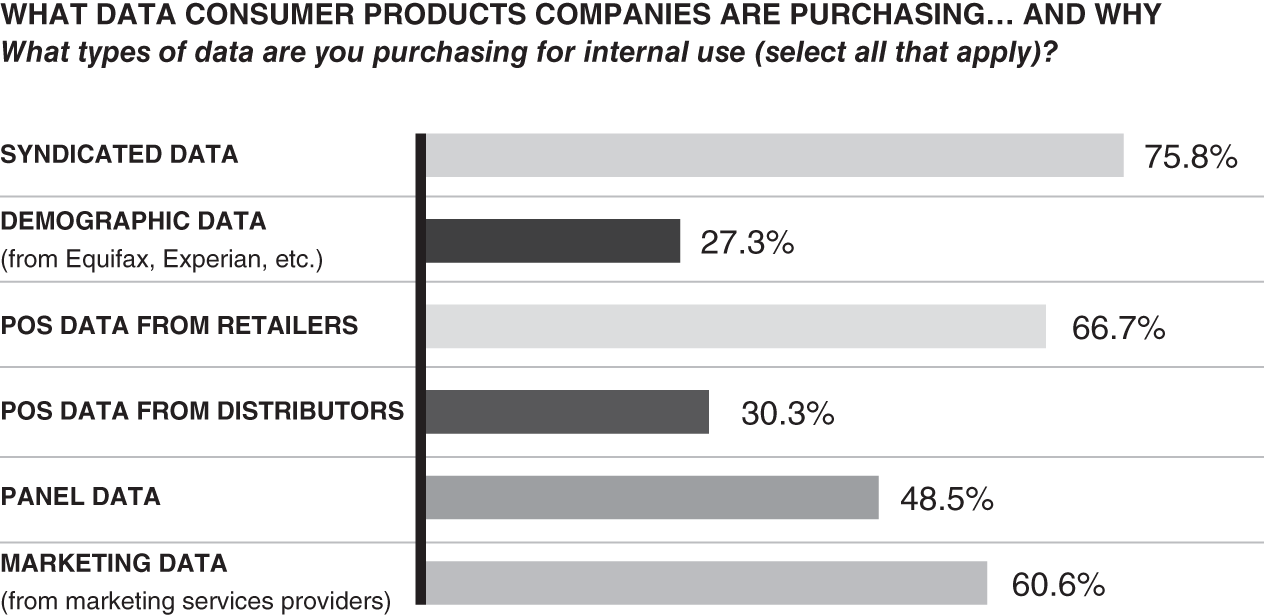
Figure 3.3 Types of Data Being Purchased for Internal Use
Source: “Transforming Core Consumer Products Functions with Advanced Analytics,” A CGT Custom Research Report Partnered with IBM, pp. 1–10.
The good news is that options for obtaining data directly from consumers are expanding rapidly. Consumer goods companies are adding new sources such as social media, e-commerce, and digital couponing, among others. According to the CGT custom research report, however, they continue to invest in traditional measures such as surveys, loyalty programs, and panels. Usage of these vehicles could potentially decrease as newer sources become more prevalent and as companies increase their capabilities to best leverage them. Nevertheless, social media adoption is gaining traction with consumer goods companies. They have been investing in various ways to collect and store social media data, and many are counting on it to produce qualitative data needed to gain nearly real-time consumer insights. Social media use, however, is still in its early stages and not yet fully implemented across most companies. Nevertheless, consumer goods companies agree that social media has the potential to foster development of new products based on consumer feedback. Another strong value proposition lies in being able to cultivate key brand drivers (influencers) with a broader reach. They rank new product development as offering the greatest opportunity to drive value from social media.
Weather data has always been a significant influencer in driving consumer demand patterns; however, only 50% of consumer goods companies are currently using weather data in making key business decisions (see Figure 3.4). Historically, those using weather data have done so reactively, incorporating weather events into supply chain and inventory planning. However, according to the CGT custom research report, this lagged other approaches. More than a quarter (26.5%) use weather data proactively for sales and promotion planning. More than one in five (20.6%) use weather data on an ad hoc basis, such as for special projects or immediate weather events.3 Given improvements in the accuracy of weather forecasting models, many companies are beginning to see the biggest benefit in forecasting and planning where demand is known to be affected by specific weather events globally. As a result, many consumer goods companies have been buying weather information from companies who provide weekly weather indices and future predictions by region, category, and product, such as Planalytics (www.Planalytics.com).

Figure 3.4 Leveraging Weather Data
Consumer goods companies have a strong potential in moving up the analytics maturity curve, particularly in forecasting and planning as they continue to push forward. They are making headway in circumventing the slow progress regarding retail data sharing by exploring new data streams such as social media. Social media holds promise for new product development as companies learn how to integrate it into the organization. Consumer goods companies realize that by adopting the right data, processes, analytics, and technologies, they can drive considerable gains in consumer advocacy and ultimately, a better ROI.
Why Is the Data Ecosystem Important?
The data ecosystem relates to the data management and technological infrastructure that needs to be in place to enable analytics across the entire organization. This includes implementing technology architectures, governance, and procedures to manage the company's full data needs. It has been proven that those companies that have a strong data-driven decision making corporate culture correlate with executive sponsorship and support. As a result, the appreciation and understanding of the importance of the data ecosystem in driving the benefits of analytics become the new cultural norm.
The primary purpose of data ecosystems is to capture data to produce useful insights. As consumers purchase products, especially via digital formats, they leave data imprints. Companies now can create data ecosystems that capture and analyze data imprints so product teams can determine what their users like and don't like, and how they respond to different marketing programs. Product teams can use insights to tweak sales promotions, features, displays, and more to improve consumer demand. Data ecosystems were originally designed to be relatively centralized and static. The birth of the Web and cloud services has changed the data ecosystem framework. Now data is captured and distributed across organizations with IT professionals having less central control. Hence, the term data ecosystem, indicating these are data environments designed to evolve. There is no one data ecosystem solution framework.
Every business can create its own data ecosystem, sometimes referred to as a technology stack. It starts with a collection of hardware and software to capture, store, process, analyze, and act upon data insights. The best data ecosystems are built around an analytics solution platform that is open source with specific point-design capabilities—such as demand forecasting and planning—which tie the whole ecosystem together. Analytics platforms help teams integrate multiple data sources, provide AI/machine learning tools to automate the process of capturing, harmonizing, and normalizing data, and then conducting analysis and tracking users' performance metrics.
Why Data and Analytics?
The reality is that data and analytics are complicated. However, the results can significantly improve an organization's productivity and performance. The results could be increased revenue, improved profit margins, reduction in inventory costs, or an entirely new business framework. Any successful initiative requires a cultural and mindset shift where data and analytics change from supportive and secondary to fundamental for digital transformation. Data and analytics become central to how organizations do business every day, and thus are the basis for all decisions.
Those companies who make data a part of everything ask the right questions:
- How will the insights uncovered from this data as a result of the analytics change the value proposition for our customers?
- How will it improve our ability to predict shifting consumer demand patterns?
- How will we be able to improve the consumer experience?
- How will this help us deliver value and profitability?
- How will the results drive new business processes, innovation, and consumer response as a result of these new insights?4
The ability to answer these questions based on data and analytics will not only add value but will expand data and analytics competencies by encouraging data literacy across the organization. Organizations need to become smarter at understanding what results can be improved and how that investment drives positive outcomes across the company. It might be an investment in access to new data, or the implementation of artificial intelligence, or the ability to easily visualize data, or other activities. A clear understanding that considers data quality, data governance, and data literacy is vital to the success of a company's data and analytics investment.
The challenge at many companies is that demand planners, as well as many businesspeople, don't understand the importance of how data and analytics supports their work. They feel that business knowledge, experience, and intuition play a more practical role. On the other hand, demand analysts and data scientists lack a clear understanding of the business acumen required to successfully model and analyze the business effectively. Data and analytics are increasingly valuable assets to organizations, which requires all employees to embrace, understand, and utilize the relevant analytics information that affects their areas of expertise, particularly during disruptions. In the digital economy, data is as important as the classic business drivers of “people, process, analytics, and technology,” making it equally important to become part of the corporate culture.
BUILDING TRUST IN THE DATA
In order to gain more value from predictive analytics and emerging technologies like cloud computing, data collected for the analytics must be trusted. On the other hand, once insights emerge from the application of analytics, individuals throughout the organization must feel comfortable that care was taken to assure the quality and uniformity of the data. Otherwise, the consumers of the insights will not trust the results or use them to make more informed business decisions and take actions. According to recent research, those companies who have advanced their analytics practices to incorporate AI/machine learning foster data quality, safeguard data assets, and develop data literacy cultures that encourage innovation. While most companies have increased access to data, only a few have the right data to make informed decisions. Notably, those companies who report high levels of trust in their data for analytics are more likely to show leadership to ensure that data is of high quality and leads to useful insights.
Leading organizations that have placed priority on building trust in the data that is collected and stored tend to trust the analytic insights it generates, which reinforces a culture that trusts and embraces data-driven decision making. As a result, there tends to be a strong correlation between those companies who use advanced analytics and those whose organizational activity fosters data quality, safeguards data assets, and builds a data-driven culture. They implement measures for governing proper use and security, and follow those practices, achieving results. This means demand analysts (data scientists) trust the data they access from a centralized data hub instead of copying data to work on their own in a siloed environment. This leads to more consistent data, and more accurate results.
Unfortunately, these best practice benefits are still not widespread. Many organizations are still in the process of developing their analytics capabilities to make informed business decisions. According to recent research studies, only 10% of companies are working with predictive analytics and less than 10% are integrating AI/machine learning into their decision-making or supply chain workflows. Most organizations rely on business intelligence (BI) tools and dashboards to support decision-making activities.
AI/MACHINE LEARNING CREATES TRUST CHALLENGES
AI/machine learning (ML) has the potential to solve difficult problems and motivates those who see it ushering in a new era that is comparable to the first machine age driven by the Industrial Revolution. At the same time, the implication that humans are giving machines autonomy—and even some degree of personality, as in the case of automated digital assistants who have names and speak to people—creates a level of anxiety for many. While some of those concerns belong in the dominion of science fiction, using ML does carry real potential risks that organizations need to manage. Mainly because the technology can enable autonomous decision making and actions by machines, questions about its reliability were found in a recent MIT SMR Connections research report (2020) that are more urgent than for other new technologies. The six risks about AI/machine learning that are of high concern:
- Deliver inadequate return on investment (ROI).
- Produce bad information.
- Be used unethically.
- Support biased, potentially illegal decisions.
- Produce results that humans cannot explain.
- Be too unpredictable to manage adequately.5
The two risks causing less concern were that AI may disrupt workflows or productivity and that AI may deliver bad customer experiences. An important component of building trust in ML is managing the associated risks, particularly through oversight that seeks to understand and verify how models function, mitigate bias, and anticipate unintended consequences. Organizations that have implemented ML are much more likely to already have a group tasked with setting policies and managing. An important development among some companies that have implement ML is they are establishing management review boards. The biggest item that a lot of companies are doing, especially those that are highly regulated, is to put together boards that review the operationalization of AI/machine learning. These boards often have data scientists as well as business leaders, representatives from the legal department, and other relevant domain experts.
PURSUIT OF EXPLAINABILITY
One of the biggest challenges for many who consider new analytics-driven technology is adequate explainability, or the ability to identify the key factors that a model used in producing its results, which in many cases will be used to make recommendations in a decision-support system or actions in an automated process. It has been found that most action taken based on explainability of ML results is being taken by those with the broadest AI/machine learning implementations. Explainability is important for sales/marketing to determine the appropriate mix of sales promotions, advertising, and in-store merchandising (display, feature, feature and display, temporary price reductions [TPRs], and others) to drive not only incremental volume, but also profitable revenue growth. Although AI/machine learning emerging software applications and tools are getting better at describing correlations that occur within the algorithms and the key variables that matter for the decision, the model must be able to account for the outcome. Explainability also plays a key role in building trust in ML, by providing visibility into how a model works and why it is making a particular recommendation to business stakeholders.
Many business leaders feel that ML models are not mature enough to be used in critical domains because of the black box problem. They believe that there is a need to start using them for problems with low risk to test and learn before taking on more critical problems that require explainability and interpretability of the modes. They also believe these are unsolved problems that need to be addressed before utilizing ML across the broader spectrum of business activities. Managing the risk of bias in ML applications due to inadequate data sets can skew a model and distort the predictions. The question of managing bias becomes particularly urgent with predictive models that make recommendations affecting people, where the potential consequences of doing the wrong thing are greater. Efforts to mitigate bias start with understanding the purpose of any project and then evaluating whether there is appropriate data to build an unbiased model.
Engage with Domain Experts and Business Specialists
Understanding what data is needed may be easier when analytics practitioners work closely with domain experts within their organizations. Teaming data scientists with domain experts and business specialists who understand data sources and how they can be automated should be a best practice for all companies. The team members would complement one another with different expertise and perspectives, uncovering different patterns and identifying different opportunity pathways that may have been missed without the collaboration. This is particularly true when teaming data scientists with marketing and demand planners to develop driver-based consumption models and forecasts. A marketing expert would expect certain consumer shopping patterns and check with the analytic results as compared to assumptions, and know what questions to ask that were not part of the initial analytics investigation. On the other hand, a demand planner would be able to spot and examine anomalies arising due to field sales activities and know what adjustments to the model would help provide insights as to why those activities should be included or discarded.
Data governance ensures that the right data gets utilized so that results are trusted and actionable. Ensuring that the data is high quality will allow data scientists (demand analysts) to start with good building blocks for their models. There needs to be a common truth in the data, including the underlying data, how it's been processed, and how it's analyzed, which will ultimately create more accurate, scalable analytics. However, companies may find that the challenge may be more complex due to legacy systems architecture and fragmented data sources and data repositories. Many corporate leaders agree that data is an important asset; however, those who back up that view with committed organizational resources will gain competitive advantage from deploying predict analytics and AI/machine learning. As a result, many companies now employ a chief data officer (CDO) or chief analytics officer (CAO).
Why Is Downstream Data Important?
Downstream data has been electronically available on a weekly basis since the late 1980s. But most companies have been slow to adopt downstream data for forecasting and planning purposes.
Downstream consumption data is stored within the commercial side of the value chain. Examples include retailer POS data, syndicated scanner data from Nielsen, Information Resources Inc. (IRI), and Intercontinental Marketing Services (IMS). Prior to electronically available downstream data, manufacturers received this type of data in hard copy format as paper decks (after a 4- to 6-week lag). Once received, the data points were entered manually into mainframes via a dumb terminal (a display monitor that has no processing capabilities; it is simply an output device that accepts data from the CPU). In fact, downstream consumption data has been available to consumer goods companies for many decades. Nevertheless, the quality, coverage, and latency of downstream data has improved significantly, particularly over the past 30 years, with the introduction of universal product barcodes (UPC) and retail store scanners.
In fact, companies receive daily and weekly retailer POS data down to the SKU/UPC level through electronic data interchange transfers (an electronic communication method that provides standards for exchanging data via any electronic means). These frequent data points can be supplemented with syndicated scanner data across multiple channels (retail grocery, mass merchandiser, drug, wholesale club, liquor, and others) with minimal latency (1- to 2-week lag) by demographic market area, channel, key account (retail chain), brand, product group, product, and SKU/UPC. Downstream data are the closest source of consumer demand above any other data, including sales orders and shipments. Unfortunately, most companies primarily use downstream data in pockets to improve sales reporting, uncover consumer insights, measure their market mix performance, conduct price sensitivity analysis, and gauge sell through rates. Very few manufacturers, including consumer goods companies, however, have designed and implemented an end-to-end value supply chain network to fully utilize downstream data.
It is apparent that companies' supply chains have been slow to adopt downstream data, although POS data from retailers has been available for decades. Initially, the decision to use downstream data was a matter of data availability, storage, and processing. Today, this is primarily a question of change management due to corporate culture, particularly from a demand forecasting and planning perspective. So, what are the barriers? In large part, the adoption rate is slow because supply chain organizations have not approached the use of these new forms of downstream data from a holistic standpoint. Instead of mapping new processes based on a strong data and analytics strategy, supply chain organizations have tried to force-fit this data into existing processes using Excel, with no real analytics and a lot of manual manipulation. This is happening even though channel data are now available for anywhere from 50% to 70% of the retail channels, and the delivery time has improved significantly with data latency of 1–2 weeks. Given all these improvements, however, many companies still feel downstream data cannot be used for demand forecasting and planning.
Meanwhile, confronted with demand challenges due to the digital economy and COVID-19, companies have been looking for new ways to predict future demand. Under these changing conditions, the traditional demand planning technology has been ineffective at predicting shifting consumer demand patterns. The main reason for the unsuccessful performance of traditional technology is directly related to the fact that most companies are not forecasting demand, but rather supply—that is, shipments—which is proven to be much more volatile as a result of the digital economy, not to mention disruptions like COVID-19. Customer orders, sales invoices, and shipments are not true demand. They are the reflection of retailer and manufacturer replenishment policies—as seen in the bullwhip effect. To make matters more difficult, traditional demand forecasting processes and enabling technology were not designed to accommodate POS/syndicated scanner data, let alone the more sophisticated analytical methods (predictive and AI/machine learning) required to sense shifting consumer demand patterns and to shape future demand to create a more accurate demand response.
To reduce volatility and gain insights into current shifting consumer demand patterns, companies are turning to POS/syndicated scanner data, but are finding that using those data sources for demand forecasting and planning is complex. Perhaps it is because they are not familiar with downstream data, as most demand planners report into operations planning too far upstream removed from the customer/consumer, rather than downstream in sales and marketing. Another reason is that most companies do not collect downstream data on an ongoing basis over multiple years. They normally collect it on a rolling 104-week basis. This trend is no longer a barrier as companies are creating demand signal repositories (DSRs) to capture downstream data by week for more than 104 weeks, which allows them to compare downstream consumer demand to upstream shipments and/or sales orders.
Others will admit that what retailers sold last week, or even yesterday, is not necessarily a good predictor for what they will order next week or tomorrow. This is a myth, as companies have been keeping inventories low with more frequent replenishment because retailers are no longer allowing manufacturers to load up their warehouses at the end of every quarter with their products. As a result, there is a direct correlation with weekly POS/syndicated scanner data at the product level, and in many cases at the SKU/UPC levels (see Figures 3.5 and 3.6). As you can see, there is a strong correlation between weekly shipments and syndicated scanner data. Most consumer goods companies now capture their shipment data daily/weekly by channel and key account, down to the SKU warehouse distribution point.
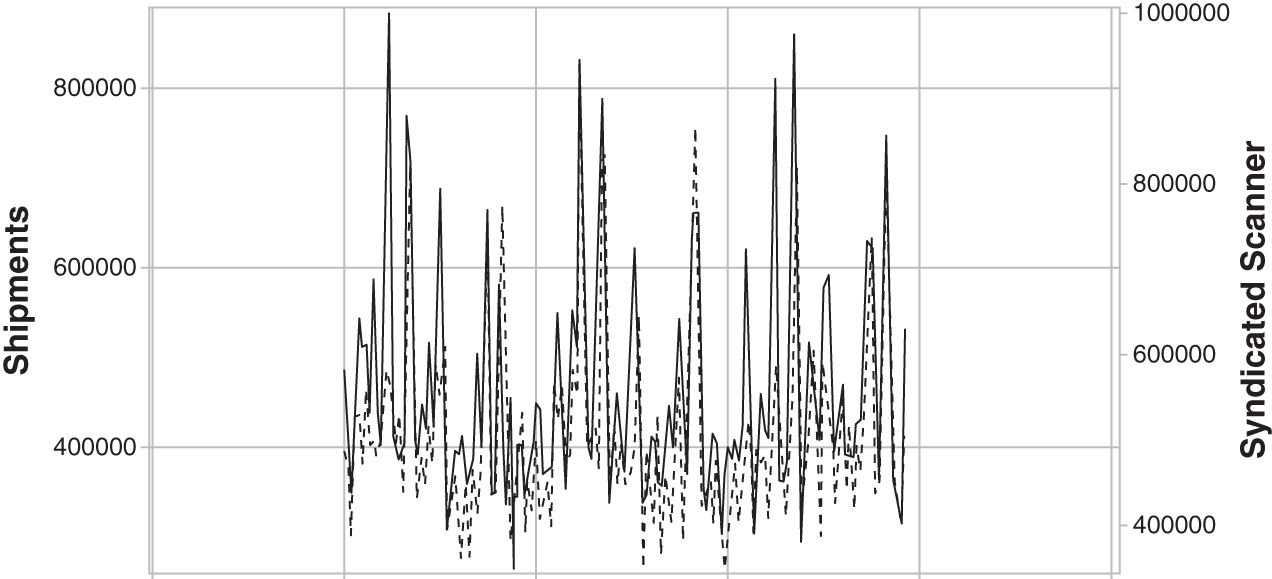
Figure 3.5 Shipments (Supply) Versus Syndicated Scanner Data (Demand)
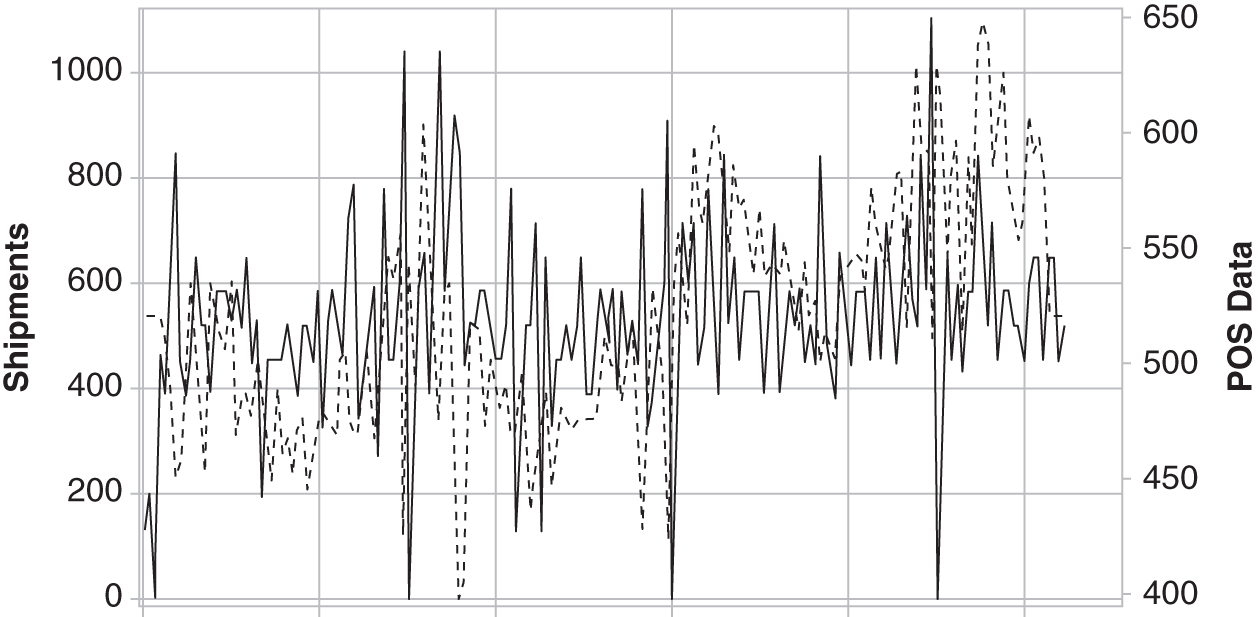
Figure 3.6 Shipments (Supply) Versus POS Data (Demand)
Another barrier has been scalability. Many companies feel that adding downstream channel data to demand forecasting involves a magnitude of effort and complexity that is well beyond what most demand planners can handle to source, cleanse, and evaluate. However, new processing technology (e.g. parallel processing, grid processing, in-memory processing, and cloud computing) leveraging advanced analytics in a business hierarchy along with exception filtering has enabled several visionary companies to overcome these difficulties. The promise of downstream data can be realized with the right technology on a large scale using advanced analytics, as well as AI/machine learning.
The real barriers are internal corporate culture, lack of analytical skills, and the desire to take that first step. The best way to incentivize sales and marketing to participate in your Sales & Operations Planning (S&OP) and Integrated Business Planning (IBP) processes is to integrate downstream data into the demand forecasting and planning process. Without it there is no real reason for sales and marketing to participate. Downstream data are the sales and marketing organizations' “holy grail” to consumer demand. Furthermore, if demand planners were using POS/syndicated scanner data, they would have seen the shifting consumer demand patterns due to COVID-19 within the first or second week of the crisis.
Demand Management Data Challenges
Most demand forecasting and planning initiatives are abandoned or considered failures due in part to data quality challenges. The right data input has several important dimensions that need to be considered for success of any process. Harnessing the right data always appears to be straightforward and relatively simple; however, bad data, or use of the wrong data, often is the real reason behind process failure.
Almost all demand forecasting and planning systems use some form of statistical forecasting methods that require historical data. In most cases, companies choose to use shipment data, or sales orders data, to predict future product demand, as both are readily available and best understood by demand planners who are responsible for the demand planning process. According to recent research close to 70–80% of companies still use either shipments or customer orders data for demand forecasting and planning, which are their supply and replenishment signals, not their true demand signal. Unfortunately, product shipments data, as well as sales orders, contain several undesirable components, including incomplete or partial order fills, delivery delays, and retail channel load effects due to promotions, supply policies that do not always reflect true demand, and sales/marketing strategies designed to generate incremental consumer demand (e.g. sales promotions, in-store merchandising—displays, features, feature/display, temporary price reductions (TPRs) on shelf, and others). Consequently, shipments data represents how operations planning responded to customer demand (sales orders—replenishment), not consumer demand itself (POS/syndicated scanner data—consumer purchases selling through retailer cash registers).
Demand forecasting and planning systems must build plans off a forecast and use shipments data as a measure of effectiveness in meeting those plans. Sales orders from retailers less any customer returns are the next best data representing customer (retailer) demand, but not necessarily the best demand data input for the statistical forecasting process. The closest data to consumer demand is POS and/or syndicated scanner data. Although many companies collect and store POS/syndicated scanner data, less than 40% of companies use POS data for demand forecasting and less than 10% use syndicated scanner data, according to recent surveys. Everyone agrees that POS/syndicated scanner data is the closest data to true consumer demand, yet both these data streams are among the most underutilized for demand forecasting and planning. To make matters worse, roughly 70–80% of companies are using historical shipments “adjusted” for trend and seasonality cleansed of promotions and outliers, separating the data into historical baseline volume and promoted volume creating two separate data streams, which is a bad practice.
HOW MUCH DATA SHOULD BE USED?
An accurate statistically generated forecast has several elements (patterns) including trend, seasonality, holidays, sales promotions, marketing events, and other related causal/explanatory factors. There must be enough demand history in order to statistically model those patterns associated with these elements to produce an accurate forecast for future periods. In most cases, this means a minimum of three years of historical data, and ideally three or more would be best to capture seasonality. Most demand forecasting and planning systems use monthly summaries of product demand (transactional shipments data) separated either by the manufacturing source or the distribution point. In other words, the data must reflect the business hierarchy with the same periodicity (historical time interval) including geography, market, channel, brand, product group, product, SKU, UPC, distribution centers (DCs), and customer ship-to points. Although less data can be utilized—one to two years—the results may not completely reflect the true nature of demand, particularly regarding seasonality, holidays, and promotional effects.
In 2020, demand planners are still spending anywhere from 50% to 80% of their time cleansing, managing, and disseminating data and information across the organization, rather than using the data and information to improve forecast accuracy and uncover insights. They are merely managers of data and information. As data continues to grow in volume, velocity, and variability, and there is more pressure to drive revenue growth, demand planners will be asked to not only improve forecast accuracy but find new insights that are actionable to proactively drive revenue and profit. As such, companies need to invest in data quality, new analytics skills, predictive analytics, and technology. Demand planners will need to transition from managers of data and information to demand analysts (data scientists) with a focus on predictive analytics driving revenue growth and profitability. It has been established that improved forecast accuracy can add as much as 3–7% to revenue and profitability.
Demand-Signal Repositories
There are many challenges to implementing a consumption-based forecasting and planning process. Many of the data sources are new for most companies to manage, so ownership, expertise, and governance are important—not to mention change management requirements to not only gain adoption, but also governance to make it sustainable. Many executives say that their organizations are still in the basic stages of data integration due to data quality and internal lack of skills about how to maximize analytic benefits. In today's business environment, there are significant financial implications to ineffectively managing all the data streaming from multiple sources. These challenges can take the form of higher costs and lower revenue due to conditions such as ineffective demand planning, non-optimized inventory, strained product launches, and higher out-of-stocks on shelf.
Companies across a myriad of industries understand the importance of transforming into a data-driven company. The challenge is to gather, cleanse, and access the vast amount of downstream demand data, and normalize and harmonize it with upstream transactional information. Downstream data can be difficult to master and govern without a cohesive approach across the organization. Nevertheless, companies are investing in demand signal repositories as an integrated information hub that provides the foundation for breakaway analytics and optimization across the enterprise. Utilizing data to its fullest potential includes such sources as retailer POS; syndicated scanner sources (Nielsen, Information Resources [IRI], and others); loyalty programs; consumer panels; mobile, online, and social media; as well as ERP systems, finance, and internal systems—all of which are available to drive powerful analytics. Downstream consumption data are now more widespread, with many retailers sharing POS data with consumer goods companies daily. As a result, they expect enhanced knowledge from their consumer products suppliers. The demand-signal repository is a central data mart that houses all this information.
The successful implementation of a demand signal repository, supercharged by consumption-based analytics, is dependent upon managing POS/syndicated scanner data effectively, and complementing it with specific internal data, such as the company's product hierarchy. This exercise makes the POS/syndicated scanner data a more robust source of information to analyze with more dimensions that can be “sliced and diced” to gain more actionable insights. This type of data comes from internal corporate systems, local repositories, IoT, and spreadsheets. Furthermore, it is usually manually maintained and thus not subject to good data governance.
What Are Demand Signal Repositories?
A demand signal repository (DSR) is a data repository designed to integrate consumer demand data and leverage that data by consumer goods companies, automotive manufacturers, electronics manufacturers, pharmaceuticals, and others to service retailers and end user consumers efficiently. The focus has been on synchronizing POS/syndicated scanner data with internal shipment and replenishment data, which allows companies to provide business users with a more complete view of their retail performance. The DSR itself is a data repository that stores the information in a format that allows for easy retrieval so that users can quickly query the database to identify what's selling, where, when, and how. Identifying marketing opportunities, “demand performance,” and out-of-stock (OOS), along with control tower tracking and monitoring, are the key requirements for demand forecasting and planning. Leveraging demand signal analytics (DSA) data for demand forecasting and planning using predictive analytics is where the real benefits of such applications can help to identify and measure past, current, and future impacts on consumer demand. With the right architecture, DSRs will continue to grow with the business needs. They will be leveraged across multiple business groups, including demand management, channel marketing, supply chain management, inventory management, promotion, and event management.
Demand signal repositories are defined as centralized data repositories that store and harmonize attributes, and organize large volumes of demand data such as POS data, wholesaler data (electronic data interchange [EDI]), inventory movement, promotional data, and customer loyalty data for use by decision support technologies (channel marketing analysis, shopper insight analysis, demand forecasting and planning, inventory replenishment, and more). Demand signal visualization (DSV) dashboards provide companies with faster decisions and scenario modeling for outcomes and accurate decisions. Furthermore, demand signal analytics (DSA) combines DSV with predictive analytics, allowing companies in real time to conduct root-cause visualization and exploration. DSR, DSV, and DSA are at the heart of being analytics driven. To reap the maximum benefit from a true consumption-based planning process takes commitment and a well-conceived plan, which requires a best-in-class demand signal repository at the core.
Benefits of a Demand Signal Repository
The augmentation of DSR data into the demand planning process improves visibility and control. POS/syndicated scanner data can be a tremendous asset when used properly. By integrating POS/syndicated scanner data with company-specific attributes, consumer goods companies can leverage that data by collaborating more effectively across the organization and with their retailer (customer) networks. POS data can then drive commercial and operational improvements, such as:
- Improving demand forecast accuracy, and enhancing demand-sensing and shaping activities;
- Sensing shifting consumer demand patterns faster and more effectively;
- Improving evaluation of new product information via integration of sentiment analysis;
- Increasing trade promotion effectiveness;
- Reducing out-of-stocks; and
- Lowering inventory and safety stock levels.
WHAT ARE USERS LOOKING TO GAIN?
Users are looking for easy-to-use visualization tools with predictive analytics capabilities to uncover market opportunities with the ability to more efficiently synchronize demand and supply to take advantage of the information stored in their DSRs. If they can't, then they have a point solution that is proprietary, and not a true DSR. An open architecture should have an intuitive point-and-click user interface with strong visualization capabilities that lets users easily access reports to help them understand their sales, manage category and brand information, and more. Users should be able to easily drag, drop, and drill into information. They should be able to pull data from multiple data sources, share reports securely, and create alerts. In addition, users that have specific job requirements, such as price elasticity or analyzing promotional ROI that aren't handled in their DSR, require an exploratory capability that uses predictive analytics that leverages POS/syndicated scanner data and shipments (supply) and replenishment data.
Alerts combined with predictive exploratory capabilities, using visualization, will allow users to pinpoint areas of the business that require immediate attention. The goal of a DSR is to provide faster access to more information, improve retailer relationships, maximize ROI, streamline internal efficiencies, improve performance at all stages of the supply chain, and support multiple departments and teams. Most DSRs fall short of their promise, however, by not providing control towers (dashboards) and descriptive reporting to monitor and track their business year after year, with virtually no predictive analytics to uncover insights into the data that are actionable. Spreadsheets are no longer adequate to take advantage of the information in a DSR, not to mention not scalable enough.
Why Is It Important?
If you want to be more proactive than simply basing replenishment on shipments data, you need access to downstream data, analysis, and insights to make decisions that put you ahead of the demand curve. There is more to it than just forecasting trends and seasonality. Demand sensing is about identifying and measuring market signals, and then using those signals to shape future demand.
Using consumer data effectively requires making an investment in a demand signal repository to harmonize and cleanse POS/syndicated scanner data so that it is usable for data analytics. Consumption-based analytics using downstream data, as well as inventory, shipments, and replenishment data, are current examples of using “structured” data. While the term “downstream data” is most often connected to consumption and inventory data, “unstructured data”—such as loyalty data, social sentiment, consumer perception attitudinal data—is starting to be used for targeting consumers, shaping demand, and improving new product launch effectiveness. Using text analytics, we can now transform unstructured data into structured data that can be combined with the breadth of our data in predictive and machine learning models, and then visualized using control towers and dashboards to create value by enabling faster, more effective business decisions.
What Is Consumption-Based Analytics?
Consumption-based analytics uses the combination of visual analytics and predictive analytics to access the data in DSRs to uncover actionable insights with minimal latency. You can think of DSA as being composed of three layers. The foundational layer is a demand signal repository (DSR), an integrated database of essential data that companies need to provide insight into sales, marketing, inventory, price, demand performance, and operations. The DSR harmonizes, normalizes, and integrates the raw demand and supply data from any source (POS, wholesalers, mobile, online, social media, weather, EDI, inventory, syndicated scanner data, promotional/marketing information, customer loyalty data, and more). It works with any data type or source format from multiple retailers, distributors, and their respective disparate systems to make that data available for retrieval, query, reporting, alerts, and analysis.
In summary, the second layer uses visual analytics to transform the DSR data into DSV to allow for exploration, analysis, and insights that suggest areas of focus, improvement, and action. While typical marketing research only provides answers to predefined questions, DSV provides insight into questions companies didn't initially know to ask. The third layer combines DSR and DSV, creating DSA. The addition of predictive and anticipatory analytics complements the descriptive analytics of DSV, and quantifies the direction, size, scope, and variability of supply chain replenishment. Figure 3.7 illustrates a typical interactive visualization combined with predictive analytics, which allows the demand planner to review both demand and replenishment.
Chapter 4 discusses in depth how using consumption-based forecasting companies can predict shifting consumer demand patterns and their impact on supply by linking POS/syndicated scanner data to shipments using predictive analytics. Effectively adjusting to changing market conditions using consumer demand requires aligned strategies across a brand's personnel, processes, measurement, and tools, as well as a demand analyst (data scientist) working closely with product management and demand planning. Product managers provide insights into their sales/marketing programs, as well as the overall dynamics of the marketplace, while the demand analyst models consumption, providing marketing with what-if simulation capabilities that test marketing strategies to optimize marketing investment. The results help brands navigate the current volatile market environment caused by the COVID-19 crisis while driving sustained optimization over the long term. Once consumption has been forecasted and linked to shipments, the demand planner can begin to determine the actions needed to meet that demand signal from a supply planning perspective, creating a final constrained demand plan (supply plan).
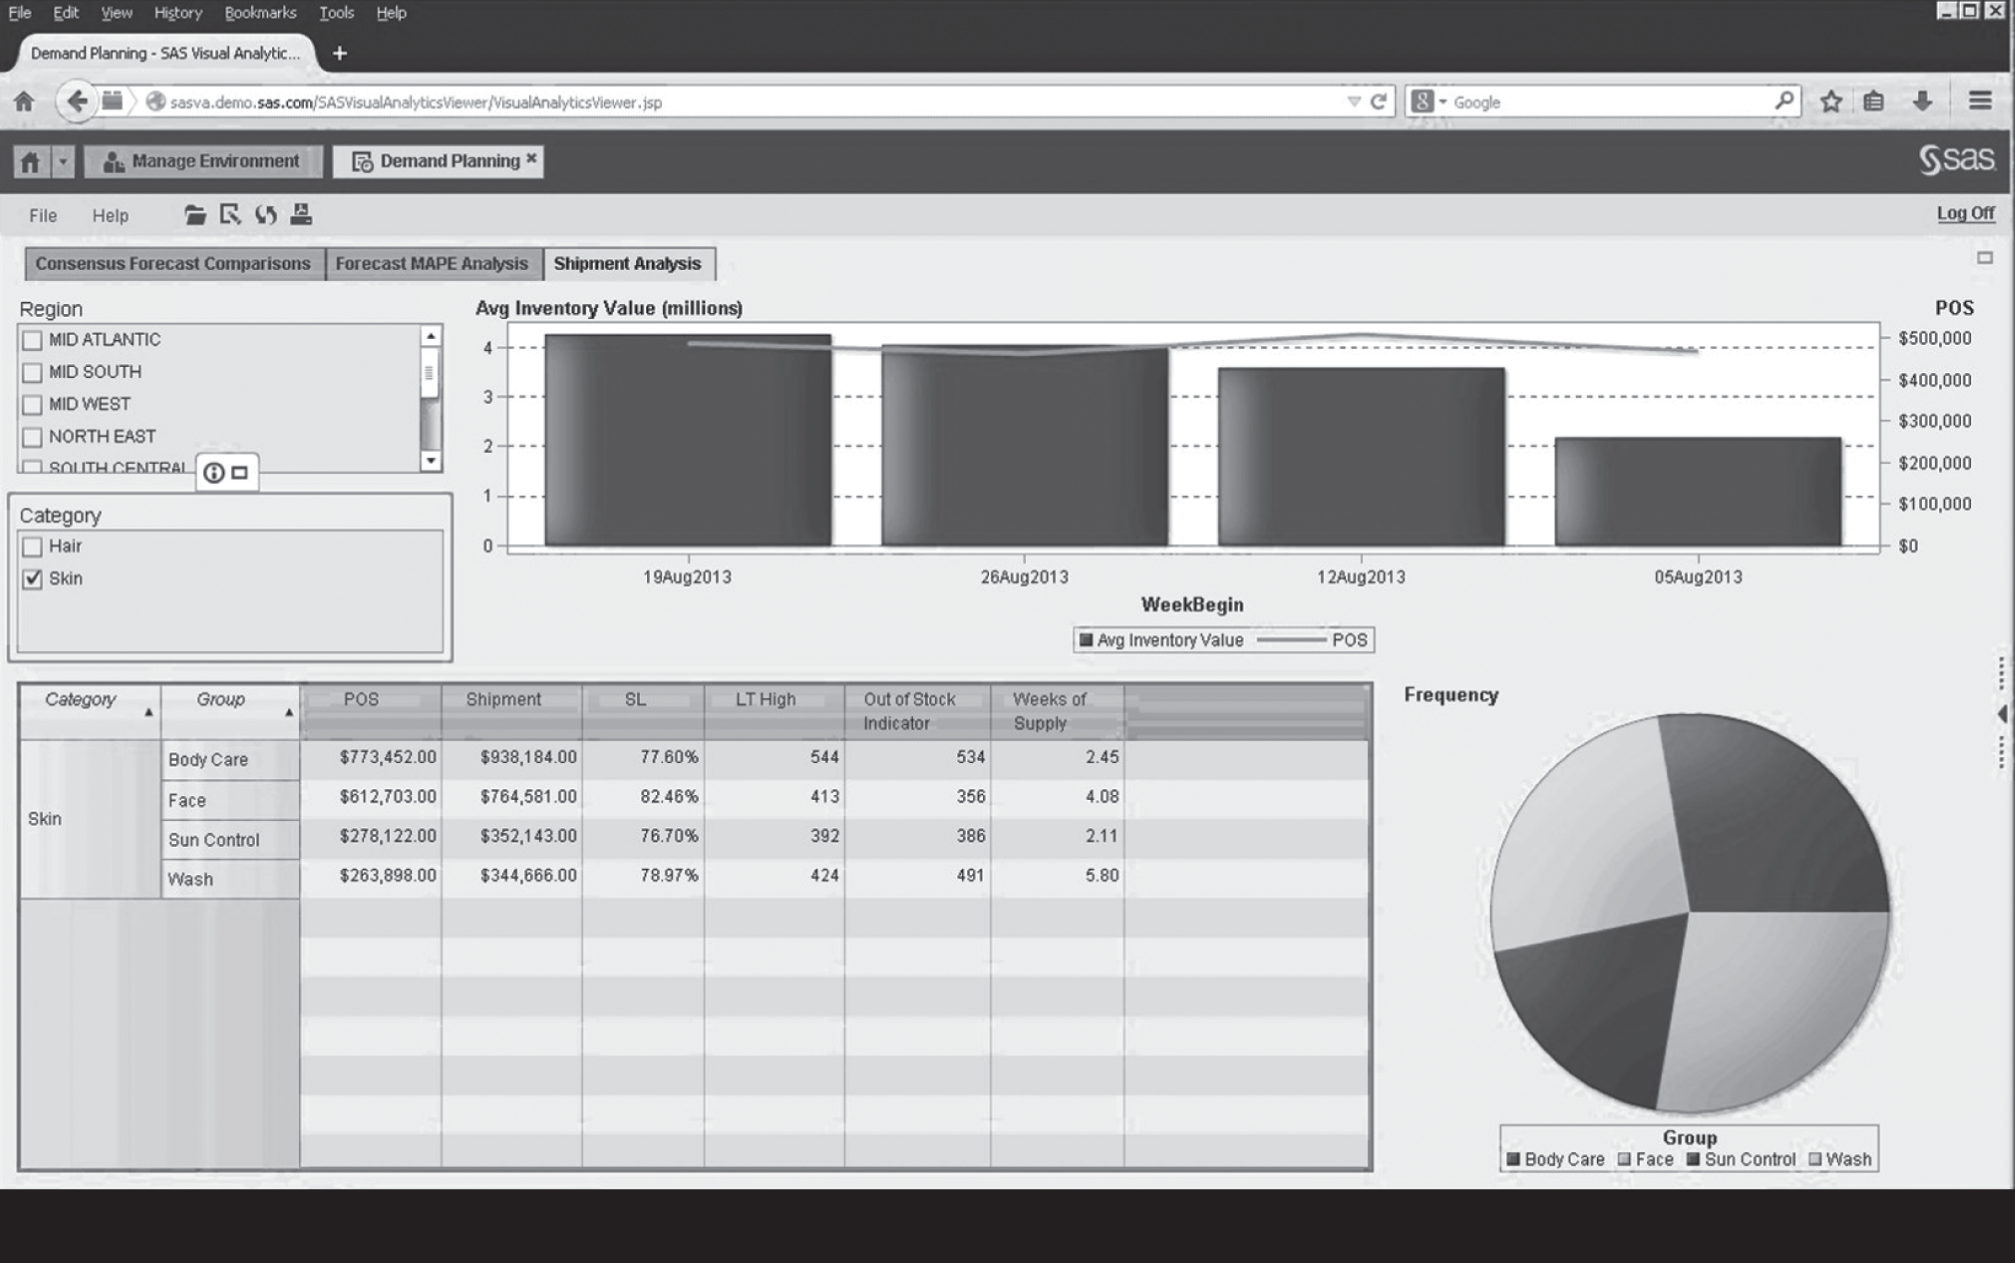
Figure 3.7 Consumption-Based Analytics Combining Descriptive and Predictive Analytics
CLOSING THOUGHTS
As supply chain executives stand at the edge of the new digital economy and look forward, what they see is a new world of opportunities. Data and analytics will shape our lives in ways that are hard to comprehend; but one thing is certain, the processes, people, analytics, and technology requirements will undoubtedly transform not only the way we do business, but will disrupt and completely transform demand management. The real challenge is not that companies are acquiring large amounts of data as a result of IoT, but how they utilize predictive analytics to drive digital transformation. It's what they do with their data that matters. The hopeful vision for data and analytics is that organizations will be able to harness relevant information and use it to make better informed decisions to react more quickly to disruptions.
Analytics and technologies today not only support the collection and storage of large amounts of data, but they also provide the ability to understand and take advantage of its full value, which helps organizations run more efficiently and profitably. For instance, with data and analytics, it is possible to:
- Sense shifting consumer demand patterns, shape future demand for millions of SKUs, and determine optimal prices that maximize profit and reduce inventories, while maintaining higher customer service levels.
- Mine downstream consumer demand data for insights that drive new sales and marketing strategies for consumer retention, campaign optimization, and next best offers.
- Generate retail coupons at the point of sale (POS), based on the consumers' current and past purchases in real time to ensure a higher redemption rate.
- Send tailored recommendations to mobile devices at just the right time, while consumers are in the right location to take advantage of offers.
- Analyze data from online, mobile, and social media to detect new market trends and changes in consumer preferences.
- Determine root causes of failures, issues, and defects by investigating user sessions, network logs, and machine sensors.
Several recent technology advancements are enabling companies to make the most of data and analytics, such as cheap, abundant storage and server processing capacity, faster processors, and affordable large-memory capabilities in the cloud. New storage and processing technologies are designed specifically for large data volumes, including structured and unstructured data. Parallel processing, clustering, MPP (Massive Parallel Processing), virtualization, large grid environments, high connectivity, and high throughputs are making it possible to process data faster. Cloud computing and other flexible resource allocation arrangements are becoming more desirable and cost-effective. Data technologies not only support the ability to collect large amounts of data, but they also provide the ability to understand it and take advantage of its value. The goal of all companies with access to large data collections should be to harness the most relevant data and use it for optimized decision making. The transformation from DSR to DSV and ultimately DSA will require leadership, a strategic vision, a road map of priorities, and the ability to execute against the organization's strategy. Achieving best-in-class status across every measure could merely mean adding unnecessary cost and complexity. What's important is to invest in people, process, analytics, and technology improvements that are valued by customers. Leaders make conscious trade-offs, with an understanding that it may be appropriate to have benchmarks that are at par with industry averages, while at the same time having other measures that reflect best-in-class outcomes.
Now that many companies have created DSRs, the move to the next level will require the migration to DSV, and then ultimately to DSA. Until those companies implement DSV and DSA, they will not have the capabilities to take full advantage of all the data collected, normalized, harmonized, and loaded into their DSRs. In order to take full advantage of their DSRs, companies will need to add a second layer of DSV combined with a third layer of DSA. With DSA, companies can get a nearly real-time picture of retail store level sales and inventory replenishment trends while identifying potential challenges and market opportunities. The entire organization can take advantage of the predictive intelligence of DSA by easily visualizing (using DSV) large data repositories of facts and measures at the lowest granularity across account hierarchies, category/item hierarchies, and geographical hierarchies. In addition, DSA can deliver targeted alerts to enable exception-based processes and workflow.
It is very important to understand that not all data will be relevant or useful. This challenge is widely acknowledged. Most businesses have made slow progress in extracting value from live streaming data by migrating to DSRs. Others attempted to apply traditional data management practices to the data, only to learn that the old rules no longer apply. Investing in DSRs with DSV and DSA capabilities with a set of prepackaged reports, dashboards, and easy-to-use exploration capabilities designed to support demand management, brand management, category management, and product performance along with score carding capabilities, can accelerate time to value.
NOTES
- 1. Transforming Core Consumer Products Functions with Advanced Analytics, A CGT Custom Research Report Partnered with IBM: 1–10. https://consumergoods.com/transforming-core-consumer-products-functions-advanced-analytics
- 2. Ibid.
- 3. Ibid.
- 4. Design a Data and Analytics Strategy: Advance Your Organization's Strategy by Communicating the Business Value of Data and Analytics, ebook, Gartner, Inc., 2019: pp. 1–16. https://www.bastagroup.nl/wp-content/uploads/2019/05/Data-analytics-strategy-ebook.pdf
- 5. Data, Analytics, & AI: How Trust Delivers Value, MIT SMR Connections, Custom Research Report, on behalf of SAS, 2019: 1–23. https://www.sas.com/en/whitepapers/mit-data-analytics-ai-110173.html