
Chapter 5. Monitoring, Metrics, and APM
The CI and deployment pipeline tests give us confidence that our change will work in Production. This confidence comes from a combination of functional testing, covering the user-facing behavior of the system, and technical/performance testing, covering operational aspects of the system. However, after we have released our code to Production, how do we verify that the state of your system is still good and has not degraded? This is where monitoring comes in.
Performance Counters Are Insufficient
Windows provides Performance Counters to allow monitoring of server health. These standard counters will provide information such as memory and CPU usage and some generic .NET framework information such as number of exceptions thrown and time spent in garbage collection. However, these do not tell you if your app is working as expected, only whether the machine is under any load, and custom performance counters are tricky to work with.
Record Application Metrics
Open source tooling can be used very effectively for gathering application metrics. StatsD and Graphite are a common pairing; hosted on Linux, they are cost-effective to set up.
StatsD listens for statistics, like counters and timers, sent over UDP or TCP, and sends aggregates to the Graphite backend. Graphite (Figure 5-1) provides querying and graphing tools to visualize the metrics. Many open source .NET clients exist that make it simpler to add StatsD metrics to your applications; they can be found in the NuGet package collection at http://nuget.org/.

Figure 5-1. Graphite Composer
Tip
For further reading on Graphite, refer to the book Monitoring with Graphite by Jason Dixon.
Cloud-hosted metrics and monitoring tools such as DataDog, DataLoop, and ServerDensity provide native support for Windows servers and can easily be integrated with other tools. In particular, UpGuard (formerly ScriptRock), as shown in Figure 5-2, has powerful capabilities for detecting and visualizing configuration differences.
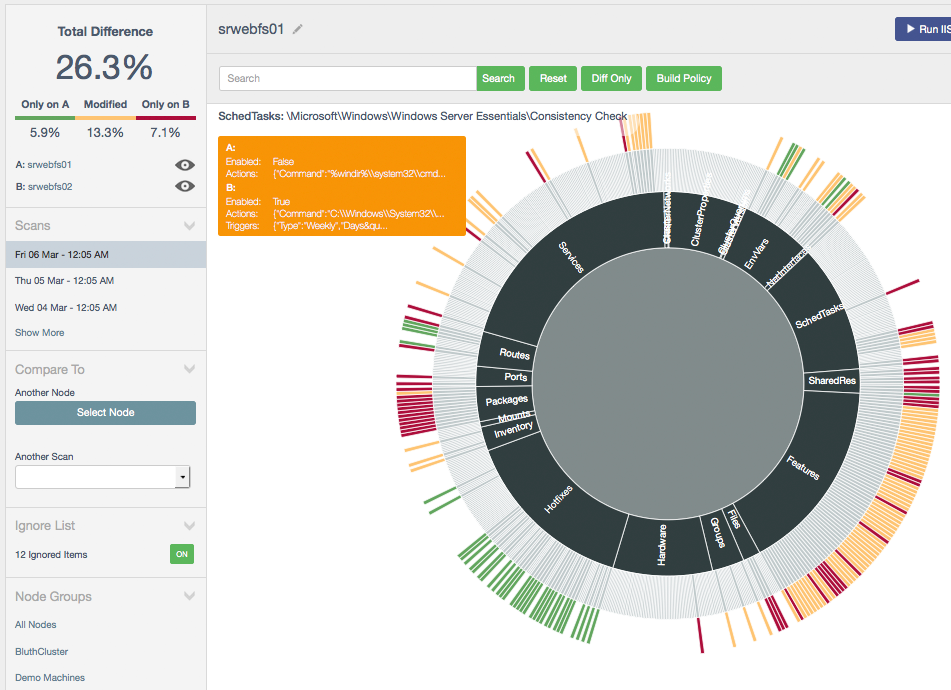
Figure 5-2. UpGuard (formerly ScriptRock)
Application metrics collected and analyzed with modern tools can be a very powerful way of understanding the inner workings of your platform.
APM Tools Can Complement Monitoring
Application Performance Management (APM) tools such as NewRelic and AppDynamics use agents installed on your servers to collect monitoring data, which is sent back to a central server. They are great as a way to get immediate insight into a Production platform; they automatically collect and aggregate data on server health and application health. They hook into the .NET runtime and collect more detail about the application, such that if an exception is thrown, it can collect a stacktrace. They allow for digging into performance issues, including highlighting potentially slow database queries. They can also provide alerts based on the data collected.
In a distributed system they will automatically add correlation data allowing tracing of a single request through all components that have had the APM agent installed. This allows the tool to build up a picture of the platform and highlight any particularly non-performant components.
Use Developer Metrics Tooling
For web applications, you can get powerful insights into your application’s performance and behavior by using Glimpse (Figure 5-3), which traces a wide range of execution details and presents them in a “head-up display.”

Figure 5-3. Glimpse for development metrics
The metrics include detailed statistics on HTTP, server-side metrics (including SQL execution), and AJAX (asynchronous JavaScript).
With Visual Studio 2015 and later you can use the Application Insights service from Microsoft to instrument and monitor your web application (Figure 5-4).
Application Insights can also monitor non-.NET applications including J2EE Java, JavaScript, Python, and Ruby.

Figure 5-4. Application Insights
Aggregate Application and Windows Event Logs from All Machines
Historically, application logs were often used to record only errors and exceptional conditions. However, with the power and features of modern log aggregation tools, we can use logging as a way to gain deep insights into how our software is operating (Figure 5-5). In a Windows context, we can aggregate (bring together) logs from the Windows Event Log subsystem and our own application logs written with frameworks such as log4net or Serilog and search all the log entries using a web browser.

Figure 5-5. Log aggregation
The ability to search across all logs for time-coincident events or a specific text string is hugely powerful, especially if we use log aggregation tools that are available in upstream environments. In fact, if we use log aggregation tools on developer machines, we can reduce our reliance on the debugger for some diagnostic activities.
There are several log aggregation tools that work well with Windows and .NET, including:
-
ELK (Elastic Search, LogStash, Kibana; on premise): Use NxLog as a log forwarder (or the default forwarder if Java is available)
-
LogEntries (hosted): Provides good integrations with other tools alongside metrics capture
-
Loggly (hosted)
-
NewRelic (hosted)
-
Papertrail (hosted)
-
Seq (on premise or hosted): Good for structured event data
It’s also worth investigating Serilog (possibly together with Seq), an advanced .NET logging framework that uses structured logging to capture more detailed and meaningful log output. Serilog replaces log4net as the logging library for application code.
Summary
Using dedicated tools for metrics collection, APM, and log aggregation, we can continuously verify that the state of our deployed software is healthy and has not degraded. We can use the insights from these tools in our development teams to improve the quality of the software on a frequent, ongoing basis.