
Useful Measurement Definitions
Return On Investment (ROI)
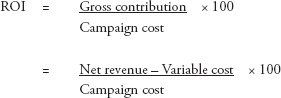
Return on Investment (ROI) is a financial metric of profitability that is widely used to measure the return or gain from an investment. It is a simple ratio of the gain from an investment relative to its cost. It is used to evaluate the efficiency and effectiveness of an investment.
In CRM, it can be used to measure the effectiveness of an individual marketing or sales campaign or the payback on customer development.
Individual Campaign
This applies to any individual campaign, deployed against either acquisition or retention objectives, where there is a call to action connected to a measurable response on transaction value.
Notes
A. Net revenue = Gross revenue less VAT less any trading discounts
B. Variable cost = Costs of the product (e.g., raw materials, packaging, production cost, and distribution for a manufactured product) or providing the service
C. Gross contribution is a measure of gross profit equating to profit before sales and marketing cost, overheads, and contribution to net profit.
D. Campaign cost = Media cost (e.g., direct mail = creative design, creative production, materials, production of mailing piece, delivery) plus any incentive; for example, money off coupon. For the latter, ensure the cost is not double counted—it is either accounted for in the net revenue figure or in the campaign cost.
E. Any figure above 100 percent indicates a positive return.
Customer Development
In this scenario, we are looking at the payback period and associated return from the time a new customer is recruited. This incorporates the acquisition and retention costs where the latter is involved in nurturing an ongoing relationship; for example, loyalty program.
This is best illustrated by reference to a theoretical model based on a bottle of malt whisky. The relevant parameters are:
- |
Acquisition cost |
= |
£7 per new recruit |
- |
Retention cost |
= |
£5 per customer per year covering the cost of the relationship marketing program |
- |
Gross contribution |
= |
£10 per bottle |
The payback model per new recruit is illustrated in Table 11.1.
Table 11.1 Payback model for a new recruit
YEAR 1 |
YEAR 2 |
YEAR 3 |
|
Acquisition cost |
£7 |
£0 |
£0 |
Retention cost |
£5 |
£5 |
£5 |
TOTAL COST |
£12 |
£5 |
£5 |
Bottles bought per year* |
0.75 |
1.5 |
1.5 |
Gross contribution |
£7.50 |
£15 |
£15 |
Net contribution per year |
(£4.50) |
£10 |
£10 |
Cumulative net contribution |
(£4.50) |
£5.50 |
£15.50 |
*Incremental number of bottles bought per year
Notes
A. Break-even is passed in year 2 from when a positive contribution to profit is made
B. This simplistic model assumes a 100 percent retention rate. It will need to be adjusted to take account of the actual retention rate.
Customer Lifetime Value (CLV)*
Customer Lifetime Value is the total worth of an individual customer over the lifespan of their relationship with the company/brand—how much revenue to be made from an individual customer. It equates to the revenue an average customer will provide a brand/company before they discontinue their patronage. In this context, the simple formula to apply is to multiply the average annual revenue by the average lifespan of a customer as shown below:
Average annual revenue per customer x average lifetime of customer = Customer Lifetime Value
In reality, there are three factors that have an impact on the value:
• The purchase frequency of the product or service. For example, someone will buy food on a weekly cycle whereas someone may only decorate their house every 10 years.
• The lifespan of the purchase cycle. For example, someone may eat out at a restaurant at least once a year from the age of 22 years to the age of 75 years, whereas they only bought a baby buggy once in their lifetime at the age of 35 years. In this context, the annual purchase rate may vary at different life stages of the customer, which needs to be taken into account. For example, a customer’s weekly supermarket shop will be potentially higher between the ages of 32 years and 55 years when children are at home than post children.
• The share of wallet a brand/company has of the customers’ annual spend on the product/service category. This is a measure of brand loyalty with, obviously, 100 percent loyalty equating to the brand/company enjoying the full patronage of the customers’ spend.
As a first step, it is important to evaluate the full potential worth of a customer across the possible lifespan of the customer being active in the product/service category—their total gross worth based on their total spend. This provides the ceiling of revenue opportunity based on 100 percent of the customer’s spending on the category being with the individual brand/company.
This is illustrated below in Table 11.2 using a theoretical model based on the restaurant sector.
Table 11.2 Customer Lifetime Value calculation based on the restaurant sector
AGE BREAKS: YEARS OLD |
|||||||
17–34 |
35–44 |
45–54 |
55–64 |
65–74 |
75+ |
TOTAL |
|
Average annual customer value (£) |
400 |
450 |
500 |
575 |
450 |
400 |
465 |
Number of years as a customer |
13 |
10 |
10 |
10 |
10 |
5 |
58 |
Customer value by age break/cum (£) |
5,200 |
4,500 |
5,000 |
5,750 |
4,500 |
2,000 |
26,950 |
Assumptions:
1. Customer first becomes a customer at the age of 17 years and will be an active customer until the age of 80 years.
2. Annual customer value reflects the average spend levels at the various life stages.
3. Values based on constant 2019 values with no allowance for inflation.
4. Note, the analysis is based on the average customer. As with any sector, there will be a heavy user segment where the potential returns will be correspondingly greater.
This analysis yields the potential lifetime value of a customer and should act as the reference point for strategic planning. For example, if your current share of wallet is 35 percent, an increase to 50 percent would yield an incremental lifetime value increase of £4,042.50 per customer. This would translate into an incremental revenue stream of £404,250,000 per 100,000 customers!
This demonstrates the strategic importance of using customer lifetime value as a KPI. Increasing customer lifetime value demonstrably increases the total value of the business and therefore the worth of the business.
It also ensures the strategic focus on three important customer dynamics:
1. Improving prospect to customer conversion
2. Reducing customer churn
3. Increasing brand share of customers’ category spend (Share of wallet)
*(Bahman, Hajipour, and Molud Esfahani, Delta Model application for developing customer lifetime value, Emerald Insight – Marketing Intelligence and Planning, accessed October 8, 2018), (Baran, Zerres, and Zerres, Customer Relationship Management, Bookboon.co, accessed May 30, 2019), (Pfeifer and Bang 2005)
Customer Churn
This is one of the most important metrics in customer management and development; particularly for a company that is growing. It provides the quantified hard number on the harsh truth about your customer retention status. This was one of the failures of the dot.com boom in the late 1990s. Companies spent a shed load of money on customer acquisition (which made many an agency happy bunnies) but did not measure customer churn. They were managing a “leaky bucket” with customers, at great expense, entering at the top end but falling out at the bottom end.
The customer churn rate is the percentage of customers that stop using a company’s product or service during a defined time frame.
It can simply be calculated by dividing the number of customers lost during the defined time period by the customer universe that was in place at the beginning of the time period.
For example:
Customer count at the beginning of the time period |
= |
5,000 |
Customer count at the end of the time period |
= |
5,250 |
New customers acquired in the time period |
= |
500 |
Customers lost in the time period |
= |
250 |
Churn rate |
= |
5%* |
*5000−4750 = 250/5000 × 100 = 5%
Alternatively, revenue churn can be calculated over a defined time (say one year) period by:
• Annual running rate of value of business at the beginning of the year
• Annual running rate of value of business at the end of the year
• Number of new customers and revenue contribution
• Value of recurring business lost
• Percentage of recurring value lost
Revenue churn reveals how much recurring revenue was lost in a given period of time. This is particularly important for a subscription business.
The churn rate and its management underpins a company’s profitability on the proven premise that it costs more to acquire new customers than it does to retain the existing customers. There are many ratios quoted but, as a rule of thumb, a 5 percent increase in retention rate can increase profit by 25 percent because returning customers have a greater propensity to spend more on a company’s products and services. This, in turn, gives the option for a company to spend less on acquiring new customers and saving related marketing cost.
Some observations:
• Identify those in your customer base who are most likely to lapse and why.
• Put in place a lapsing program targeting customers who are about to lapse. Once customers lapse, it is very costly to re-engage them if nigh on impossible.
• Be proactive in connecting with the segment who show lapsing characteristics. Communicate with them on all the benefits (emotional and functional) you offer and show them you care about their experience.
• Seriously evaluate the commercial benefits of pooling your resources into your loyal, profitable customers rather than prioritizing on offering more and more incentives to the customers who are considering churning.
Customer Acquisition Cost (CAC)
Customer acquisition cost is the amount of money spent on an individual recruitment campaign or across sales and marketing to close a transaction deal to recruit a new customer over a defined time period; for example, a company’s trading year.
It is calculated by summing all the individual campaign costs, including any incentives offered, and dividing it by the number of new customers. Alternatively, summing a company’s total sales and marketing spend against new customer acquisition and dividing it by the number of new customers recruited.
Amount spent on sales and marketing on new customer recruitment in 2019 fiscal |
= |
£X |
Number of new customers acquired in 2019 fiscal |
= |
Y |
New customer acquisition cost |
= |
£Z |
Net Promoter Score (NPS)
NPS is a metric that can be used in measuring customer responses to any attribute where a quantified scale is used by grouping responses into three categories. Based on, for example, a 10 point scale:
Promoters |
= |
those scoring 9 or 10 |
Passive |
= |
those scoring 7 or 8 |
Detractors |
= |
those scoring 0 to 6 |
The NPS score is derived by subtracting the percentage of “Detractors” from the percentage of “Promoters.” This is simply illustrated below:
SCORING SEGMENT |
COUNT |
% |
PROMOTER (9 or 10) |
A |
B |
PASSIVE (7 or 8) |
C |
D |
DETRACTOR (0–6) |
E |
F |
TOTAL RESPONSES |
G |
100 |
NPS SCORE = % PROMOTER − % DETRACTOR |
||
Anything above zero is good while anything below zero suggests action is required to address the issue being investigated.
The raw data is normally obtained by sending out a survey to the existing customers asking them, for example, how likely they would be to recommend your product or service to a friend, relative, or colleague? In this context, a negative score will suggest you need to improve the customer experience with the survey indicating the areas you need to focus on for such improvements.
This methodology can also be used to gauge a “CUSTOMER SATISFACTION SCORE (CSA)” where the question in the survey is crafted to specifically address this.
Formula to Predict Response Rate Required to Break Even
Marketing costs are high and, as such, a scientific approach should be employed to build a response model to determine the response required to breakeven for a marketing activity in which a measurable transaction value is the object of the activity. The actual result can then be evaluated against the target required.
A very simplified model is outlined below based on a theoretical online consumer product as an example to illustrate the type of approach.
Formula
The breakeven point is where the communication cost equates to the gross contribution.
That is, cost of communications (comms) = gross contribution = net revenue × % profit margin.
Or net revenue = cost of comms/% profit margin
Net revenue = average order value (AOV) × number of orders (responses)
Therefore, for a predicted AOV, it is possible to derive the response required to breakeven.
Response rate required = Net revenue/AOV
For example, a model based on the following parameters:
- |
Contact universe |
= |
1,000 |
- |
Communication cost |
= |
£2 per contact |
- |
AOV |
= |
£50 |
- |
% profit margin |
= |
45% |
1. Cost of comms (1,000 × £2 per contact) = £2,000
2. Net revenue = Cost of comms/% profit margin = £2,000/0.45 = £4,444
3. Net revenue = AOV × number of orders
Number of orders = Net revenue/AOV
= £4,444/£50 = 88.9 = 8.9% based on contact universe of 1,000
Response rate required = 8.9%
Application of Formula
Table 11.3 shows how the formula is applied to the 3 levels of AOV and 3 levels of communication cost per contact; all based on a contact universe of 1,000:
Table 11.3 Application of formula to show response rate required to breakeven
COMMUNICATION COST |
BREAK-EVEN REVENUE |
AOV: RESPONSE RATE REQUIRED |
|||
Per Contact |
Total |
£25 |
£50 |
£75 |
|
£1.00 |
£1,000 |
£2,222 |
8.9% |
4.4% |
3% |
£2.00 |
£2,000 |
£4,444 |
17.8% |
8.9% |
5.9% |
£3.00 |
£3,000 |
£6,666 |
26.7% |
13.3% |
8.9% |
Some Key Thoughts to Reflect on if You Are Considering/Reviewing CRM
One of the major strengths of CRM is its focus on the commercial performance using quantified analysis to measure key metrics. This chapter features some formulae commonly used within the CRM fraternity; many of which are founded in Direct Marketing.
Readers should consider and incorporate them into their own analysis toolkit.