The Pursuit of Analytics Maturity
Today companies are racing to build analytics departments. The demand for qualified people is so strong that 46 percent of chief information officers (CIOs) reported skills shortages despite offering high salaries.1 Why does everybody think that analytics is the new money-making secret? Why should this even surprise us? Isn’t it the case that analytics has always played a key role in business?
Arithmetic and accounting were invented to make business better. In 1494, an Italian polymath Luca Pacioli published a book Summa de arithmetica, geometria, proportioni et proportionalita (Summary of arithmetic, geometry, proportions and proportionality). The mathematics in it was not groundbreaking, but it contained a section on double-entry bookkeeping. Luca Pacioli was a pragmatic genius for whom the math was a means to an end. Hence, he discussed arithmetic, algebra, and geometry as means to arrive at a complete view of the business through the method of double-entry accounting.
It remains a mystery what sparked the idea of this counterintuitive record keeping method that many business students today have a hard time understanding and learning. This invention has transformed business management and has inspired the development of numerous software technologies. Even poets admired the logical structure and the power of double-entry accounting:
Whilst I could not think of any man whose spirit was, or needed to be, more enlarged than the spirit of a genuine merchant. What a thing it is to see the order which prevails throughout his business! By means of this he can at any time survey the general whole, without needing to perplex himself in the details. What advantages does he derive from the system of book-keeping by double entry? It is among the finest inventions of the human mind; every prudent master of a house should introduce it into his economy. (Johann Wolfgang von Goethe)2
For Goethe the brilliance of double-entry accounting was in its ability to show the whole picture without cluttering it with unnecessary details. A businessperson could instantly assess the health of the business, the breakdown of sales, costs, margins, and profits, without having to look at the individual transactions. In contrast, a single-entry accounting system contains nothing else but transaction details recorded in a long ledger.
In reality, business history shows an insatiable appetite for more data and deeper interest in the details. Activity-Based Costing, known also as the ABC of business, breaks down tasks and activities to the most minute details to get a more fine-grained picture of production and service costs. Furthermore, businesses were not just interested in the historical facts contained in the accounting systems. They also wanted to leverage the collected data to predict and forecast events, outcomes, and revenues. Scientifically minded managers observed patterns and relationships in the historical data and formulated theories on how to use this knowledge to improve future outcomes.
One such manager invented a method for predicting beer quality based on the amount of soft resins in the hops. He saw it as very beneficial not just for the beer industry but in general for every manufacturer. Despite the company’s policy prohibiting employee publications, he submitted it to a journal as a semi-scholarly article under the pseudonym of Student. The article lacked a mathematical proof for the method and, thus, was largely ignored by the scientific community until a prominent statistician Ronald Aylmer Fisher3 provided the mathematical proof. The T-test, as it is known today, was empirically derived by the self-taught statistician William Sealy Gosset while working for the Guinness brewery and has been extensively used in many industries.
The desire for more data and deeper insights is natural because data makes decisions fact based instead of gut based. There is an ongoing debate in science and business about the benefits of gut feeling versus analysis for decision making. Gut decisions are prone to errors, whereas analysis leads to paralysis. Neither argument is conclusive, but what is known is that we lean on the gut when we lack information. Hence, more information eliminates the doubts of the gut. And yet, information is often intentionally or unintentionally ignored. Sometimes businesspeople are overoptimistic or overconfident and ignore the facts. Bright sidedness,4 the winner effect,5 and different cognitive biases shut down our reasoning even in the presence of information. We also ignore the facts when they overwhelm us.
In 2005, we presented oncologists with big data patient profiles and asked them to determine the disease stage. A big data patient profile is essentially a general ledger of every health care transaction payed by an insurance company. Every test, every procedure, every hospital, or physician visit is recorded in the ledger. The transactional profile of each patient can be 300 pages or more of raw data. This information is quite different from the 500 words summary profiles that doctors typically see. Most oncologists made mistakes when interpreting the transactional profiles. When reviewing the errors, they acknowledged that the information was too much. They zeroed in a few data points but missed the significance of others. Ian Ayres, professor of law at Yale University and author of the book “Super Crunchers,” explains this limitation of the human brain:
We tend to defer to experiential experts when some process is really complicated. But when there are more than say 5 causal factors, human experts tend to do a very bad job at correctly assigning the correct weights to what causes what.6
To Goethe’s credit, we need to save the brain from being overwhelmed by too much detail. Hence, the desire for systems and technologies that analytically augment the human brain and supply it with a picture that allows the brain to focus only on the relevant information like the double-entry accounting method does. Intelligent analytics systems filter out the noise of irrelevant details instead of arbitrarily ignoring them as people do when overwhelmed by information.
Opportunity Monetization Matrix
for Data and Analytics
There is a linear relationship between the depth of data that companies collect and the sophistication of the analytics methods that they need to process this data for monetization. The data depth is determined by dimensionality and granularity of the data. Dimensionality reflects the number of descriptive attributes that characterize each business transaction, event, product, part, and so on, that is captured and stored as raw data. For example, a real estate property can have many attributes such as ownership, zoning, land use, condition, number and type of rooms, financing, taxes, and much more. In fact, such attributes are frequently sold as data products that enrich other data to improve its access and analyze. Wand, Inc. (wandinc.com) sell product enrichment data that ensures that e-commerce sites deliver optimal user experience through complex attribute-based filtering and search. ESRI (esri.com), the mapping company, sells more than 15,000 demographic, psychographic, and socioeconomic variables, each having hundreds of attributes, to improve the analysis of geospatial information. Having these attributes allows an analyst to extract deeper insights for every slice of the world’s map. The more facets we can look through, the more informed decisions we can make.
Granularity determines the time intervals at which data is being analyzed. Yearly, quarterly, monthly, and daily reports are used to track performance and goal achievement. Companies used to be run on monthly and quarterly reports, but today’s Twitter and instant messenger culture make even the daily reports old news. Breaking news spreads instantly both in politics and within organizations. Good and bad news break in the digital grapevine before the reports can even be generated. Rumors about bad quarterly results or new competitor actions break out before any formal announcement. Not only our expectations about the timing of information have changed, but the pace of business has changed too. Windows of opportunities have shortened. Flash sales sites like Gilt.com have turned fashion retail into happenstance and consequently hooked people to their instant messages. As a result, traditional managerial decision making is moving closer and closer to real time, whereas decision automation can only be done in real time.
The increasing data dimensionality and granularity created big data. Even though it is humans who wanted and created big data, it is humanly impossible to analyze it with a pencil, paper, calculator, and spreadsheet. It is humanly impossible to comprehend the many dimensions, as Ian Ayres points out, and humanly impossible to see data collected at 20 or 40 MHz sampling rate, which is 20,000 or 40,000 data points per second. In the era of big dimensional and granular data, human intuitions and analytical skills must be augmented with the right tools and methods to enable the utilization of this new resource.
The monetization opportunity matrix in Figure 11.1 shows how the accumulation of data transformed it in what Clive Humby, the British mathematician who established Tesco’s Clubcard loyalty program, calls “the new crude oil.”7 Clive’s analogy is quite relevant as both crude oil and raw big data have practically no value until processed, and that is what sophisticated analytics does to data.
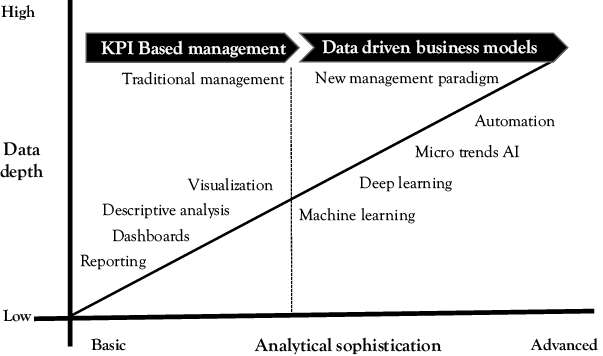
Figure 11.1 Data growth drives analytical sophistication and monetization: Data depth vs analytics breadth
Today’s most hyped analytics technologies—machine learning and neural networks—are not new. Linear regression was invented in 1870 and neural networks in 1943. What is driving their adoption on a massive scale is the digitization process that turns everything from letters, to voice, to video and images into raw data that feeds these algorithms. While traditional business analysis focused on measurement, reporting, and visualization of performance metrics such as sales, shipments, and so on, the new approaches process raw data into digital “finished goods.” Classification algorithms turn raw images and streaming video into well-organized digital catalogues that can be repurposed or sold in many ways. Algorithms that predict events such as machine failures deliver equipment “inspections” without mechanical inspection and human intervention. Decision automation and artificial intelligence (AI) runs cars, warehouses, and much more. The analytical algorithms perform tasks that allow companies to make money. Bitcoin mining does that literally as the miners get rewarded with Bitcoins for cracking algorithms to unlock more coins into the system. The digital gold rush has as strong of a pull as the California gold rush. It is estimated that 300,000 gold seekers immigrated to California in the 1850s. Today, Slush Pool (slushpool.com) lists 260,000 active digital miners, whereas other sites estimate this number to be over 1,000,0008 proving that the alchemy of data and analytics can produce real money out of abstract ideas.
Traditional reporting does not perform tasks nor can turn abstract ideas into money. Reporting, descriptive analysis, and visualizations are used to manage the business. Are the business objectives and goals being met and if not, why? Thus, reporting, like accountings, is a cost center. But big data and advanced analytics are sources for monetization. Humanly curated image libraries tend to be small as their creation is labor intensive and expensive. Machine curation allows for expanding the libraries and delivering real-time packaged content for a fee. Stock trading predictions are signals that can be packaged as data products and sold to institutional or individual investors as AlgorithmicTrading.net does. Hence, companies are aggressively maturing their analytics to use the data not just to manage the business but also to generate revenues. The more task oriented the analytics are, the higher the monetization opportunity. Highly dimensional data with low granularity coupled with sophisticated analytics transformed the purpose, the utilization, and monetization of data.
Why Companies Develop Decision-Styles
Cultures and Systems
Different analytic methods evolve because new data types emerge. Different analytics systems and platforms are built to support new decision-making styles. The intuitive versus the logical/rational decision styles feature prominently in all personality tests. But why do companies create cultures and build systems to support different decision styles? The simple answer is that better decisions lead to better business results. While this is true, it is not the complete answer.
Companies need to standardize the decision-making process to ensure consistency and reduce risk. Imagine what it takes to manage a few hundred loan originators for second-hand car dealerships? Some loan originators are intuitive, and others are rational decision makers. How do you ensure that they assess risks correctly and price the loans based on the risk that the dealer may default on the loan? This was the biggest challenge of the CIO of a financial services company that provided commercial loans to second-hand car dealerships.
When I met her in 2010, the story intrigued me instantly. The market for second-hand cars had become famous in game theory because of a paper that won a Nobel Prize. “The Market for Lemons,”9 as the title of the paper is, describes a situation of information asymmetry. One side
of the transaction, the seller, has complete information about the quality of the car. But the dealer can also withhold some of this information from the buyer. Hence, the asymmetry—one party of the transaction knows more than the other and can use this to get a better deal for himself. The sly second-hand car dealer knows that sooner or later the buyer will find the truth and will feel like he has chewed on a lemon. Searching Google for images of “second-hand car salesmen” returns a massive number of images created intentionally to portray them as cunning, manipulative, and eager to profit from human misery.
As the CIO explained to me, this perception of the second-hand car salesman is mostly wrong. Second-hand car dealerships are small businesses working hard to compete with the large new car dealerships that also sell pre-owned certified vehicles. The owners/managers do not have business training and frequently overestimate the market and the risks when they finance their inventory. Thus, many of them default on their loans.
Sometimes, a friend had asked them to find them a luxury car on a deal, to purchase the car at an auction, make extra profit, and decide that this may be a good market segment. As they upscale the cars on the lot, the more expensive cars take longer to sell, and their cash flow suffers. Other times, they decide to improve the lot and invest in pavement, fences, and other amenities, but the volume of sales does not support the decorative expenditures. As she explained to me, the dealers genuinely believe and intend to do well when making these changes. And so are also the loan originators who develop friendly relationships with the dealership owners and want to help them to do well. The path to bankruptcy is paved by good intentions as compassion and optimism lead to underestimation of the true financial risks.
But who wants to acknowledge that their intuitions and good intentions lead to bad decisions? The company had ongoing open discussions whether financing fenced lots and other amenities leads to better sales or not without ever reaching a conclusion while writing off 20 to 30 percent of the loans. According to the CIO the only way to resolve the debates and solve the problem was by establishing a decision style and a culture of fact-based decision making. Implementing a new decision support system with a predictive risk score based on the sales history and the cumulative risk based on the total unpaid loans was not trivial to implement. Unlike the big car dealerships that have a single credit line, second-hand car dealership financing is more like microloans financing because each car purchase loan is a separate origination. Even more difficult was to mandate the use of the risk score by the loan originators as culture cannot be forced upon employees with an order. Since a risk score is just a guiding benchmark, the loan originators can either ignore or take it seriously, and the disbelievers tend to ignore it. The good thing about historical data is that at some point the accumulated facts are impossible to ignore. Within a year, everyone saw that the brutal reality and the unintended consequences of financing improvements that made the lots prettier but often pushed dealers into cash flow problems and bankruptcy.
The Enterprise Analytics Stack for the
Digital Economy
With the abundance of data and analytics, the analytics maturity curve is continuously incorporating a broader range of decision styles, as the graph in Figure 11.2 shows.
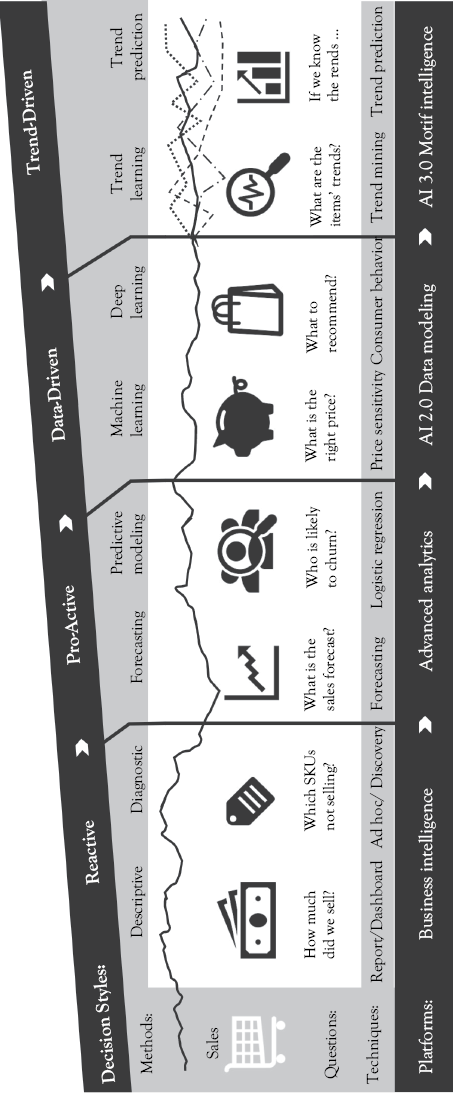
Figure 11.2 Enterprise analytics stack for the digital economy: Retail example
There are four main styles of decision making in organizations. These decision styles are not mutually exclusive. They are complimentary and each style serves a different purpose and is supported by different technologies. Therefore, organizations are building stacks of analytical technologies and capabilities.
The first decision-making style has existed for centuries and is at the core of all accounting and reporting information. The reactive decision-making style looks at historical data to assess past performance. This analysis reveals either achievement or divergence from the set goals, and root cause analysis provides explanations about why things work or don’t work. The reactive style informs decisions about corrective actions. The decisions about what to do are made by experts to the best of their knowledge and based on their personal experience how to align performance with goals and expectations. The reactive decision style is often compared to looking at the rearview mirror. But this comparison is false. History is necessary, and forward looking and predictive systems need even a more fine-grained history to learn from in order to make predictions. The rearview benchmarks measure the business health over time in a consistent way. Hence, nearly 100 percent of business organizations globally have deployed Business Intelligence platforms and nearly 25 percent of the workforce uses these technologies to measure performance.
The proactive decision style aims to enable action before events occur. Sales forecasts are typically done in order to measure whether progress is being made to meet the forecast. Forecasts are generated using statistical methods that extrapolate future projections from past performance data. Thus, managers do not have to wait for the end of the quarter report to see the budgeted versus actual sales. They can make decisions based on deviations from the forecast. Predictions are also used to manage customer churn. By predicting the likely attrition of some customers, managers can design and provide incentives to retain them as it is cheaper to retain existing customers than to acquire new ones.
Today, all machine learning, deep learning, and AI involves prediction. When an algorithm decides which category an image or a text belongs to, or when it classifies a medical condition of a patient, or when it autocompletes a sentence in an e-mail, it actually makes a prediction. These sophisticated task-oriented AI algorithms both fascinate and scare us because for centuries we have thought of tasks as uniquely human activities. We are so possessive of our tasks that whenever someone interferes with the work of another human being, they feel like this person is stepping on their toes.
The data-driven decision style leverages the machine learning and deep learning technologies to do tasks, such as classifying information, or deliver processed information, such as a recommended diagnosis, to decision makers. The advantage of these systems is that they can sift through a lot more data than we can and deliver insights and knowledge very fast, accurately, and on schedule. Image and video interpretation systems that can identify “what, where, and who” can tell stories. On construction sites such systems are used to increase the safety of the workers by “watching” and telling the stories to management. Such safety stories were previously anecdotal and incomplete—whatever the foreman saw and remembered. Data driven makes the stories factual and reliable, but as a decision-making style it is possible only through technology augmentation.
And just when we thought that machine learning and deep learning are the solution to all analytics and AI problems, DARPA, the Defense Advanced Research Projects Agency of the United States Department of Defense that is responsible for the development of emerging technologies, made a startling announcement that it will invest over $2 billion in new research projects on a next-generation AI, or as they called it AI 3.0:
Past DARPA AI investments facilitated the advancement of “first wave” (rule based) and “second wave” (statistical learning based) AI technologies. DARPA-funded R&D enabled some of the first successes in AI, such as expert systems and search, and more recently has advanced machine learning algorithms and hardware. DARPA is now interested in researching and developing “third wave” AI theory and applications that address the limitations of first and second wave technologies.10
With this announcement, it seems that the we are just starting to explore the real possibilities.
While the data-driven approach allows us to act on deeper insights or previously unavailable knowledge, the trend-driven decision-making style allows businesses to react to the ever-changing trends and patterns in business operations. The trends-based approach pushes the analytical boundaries in two important aspects. First, most statistical approaches assume that time in these models is stationary, that is, the models assume that events will repeat themselves in a similar fashion over time. But as one data scientist who runs a business pointed out to me: “Time is not stationary. We pay managers to change things over time.” Second, the trend-driven approach disaggregates the analytics. All analysis from accounting to statistics summarizes the data or extrapolates the representative patterns. The trend-driven approach identifying microtrends at the unit level—the individual machine, patient, Stock Keeping Unit sales, and much more. This is a positive “micromanagement” as it creates new opportunities to manage outcomes, save costs, and optimize revenues, which we will discuss in the next chapter.
1 Woodie. A. 2019. “What’s Driving Data Science Hiring in 2019.” Datanami. https://datanami.com/2019/01/30/whats-driving-data-science-hiring-in-2019/ (accessed November 12, 2019).
2 von Goethe, J.W. 2019. “Goethe’s Works, Vol. 5: Wilhelm Meister’s Travels,
A Romance; Elective Affinities” (Classic Reprint) Paperback.
3 Holmes, C. 2019. “The Genius at Guinness and his Statistical Legacy.” The Conversation. http://theconversation.com/the-genius-at-guinness-and-his-statistical-legacy-93134 (accessed November 12, 2019).
4 Ehrenreich, B. 2009. Bright-sided: How the Relentless Promotion of Positive Thinking Has Undermined America. New York, NY: Henry Holt Books.
5 Robertson, I.H. 2012. The Winner Effect: The Neuroscience of Success and Failure. New York, NY: Thomas Dunne Books.
6 “Super Crunching” Interview with Ian Ayers, September 11, 2007, Financial Times https://ft.com/content/e5527304-5af9-11dc-8c32-0000779fd2ac (accessed December 14, 2019).
7 Fagden, J. 2019. “Yes, Data Is the New Oil.” Data and Analytics Blog, http://bulletinhealthcare.com (accessed November 23, 2019).
8 “How Many Bitcoin Miners Are There? Slushpool has about 200,000 miners. They have 12% of the network hash rate. Assuming all pools have similar numbers, there are likely to be over 1,000,000 unique individuals mining bitcoins.” https://buybitcoinworldwide.com/how-many-bitcoins-are-there/ (accessed November 23, 2019).
9 Arkerlof, G. 1970. “The Market for Lemons: Quality Uncertainty and the Market Mechanism.” Quarterly Journal of Economics. The MIT Press 84, no. 3, 488–500. https://doi.org/10.2307/1879431 (accessed November 12, 2019).
10 Grant Number: DARPA-PA-18-02 Program Announcement (PA) Artificial Intelligence Exploration (AIE).