

What is it?
A technique that brings us to the heart of a problem quickly and directly.
How is it done?
It consists of establishing a problem or question without a clear history and passing it through the filter of the Five Whys. We will repeat these questions in order to make the originating cause obvious, and this will make it easier to understand.
Q1. Why are we behind in the execution of the product?
A1. Because we had to make more changes than we expected.
Q2. Why did we have to make more changes than we expected?
A2. Because the customer was not clear about the specifications of the product.
Q3. Why wasn’t he clear about the specifications of the product?
A3. Because the interview covering the project launch start was not carried out very well.
Q4. What was wrong with how the project launch interview was carried out?
A4. We didn’t have a clear action protocol.
Q5. Why didn’t we have a clear action protocol?
A5. Because until then it hadn’t been necessary, so we were able to act intuitively.
Conclusion: the fundamental problem is not to improve the management of projects to ensure the time limits associated with their management, but to tackle the development of a project initiation protocol whereby we can be sure we have correctly collected the specifications.
When is it done?
When we want to find out more detail about the factors governing the nature of a problem scenario. It is used in the early stages of the design phase to detect the major causes which are not evident with a view to seeking to understand the background of the problems.
As part of the Thinkers Co. day-to-day routine, the Five Whys are the first analysis we undertake when handed a project or facing an initial challenge with the aim of seeking out various concealed perspectives or rules.

|
MAPPING/COMPANY 5 WHYS |

What is it?
The Business Model Canvas (BMC) is a diagram of currents that flow between the customer and the company and that describe how an organization generates and delivers value. The canvas is divided into nine boxes that visually define a strategic analysis of the start situation making it possible to understand the current operations to begin to see which areas we could or should try to establish as a starting hypothesis.
How is it done?
As a general rule, each business line (whether determined by product, value proposition or customer segment) is provided with a business model canvas or BMC, although there will be occasions when they can be collected on a single canvas.
Before beginning the work of building a canvas, it’s a good idea to perform this exercise: answer four key questions:
1. For whom am I working?
2. What am I offering him, or doing for him, and how do I ensure that he gets it, while at the same time define the relationship we have established?
3. How do I build the proposition and what do I use, or what is available, for building it?
4. Bearing in mind the preceding point, where do costs and income flows come from?
Having answered the foregoing questions, let’s start by defining the value proposition and the customer segment to which it’s addressed, and let’s sketch out our model in relation to it, along with the channels we are using to communicate the value proposition to the user or customer. When the right-hand area of the canvas is filled out with the emotional section, we then deal with the left-hand area:
Key actions, in other words, everything we shall unavoidably do to generate the value proposition and ensure its arrival.
Key resources: all material items (offices, stores, etc.) and all intellectual or productive resources needed to create the value proposition.
Partners: relationships with third parties to develop our value proposition.
• Finally, everything set down in the above boxes will have an economic effect on our outcome, defined in costs and income flows.
• When is it done?
• When we want to visualise in diagram form the way our operation works in an understandable way and clearly grasp the areas we can analyse and discuss.
The use of the BMC at the mapping stage is determined by the fact that the project is obliged to deal with the resolution of a challenge that extends further than a concrete operational area. This gives rise to the need to understand its possible impact on the company with some degree of perspective.
|
MAPPING/COMPANY BUSINESS MODEL CANVAS |

What is it?
It's a methodology that analyses the strategic situation of a company or project to see its strengths and weaknesses (internal characteristics) and opportunities and threats (external situation). It does all of this on a square matrix.
How is it done?
The preparation for creating the matrix consists of two steps:
• External analysis: look outside the box. We must be very clear about the external agents, who the possible competitors are, and understand our situation in light of that knowledge.
• Internal analysis: we have to make a very honest analysis of ourselves and identify our weaknesses and strengths.
We can then construct the SWOT matrix (Strengths, Weaknesses, Opportunities, Threats), where the S and W represent actual tangible facts, and the T and the O represent factors that might affect us in the short or medium term.
|
Weaknesses • Mature process, low technological development capability • High fixed costs per unit |
Strengths • Tradition/know-how • Quality or materials • Creativity • Space |
|
Threats • Increasing low-cost culture in the purchase of household goods • Globalisation |
Opportunities • The DIY (Do-it-yourself) culture • The introduction of the digital era • The maneuverability of being a very small business • Globalisation |
Start-off SWOT on the Domanises/Dovase project.
When is it done?
It's done during the initial stage, when efforts are made to discover the actual situation of an organization, company or project and a future strategy must be planned. Along with the Five Whys, this is a basic tool as part of the Thinkers Co. day-to-day operations when a project is being launched that helps us determine a starting situation – like the value levers we are provided with and which we must find out more about.
|
MAPPING/COMPANY SWOT |

What is it?
It's a method used to visualise the key factors that relate to the state and health of the industry at the present time. The Porter Five Forces Analysis is a strategic model that was developed by engineer and lecturer Michael Porter of the Harvard Business School in 1979.
How is it done?
A diagram is used to assess the impact of the industry’s five key forces:
1. Competitors: main players in existing markets. We define and outline the operators already present in the sector.
2. Potential participants: those who can be seen on the horizon, about to enter. Definition of possible operators who may begin to compete in our market segment or sector.
3. Customers/purchasers: who is there, what are the market segments, what state are they in, how are they developing? Identify the current mass and its main characteristics and investigate how they are developing.
4. Replacement offers: products or services that may replace us. Clarify the limits of each offer on the market which, even if not a competitor, may provide a response for our customer segment in another, yet still valid (for that segment) format.
5. Suppliers: identify the key agents who support us and their importance in the value chain of our company with a view to understanding the power we wield as an organization in a negotiation (the more suppliers you have, the greater your negotiating muscle).
When is it done?
This is a useful visualisation tool when we want to see our position in the market, plus possible areas for future action; new organizational roles, opportunities and threats. Used in the initial stages or following an opening investigation as a summary of findings and in order to understand the information. The need to carry out an industry diagnosis is shown by the value of understanding the various agents with a part to play in our day-to-day routine which are not immediately obvious, and also to help us see where we could be successful in gaining a foothold.
|
MAPPING/COMPANY INDUSTRY DIAGNOSIS |

What is it?
The aim is to understand our current and future reality via a metaphorical comparison with third-party entities that are similar to ourselves (same sector) or to the way we are, even with differences (other sectors).
How is it done?
• Analogue: identify those individuals, products or companies that we believe are similar to us, or that we would like to think are similar to us, or those to which we are similar, or to which we would like to be similar.
• Non-analogue: identify those individuals, products or companies that we neither believe are nor wish to be like us, and that we neither wish nor believe ourselves to be similar to.
There is no structured model. This is a random identification in the search for entities that could help us to understand or visualise our own identity by producing nuances or mechanisms with which to compare ourselves.
When is it done?
This is done when we want to understand who we are by comparing ourselves with others or when we wish to draw a line showing how far we would like to go by using mirrors in which we are or are not reflected.
For example, when we worked in the experience and design section of one of Orange’s clients, in the stages prior to the investigation, we focused our attention on businesses in another sector. The aim was to make some comparisons to work out who we wanted to resemble, and who we didn’t. In our quest for relationship and customer segment models we arrived at the following conclusion: I want to be the Nike of telephony (a vivid and fresh relationship, aligning the user’s values with those of the company, an active user prescribing our wins, a high level of user-with-company identification).
On another occasion, during an initial visualisation of the strategic determination of the concept of ByDsea (startup) we saw that there were two ways to maximise the use of boats in the nautical sector: Airbnb for vessels, focusing on the object, or sea LinkedIn focusing ourselves on the connection between people, since this was the start of a hybridisation process by transfer.
|
MAPPING/COMPANY ANALOGUE – NON-ANALOGUE |

What is it?
It is a technique that uses a system of diagrams to analyse the Entities, Relationships, Attributes and Flows present in a system. The aim is to analyse all the elements that make up a system and the interactions between them from an external, or zoom out perspective.
How is it done?
By following the steps listed below:
1. Identify the entities of the system: define the parts present in the system.
2. Define the relationships and flows between them: describing how the entities connect to each other and their directions.
3. Define attributes: establish the value of the characteristics of the entities or the relationships.
4. Analyse the system: understand and generate insights with respect to it. Identify strong points and the weaker aspects or connections.
At a later idea formation stage, it can be used to redesign complex systems.
When is it done?
It's done during the exploration or observation process, it helps us to understand the way the system operates. We could say that it facilitates the task of revealing the implicit value chain, plus the importance of the relationships between the agents in existence within it.
For example, having established the interest groups – the Stakeholders Map – in the launch of the design of the Open Innovation Communities in the dairy industry sector, the ERAF diagram helped in the initial stage to determine the operating hypotheses between the various agents. We drew the entities from the Stakeholders Map and what we defined were the relationships and flows between them, determining the attributes in due course on the basis of their role in the community (mapping FEUGA – Fundación Empresa-Universidad Gallega – the Galician University Company Foundation).
|
MAPPING/COMPANY ERAF SYSTEM DIAGRAMS |

What is it?
It's a tool for visualisation that we use in group sessions to understand and consensually agree to the limits of a project.
How is it done?
There are a variety of ways for performing the In/Out exercise. As a general rule we draw a circle in the central area of a blank sheet which takes up 50 per cent of the area. This circle contains the ‘In’ where we define and place everything that remains inside the project. The area of the sheet outside the circle determines the area where items that remain outside the project (Out) are located.
The team take up their positions around the paper; each team member has a felt-tip pen. They either write directly or by means of Post-its (more advisable so as to be able to state an opinion, move it or tear it up). Every time a team member makes a note, a brief conversation takes place to validate, qualify or relocate it.
At the end of the exercise we are in possession of a consensually-agreed visual map where a single glance shows what the project is or what it deals with (In) and what it doesn't, or what is outside of the project (Out).
When is it done?
This technique is employed when we want to generate an alignment dynamic between the goals and the mental perception within the team by means of a swift and simple visualisation of the limits and nature of the project. We could probably say that it is a To Do tool for each new project we undertake at Thinkers Co., with which we define some clear limits of goals on which to build the project in question. These are limits set by the team (internally and on occasion with a client), with which all participants are in agreement and to which they can return when suspicions arise that they are beginning to drift.
|
MAPPING/COMPANY IN/OUT |
What is it?
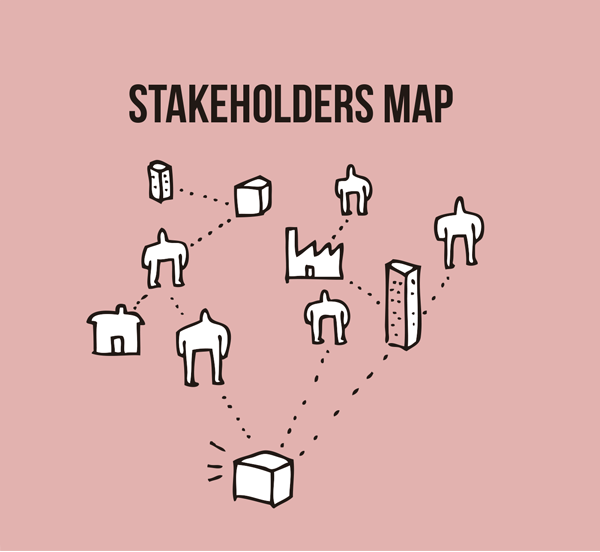
It is an initial sketch of the situation as it applies to the whole of the environment with direct or indirect contact with (but which may also have an influence on) our company/customer/product (the epicentre of the map).
It may be seen as a zoom away from all the players affecting our main objective.
How is it done?
Basically, it is the creation of a mental map where we shall initially locate all the actors, companies or organizations that are in contact with our company/user/product. We shall try to establish the proximity to, and contact with, the main entity, and locate the players according to a homogenous criterion (based on interaction, proximity, determination in decision-making, etc.), that will allow us to define and visualise levels of relationship with regard to the basic entity (the main agent in the study/project). The aim is to attain a more in-depth understanding of the totality of the environment with a view to determining the starting point for research and provides room for all the nearby agents or entities, as well as defining a context in the design of patterns or new opportunities.
When is it done?
It's done when the project originates as part of an analysis to determine how we believe our action environment is, or after having maintained initial contact with the users, subject experts and any player or factor in which we are interested.
With this tool we can quickly and overarchingly visualise the complexities that affect us by representing the various players involved.
Understanding the various agents involved is one of the first tasks to be faced at Repsol, an integrated global energy company based in Spain, in the light of the complexity of their innovation projects. This method makes it possible to define an initial visual image that prevents any entity factored in from the beginning of the project from being left out.
|
MAPPING/CLIENT-MARKET STAKEHOLDERS MAP |

What is it?
It's a representation of a situation which takes place in real life that's performed by 2 or more people.
How is it done?
Instead of mentally assessing situations, we position ourselves in a specific context and allocate roles to participants to dramatically simulate and re-experience a situation.
The same scene can be repeated a number of times by changing the characters’ profiles in order to understand how different users might act in the same situation.
For a good Role Play we should follow the steps below:
1. Prepare and define the role: We should decide who the actors are and the context in which they will perform; in other words we must decide on the nature of the characters and the scene in which the action takes place.
2. Dramatization: Here we act (interpreting the character we have defined) according to the situation or context as defined by recreating it. At this point we can support ourselves with objects and spaces to boost the receiver’s own imagination, which will give us still more help to understand our user/situation/context.
When is it done?
It is used when there is a need for a group to have a thorough understanding of a behaviour pattern or a situation and it should take place in the location where the situation actually takes place in order to reinforce the process of empathising.
Role Play was very useful, for example, in the case of the Spanish savings bank Ibercaja Innovation and Excellence Unit for people who were not in direct contact with the customers to be able to develop the design of purchasing procedures, services and products with greater empathy. In order to achieve it, their colleagues from the office network who were in direct daily contact with the clients, simulated the typical reactions of the customers to the possible designs at the start of the projects. This practice sometimes also helps us to achieve a more detailed reformulation of the start point or the initial goal.
|
MAPPING/CLIENT-MARKET ROLE PLAY |

What is it?
It's the creation of an archetype of our target public with a view to creating a more personal and in-depth visualisation of the person we are talking about by analysing his motivations, the context in which he lives, his job, his concerns and preferences. In this way we mould a fictitious persona who will help us to characterise and better understand our user.
How is it done?
We can generate this avatar by means of our own experiences. Our avatar must match a reality from our own knowledge; it isn’t a matter of generating a persona with random accoutrements. The descriptions must correspond to a real, – or at least a plausible, person. Generating this persona on the basis of empathy is an essential requisite.
To build this tool we generate four quadrants where we place the following information:
1. Personalisation – Quadrant 1: demographic characteristics. Who is the persona? His real details; his age, his partner, his family, his profession, etc.
2. Locating and contextualising – Quadrant 2: scene where the action takes place. Define the space and the set of circumstances to be considered in the environment of this individual in the location where we want to visualise it. Where do we want to study him? Place, times, actions, etc.
3. Understanding and defining – Quadrant 3: needs/motivations/ beliefs. Intersections arise from the persona and the space that give rise to the user’s conditioners and qualifiers, the things which guide him, direct him or motivate him.
4. Analysing – Quadrant 4: objectives/goals. Based on his conditioners, what is our user's final aim?
When is it done?
This is a starting point for channelling all our knowledge, along with the subsequent teamwork based on defining some initial hypotheses. When the project is launched it is vital to be absolutely certain for whom the new product or service is directed. At the French multinational telecommunications corporation Orange Department of Design and Experience these people are imagined as a starting point, since it is on the basis of these personas that we will define the experience and construct the process of investigation.
|
MAPPING/CLIENT-MARKET PERSONA |

What is it?
It's a tool that allows you to visualise in depth the emotional and rational aspects of our user by expressing his actions and feelings. We will use this technique to try and understand his point of view regarding a need/problem/product/service.
How is it done?
Having designed and generated our persona (the Persona tool), we have to get inside his skin to gain a better understanding of the way he thinks and acts, and hence what he is really like in a given real situation/scenario.
a) What does he say and think? Opinions and facts which he communicates and those which pass through his head.
b) What does he do and what does he feel? Actions and behaviour patterns which are expressed and internal emotions and feelings.
c) What does he see and hear? Things/events which he himself appreciates or facts/data which are related to him.
All this is in response to a situation or need, or to whatever is related to an existing product or service.
For example, what does our customer/user, Peter, say and think, what does he do and feel, what does he hear and see with respect to the subject of innovation? Questions that may help towards reaching an answer: what is innovation for him, what bothers him when innovation is under way, what does he think about his own innovative capacity, about the environment in his company, the abilities of the companies in this country, what does he see or hear, what are his friends or his competitors doing?
When is it done?
We use this tool when we have drawn a clear image of our user or typical initial customer with the aim of empathising deeply with him. With this technique we shall obtain a range of hypotheses that will be needed to work on the subsequent investigation with the aim of understanding if what we have settled upon is accurate. A priority action in the initial definition of the project is reaching an increasingly empathetic understanding of our customer. For the launch of the Open Innovation Communities Project with FEUGA, it was very valuable for us to be able understand our users. We sought to grasp their reality in emotional terms on the basis of empathy.
|
MAPPING/CLIENT-MARKET EMPATHY MAP |

What is it?
It's the description of a user’s journey by means of representing the various points of contact that characterize his interaction with a product, service or company.
How is it done?
We identify all the actions that the user performs as a consequence of his interaction with our company/product/service and we subsequently organize them into a sequence.
The outcome is that we obtain a flow that we can analyse to detect possible failures or improvements as well as opportunities, while always bearing in mind the fact that the journey is described by our customer and through his perceptions.
When is it done?
We use this technique when we wish to holistically understand our product/service, using the contact points to describe the before, during and after of the customer's entrance into our environment. We factor in all those moments while analysing whether our company is satisfactorily fulfilling the customer’s expectations.
Before anything at all is defined, we must see what our customer’s present journey actually consists of at the moment when he acquires/uses/calls on our products or services. The use of this tool takes place at an initial stage when mapping consists of an initial internal analysis that defines our perception of what is happening. In the Orange Customer Design and Experience Department, this internally-developed map allowed us to reach an initial decision regarding areas in need of improvement or gaps where the experience needed boosting. In short, it is a starting hypothesis on which to base subsequent research.
Customers are changing and now prefer to access their bank at any time and place. In this digital environment, one of the most important resources being used by the multinational Spanish banking group BBVA, is a tool that gives them the ability to know this new digital customer and realise that she is more demanding and wants a greater range of options, and that she expects immediate solutions. The bank uses the Customer Journey resource to retrace the steps that a digital customer takes to contract a product or service.
|
MAPPING/CLIENT-MARKET CUSTOMER JOURNEY MAP |