
Chapter 6. Improving Visibility
Even with transparent communication, you’re going to encounter roadblocks and issues both during the development and the operational phases of every initiative. Issues can stem from inadequate processes, bugs, edge cases, or unforeseen user behavior. As the group responsible for managing applications and systems in production, the question that your group should ask is, “How can we minimize the impact of a mistake or an unforeseen event?”
In a previous chapter, I’ve discussed the value of reducing Mean Time To Recovery (MTTR). The first step in that process would be identifying that there is an issue that needs to be resolved. The second is to quickly understand relevant information about the event. That’s where observability comes in. It provides an organization with an ability to inspect the state of the systems at every step and detect changes, allowing you to assess and provide feedback on suboptimal processes and changes in behavior. Monitoring should be treated as a continuous feedback loop for determining the performance of each metric at any given time.
However, because a system’s purpose is to support business objectives, focusing solely on the system’s health is not sufficient to guarantee the business’ performance. While major issues such as outages that substantially disrupt user experience have a clear impact on business performance, more subtle issues can have an even larger impact on business operations despite the appearance of technical success. For example, an error in business logic that does not properly act on a failure condition can prevent a small percentage of web application users from completing a purchase for an extended period of time. Although a change in revenue trends might eventually be noticed by the finance group, system metrics such as uptime and network latency would appear within normal levels, allowing the issue to persist, potentially leading to a more substantial loss of revenue than would occur from a widespread but short outage.
Data without context can lead to an inaccurate understanding of what’s actually affecting your systems and your business. This chapter covers both the importance of continuous insight into business performance—including what kinds of monitoring and alerting metrics you should consider—and the importance of data correlation.
The Importance of Holistic Monitoring
Monitoring has traditionally been a function of IT, focusing on system health. However, the health of the system is not valuable as a standalone measure. For organizations that rely on technology for their business success, monitoring efforts that are isolated to technical symptoms are at high risk for continuous failures. Focusing on metrics related to business success is vital for teams responsible for the health of the supporting system.
I don’t give a **** if my whole datacenter is on fire, as long as I am still making money.
CEO
The operations group needs to have access to business metrics of success in order to have a holistic view of the business’s health and to be able to properly detect, diagnose, remedy, and (potentially) predict business-disrupting issues:
- Technical monitoring
-
Ensures that the application and systems are functioning as expected. Used for identifying failures in technical operations and capacity planning. Metrics can include network latency, CPU utilization, database, application performance, deployment frequency, and more.
- Business monitoring
-
Ensures that business processes are functioning as expected. Used for identifying changes in business trends. Metrics can include business KPIs such as revenue, profitability, conversions, subscriptions, and communication efficiency.
When working on improving visibility into different aspects of an organization’s performance, three “C”s should inform the process: collect, collaborate, and correlate:
-
Collect data from all the sources, technical and nontechnical
-
Collaborate on data quality and relevance with different groups
-
Correlate different data points for a holistic view
Traditionally, teams collect the data that is critical to understanding progress for local KPIs, as shown on Table 6-1. Periodically, the pieces of information are shared in support of a particular conversation, but continuous visibility of data is limited to a group with the perceived benefit of having it. The operations group sees the metrics showing the health of the system, developers are interested in application performance statistics, and business groups focus on their own KPIs. This means that every group is making their decisions based on a different dataset. The separation of data availability can provide a false sense of normalcy at different parts of the responsibility chain.
| Key metrics | Group |
|---|---|
| Resource utilization, availability, MTTR | Operations |
| Delivery velocity, defect rates, application performance | Development |
| Profit, organizational KPIs, growth | CEO |
| Revenue, expenses, efficiency | Finance |
| Click-throughs, conversions, visits | Marketing |
Let’s look at a case from one of the top social media sites, averaging hundreds of million events per day. A system with 24/7 user demands needs to have high availability Service-Level Agreements (SLAs), and the operations team has invested a significant effort into both system resilience and visibility and the application in order to assure continuous service delivery. For every interruption of service, caused by either an API failure or unavailability of a portion of architecture, the appropriate team would be notified immediately. An extensive rule set for “everything is working” criteria has been established, including HTTP checks returning a 200 code from target API checks, system health being within norm, and the user browsing trends being within defined thresholds. The assumption was that while those metrics were within the norm, from a system operations perspective, the site was operational. That criteria was serviceable until one of the issues the team encountered was silent loss of event data.
The site was up and available for browsing and the API accepted post requests and returned success codes to users, but the posts themselves never registered in the database due to a faulty code deployment. From the standpoint of the group responsible for operational stability, the available data showed that the site was up and running; frustrated users and business analysts had a different experience.
The issue, in this particular case, was that the team responsible for service availability had concentrated on monitoring system and application metrics. Even though these metrics are important for isolating and troubleshooting the problem, the first symptom of the problem should be a change in a business metric trend. Setting the system to collect data on average events per second and setting an appropriate threshold alert on it would immediately raise flags after deployment, allowing for much faster Mean Time To Detection (MTTD).
A Top-Down Monitoring Strategy
There are a number of reasons an effective monitoring strategy is beneficial. For one, because software can never be bug-free, constantly observing system behavior is the only way to detect production problems early. The complexity of modern systems is another reason, where a glitch in one part of the architecture can have a trickle-down effect throughout the entire system, manifesting as a completely different cause. And, of course, effective monitoring allows you to proactively detect potential problems such as user-detected failures, security breaches, and performance spikes.
But perhaps the most important reason to monitor and trend the behavior of your system is because things change. And changes affect business.
A change anywhere in the organization can have a trickle-down effect involving processes from completely different groups. As a person whose responsibility it is to maintain the health of the underlying systems that support business, you need to be able to detect the changes as well as understand the complete scope of their effects. Follow the steps laid out in the following subsections when defining your monitoring strategy.
Understand the Business Objectives
As discussed in Chapter 3, the first step toward establishing an effective monitoring program is to understand your organization’s business objectives. Clearly identifying these objectives helps to come up with a list of business-critical metrics that need to be continuously observed for change. Understanding the success baseline values of those metrics enables the changes in data patterns to be evaluated based on the value of change.
For example, an organization that relies on site registration (beta sign-ups, membership services) might want to begin with a business check to make sure the hourly number of registrations does not drop below a set threshold. Similarly, an ecommerce application could benefit from a business metric that monitors credit card transaction success-versus-failure ratio to ensure that the sales process works as expected. Metrics such as these not only provide considerable business intelligence for forward decision making, they also provide a framework of focus for technical metrics in support of these benchmarks.
Map Business and Technical Metrics
After you’ve mapped the business objectives, the next step is to identify the technical metrics that affect the associated business metrics. Mapping the relationships between technical metrics and business objectives provides context and highlights mutual impacts. For instance, the credit card transaction success-versus- failure ratio measured by an ecommerce business depends on the availability of the application server, connectivity to a third-party authorization service, and availability and performance of that service itself. If an outage of the authorization service occurs, it will translate into a higher ratio of card transaction failures. Conversely, a higher ratio of card transaction failures might be caused by an issue highlighted by one of the associated technical metrics.
Correlate data
Continuous monitoring can (and should) collect large volumes of data for analysis. After the metric sets for each level have been established, make sure that the related metrics can be easily correlated. Collecting multiple business and technical metrics helps to ensure that the necessary information is available, but having the ability to review the related metrics together helps to ensure that the necessary information is useful. Understanding the relationships accelerates troubleshooting by enabling issues identified through a business metric to be mapped to the related technical metrics (and vice versa). Don’t underestimate the importance of cross-silo correlation. More often than not, interpreting the reason behind a change in one metric requires following a chain of impact through multiple metrics, often collected via different channels. Having that ability to easily traverse the dependency tree on demand would improve MTTR.
Let’s examine these premises by the way of a practical example. Most incident responses start with a call (or a page), and this one was no different. In this case, a call came from the CEO of a large online marketing company, operating a very complex system with multiple revenue-generation points supporting more than 100 million users. As he was reviewing his business health dashboard, the CEO noticed that the revenue from online channels had dropped by more than 20% from the normal daily threshold. He immediately escalated the issue to his web operations team.
As any engineer knows, step one of troubleshooting the problem is to confirm the problem, so looking at the revenue trends seemed like a good starting point. Fortunately, the WebOps team had access to business KPI metrics, so it was able to pull up the information in its monitoring system, as shown in Figure 6-1.
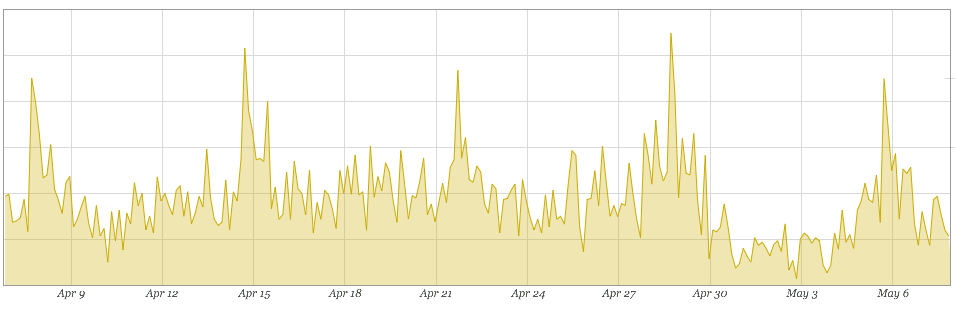
Figure 6-1. Revenue data over the course of a month
The graph clearly shows that, starting around April 30th, the trend looked abnormal in comparison to the previous few weeks. It seemed like there was an actual problem with revenue and not just a fluke in the report. Potentially, the issue could lie in the payment processor or another place in the system. However, it could also be a result of a nontechnical issue such as an unsuccessful marketing campaign or a drought in the sales process. The next logical step would be to correlate revenue to user traffic, collected from Google Analytics, to see whether there were any common trends, as shown in Figure 6-2.

Figure 6-2. Revenue and user traffic data from the same period
Even though the traffic showed a clear drop at the same time as revenue, the ratio of revenue/visitor remained the same, allowing the team to exclude the payment processor and other application-specific logic from the list of immediate suspects.
Note
Often, this is the first potential breaking point in the process. It is very tempting to look at the ratios, attribute revenue decrease to natural traffic decrease, and stop the investigation.
The next question that the team asked was “what would be a logical cause for a drop in overall traffic to the site?” Numerous studies have shown that even a minimal increase in latency can cause a significant drop in conversions, interactions, and, subsequently, revenue. There are a number of potential performance bottlenecks in any web system, and this DevOps team had access to current and historic metrics for them, but the metric of the immediate concern in this case was user-perceived performance (as shown in Figure 6-3).
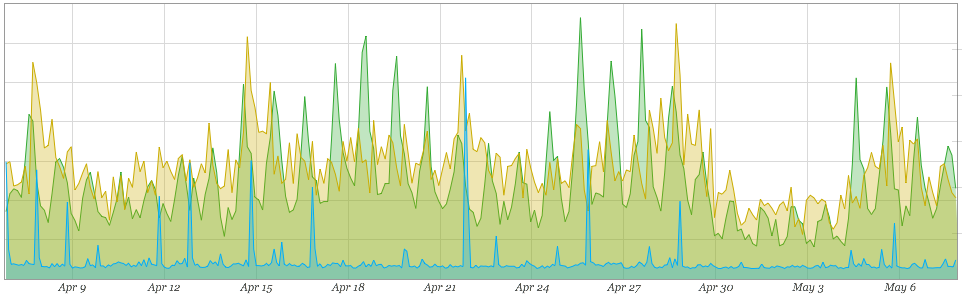
Figure 6-3. Revenue, user traffic and user-perceived performance data
Load times didn’t seem to be deviating from the norm, but, as mentioned in the earlier example of the top social media site going down, the HTTP response metric doesn’t provide full visibility into the load times for a dynamic application, so checking the health of the database and CPU usage on the server(s) to validate that the underlying platform was not the cause was a reasonable step.
Note
There are numerous metrics to monitor database and system health that should be collected, as they are in this case, but when researching the root cause of the elusive problem, diving deep into a specific component can waste time early in the process.
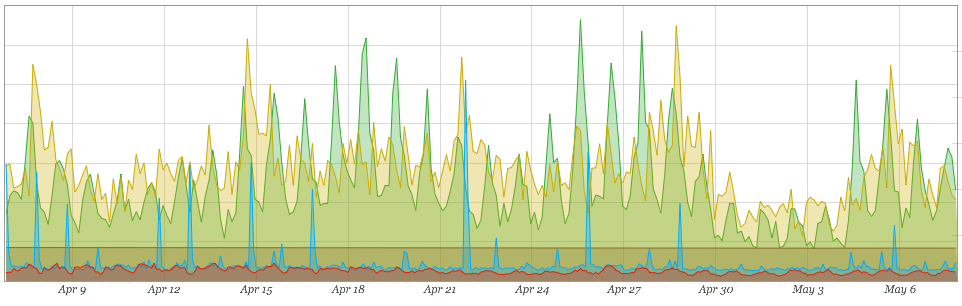
Figure 6-4. Revenue, user traffic, user-perceived performance, and database load data
The high-level metrics showing overall system performance appear well within the norm (see Figure 6-4), so at first glance, it seems like the original revenue problem was not a systems issue.
Note
This is the second point of the investigation where the process can break down due to the assumption that a problem doesn’t have a known system origin.
A lot of engineers would conclude that there was no confirmation to the problem reported; the reported problem was just an anomaly because the technical system monitors didn’t exhibit any issues. This is exactly why it’s vital that technology teams understand the business.
After confirming that there were no clear indications of system issues, the team turned its collective eye to the business metrics collected, particularly the marketing metrics. It is not uncommon for a site to see a drop in purchases if a company stops promoting or if its marketing campaign is ineffective: traffic to the site slows down, subsequently decreasing the number of transactions. This company, in particular, sends out tens of millions of emails each day, bringing new and returning users to the site and subsequently guiding them through revenue-generating channels. So, looking at the email deliverability and bounce rates collected from the company’s email engine was a good next step, as shown in Figure 6-5.

Figure 6-5. Data for revenue, user traffic, user-perceived performance, database load, and email bounces
Bingo! The bounce rates skyrocketed at the same time as the drop in traffic and revenue stream occurred. Upon closer investigation, it appeared that one of the major Email Service Providers (ESPs) accidentally blocked the delivery domain, thus preventing marketing emails from being delivered to the recipients. The issue was resolved (after some heated discussions with the ESP) and the trends returned back to the expected level.
Fortunately, the company’s policy was one of transparency, and the DevOps team had sufficient data to target and correlate during troubleshooting. The availability of cross-domain metrics and the ability for the team responsible for incident response to merge and compare trends across business and technical domains enabled rapid resolution of the issue with little wasted effort across all teams.
Note
If email deliverability was not the issue, there were over 1,500 other development, operational and system metrics that were on a list to be verified. Having access to those metrics significantly speeds up troubleshooting and, subsequently, time-to-resolution.
The primary goal for an effective monitoring program is to improve business performance. It also minimizes negative impacts by enabling faster MTTR, and maximizes opportunities by providing information to guide planning and to support strategy development. As such, when defining your monitoring strategy, begin with a focus on a change in trends to top-level strategic KPIs as actionable trigger events. From there, work down the logical stack to collect supporting metrics to have data available for contextual analysis.
Tip
To limit the quantity of data to a reasonable level and avoid stale or stray data points, for each metric added for analysis, you must ask two questions: “what are the key decisions that this metric will enable?” and “under what condition this metric is no longer needed?”
Continuous Instrumentation
I should note here that monitoring, much like security and performance, is not a feature. It cannot be treated as a line item on a delivery checklist or project plan. Adding metric collection as a post factum to a project delivery will result in significant holes in coverage of both business and technical metrics.
Many DevOps practices incentivize smaller, more frequent changes. Changes could include feature enhancements, marketing initiatives, or process improvements. But, as was noted in previous chapters, every change carries a certain positive or negative value. To determine that value, you need to have the composite measurable data collected for both pre- and post-change state. The delta of those two provides an incremental value of a specific change.
That having been said, determining and instrumenting a check for every change criterion is impossible. There are three types of change events that can occur:
- Known knowns
-
These are the metrics and success criteria that are known from the start, such as returned 200 codes from the API endpoint.
- Unknown knowns
-
These are the predicted problem-indicating edge cases that can be caught by observing top-level overtime trends, such as revenue thresholds.
- Unknown unknowns
-
These are the points of change that no one anticipates. These changes can initially be noticed only by their effect on other behavioral metrics.
Let’s examine a situation very similar to the example with email deliverability affecting the bottom line. Like the previous example, this incident also started with the CEO noticing a visible revenue drop. However, unlike the success story in which the DevOps team managed to find a cause after traversing through metric dependencies, this time the team did not find anything out of the ordinary. It too had an abundance of metrics at its disposal, but none of those metrics could be attributed as a root cause of the problem.
The problem persisted for two days. IT and marketing teams continued to analyze logs and to collect data in search of anomalies, to no avail—until a call came in from accounting to the developers, asking them to remove the American Express logo from the checkout page because they were in a middle of renegotiating rates and therefore not currently accepting American Express cards.
Again, this was a process change, manifesting as a technical problem, resulting in a revenue loss.
Putting aside a clear lack of communication that needed to be addressed organizationally, IT should not have been faulted for not collecting credit card type usage metrics. No one could have foreseen this particular manifestation of the problem. However, after the incident, the team added a check that would catch similar criteria in the future, such as hourly usage threshold or credit card distribution ratio.
In each of these examples, the team had access to more than 1,500 metrics to review when the incident occurred. A lot of those metrics were added over time, after either the initial problem occurrence or in response to business-driven changes.
New data points should be added to the collection system with a discovery of a new variable condition or with a change to base assumptions. Make it a part of your standard operating procedure to include visibility coverage assessment and improvement as part of any incident retrospective or new requirement implementation.
As mentioned earlier, monitoring strategy should not solely focus on measuring the availability and success of the service offered. Internal process inefficiencies can often be more costly than system outages. Changes don’t just happen in software. Organizationally, KPI, process, even personnel changes can cause a value-altering chain reaction.
Monitoring Processes
The main reason why monitoring is important for any organization is because you cannot improve what you can’t measure. This mantra applies not only to systems, but also to processes. The ability to observe processes helps not only to respond to change-induced issues, but also to detect inefficiencies. Implementing key metrics across the organization helps you to recognize areas that are most in need of improvement. If the metrics show that certain workflows are inefficient due to bloated processes or interactions between multiple groups, those workflows need to be reviewed and changed. Having insight into cross-departmental process efficiency provides a holistic picture of the areas in need of improvement.
Much like with technical metrics, a cascading approach should be taken when monitoring processes. A process, for all intents and purposes, is a workflow. Workflow consists of multiple steps that result in a desired outcome. From a metric collection perspective, that outcome would be the top-level business value that needs to be observed and measured. Each individual step in that workflow should also be monitored and treated as a supporting metric.
Applying value stream mapping to each measurable point in a process can help to isolate areas in need of the most attention. Measuring the success of individual steps in a process against the value delivered and creating an actionable feedback loop to the team will allow you to continuously optimize those processes. Make sure to constantly assess the value of any action. If it contributes to net negative value of the overall process, change it.
An obvious example of a process with multiple individual steps that can be optimized would be a development process. It’s a great way to gauge how effectively your team is operating and covers a broad spectrum of areas with potential need for improvements. Collecting metrics on top-level criteria such as time to market and defect rate (see Chapter 3), gives a baseline performance indication of your development process. However, to improve the outcome, efficiency should be injected into individual steps of that process. The metrics collected are an indication of how efficient each step is.
Tip
Break down each process into smallest possible measurable events and collect data on each.
If time to market is one of your KPIs that is in need of optimization, supporting metrics (such as feedback loops and time from commit to deploy) need to be examined. Assuming that commit-to-deploy time is the metric that negatively stands out, it can be broken down even further into smaller measurable events. Digging further, the reason for inefficiency might be that one of many steps of a feature approval process is contingent on an individual who travels a lot. If you can eliminate that step or delegate it to a committee, it would significantly shorten commit-to-deploy time and, subsequently, improve the overall metric of time to market.
This chapter talks specifically about monitoring, but organizational observability strategy should not be limited to systems and application monitoring. Every group should be responsible for collecting (or making available for collection) data specific to the group’s domain. The resulting superset should provide visibility into any process, technical or not, that contributes to the overall value delivery with a focus on business-first metrics via monitors, logs, or any other means. Moreover, your alerting strategy should follow the same path.
Alerting
A holistic monitoring approach encourages expanding your monitoring strategy to areas outside of IT and logically forces teams to increase the number of metrics collected. With the incrementally increasing complexity of modern systems and the broadening scope of observable behavior, the “monitor everything” mantra can exponentially increase a number of metrics collected. On the surface, this is a good thing. Having more data at your disposal provides more granular information for analysis, increasing the velocity of improvements. In theory.
In practice, however, applying data collection principles to notifications can generate alert volumes that are a curse for many teams. Can you imagine having an alert on every one of the 1,500-plus metrics in the previous example—from IOPSs to component metrics to individual user page views? In addition to the sheer number, false positives and misplaced alerts can place a significant burden on the teams responsible for supporting the business instead of helping them to detect and fix issues quicker. To make matters worse, indiscriminate alerting increases the chance of misprioritization, or altogether omittance, of a critical alert. For this reason, the concept of “actionable” alerts has been a familiar term in the world of operations.
An actional alert principle dictates a baseline requirement for every new production alert. Anyone adding an alert must answer two top-tier questions:
- What is the business impact of this alert?
-
This is the single most important question to answer before adding a production alert for a potential failure condition. When this failure occurs, does it materially affect the business? If the answer is no, it should not be an alert that wakes someone at 3 a.m. By way of example, a failed node in a cluster of web servers, while requiring investigation and correction, does not critically impact business operation.
- Can something be done to remedy the problem?
-
If immediately fixing or implementing a workaround is not obvious or is outside of the control of a person woken up at 3 a.m., it should not be an alert. Let’s revisit the American Express decline rate example. Although having data available would significantly decrease discovery time in the case of a repeat problem, immediate alert on that failure would not be actionable because the solution is outside the control of an on-call team. For issues that can be addressed by only non-operational staff, a separate alert contact group or an escalation chain should be defined to make sure the appropriate people are notified about the potential problem.
There are additional questions that are beneficial for the team, such as, “Can this problem persist until tomorrow with minimal/no negative impact?” and “Is someone better equipped to resolve this problem?”, that would send notifications to designated groups via different alerting channels—but the primary questions would dictate the necessity and validity of each alert that goes into the system.
Making alerts actionable can significantly improve the quality of life and service for the team. Following top-down design as a guiding principle for alert structure will also focus your efforts on things that are important to the business. Additionally, like most things in DevOps culture, it is important to make continuous improvement to your alerts. Incident post-mortems and “near miss” retrospectives are good times to identify opportunities to improve monitoring, and especially alerting. Improving the signal-to-noise ratio by filtering out certain alerts, making alerts clearer, and directing alerts to the person who is more likely to address it is required to keep the team focused on the right objectives.
Remember: monitor everything. Alert only on what’s important for the business.