
10
Voice Activity Detection
10.1 Introduction
In voice communications, speech can be characterized as a discontinuous medium because of the pauses which are a unique feature compared to other multimedia signals, such as video, audio and data. The regions where voice information exists are classified as voice-active and the pauses between talk-spurts are called voice-inactive or silence regions. An example illustrating active and inactive voice regions for a speech signal is shown in Figure 10.1.
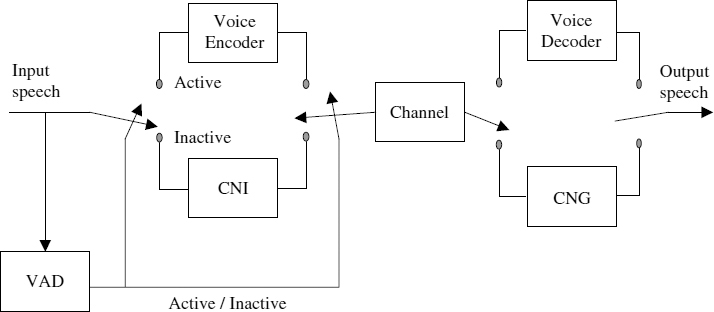
A voice activity detector (VAD) is an algorithm employed to detect the active and inactive regions of speech. When inactive regions are detected, transmission is generally stopped and only a general description of the background information is transmitted. At the decoder end, inactive frames are then reconstructed by means of comfort noise generation (CNG), which gives natural background sounds with smooth transitions from talk-spurts to pauses and vice versa. To enhance the naturalness of the generated background signal, regular updates of the average information on the background signal (especially necessary during noisy communication environments) is transmitted by the comfort noise insertion (CNI) module of the encoder. The overall structure of the silence compression scheme employing a VAD, CNG, and CNI is shown in Figure 10.2.
Speech communication systems which operate a VAD for compression of inactive speech regions provide various benefits especially useful for bandwidth-limited communication channels. These benefits can be summarized as given in the following list:
- Co-channel interference reduction in cellular communications: It is possible to suppress co-channel interference in cell-based wireless communication systems by decreasing transmission power during inactive regions (speech pauses).
Figure 10.1 Voice active and inactive regions
Figure 10.2 Overall structure of a speech coding system with silence compression
- Improvement of the soft channel capacity in the code division multiple access (CDMA) system: The theoretical capacity of a CDMA system is usually defined by the possible combinations of the spreading code. However, due to interference from other users, the CDMA capacity is limited to a value smaller than this theoretical limit, i.e. due to interference from other users, the error rates received by some users may be too high to enable accurate decoding. By reducing the transmission power during speech pauses, the interference on air can be reduced, which may automatically allow more users on the system, hence achieving an increase in the CDMA system's capacity.
- Power-saving for mobile terminals: Mobile terminals do not have to transmit radio signals during pauses. Thus, the battery life time of the terminals can be extended by conserving power during speech inactive periods.
- Increase in channel capacity by statistical multiplexing: A channel can be granted just during talk-spurts and released during pauses. Once granted, a user occupies a channel until the end of a talk-spurt and releases it immediately after the last active speech frame. To get the channel allocation again, the user makes a request at the start of the next talk-spurt. This way the channel resources can be utilized in a more efficient way by the statistical multiplexing scheme, which allows a number of users to communicate at the same time over limited channel resources. Note: in statistical multiplexing, there is a possibility that there are no free channel slots when a user makes a request. In this case, the new user may be rejected after a time-out, which may cause information loss resulting in some quality degradations.
- Reduction in packet losses when transmitting voice over packet-based networks: A packet-based system can be overloaded with more packets than it can handle. The congestion of packet-based systems can be reduced during voice communication by producing packets only during active speech regions and cutting out packets for the inactive speech regions.
- Bit-rate reduction: In addition to the bit-rate reduction achieved by speech compression techniques, the use of a VAD together with silence compression (cutting out the inactive speech regions) gives additional reduction in the bit-rate regardless of speech coders.
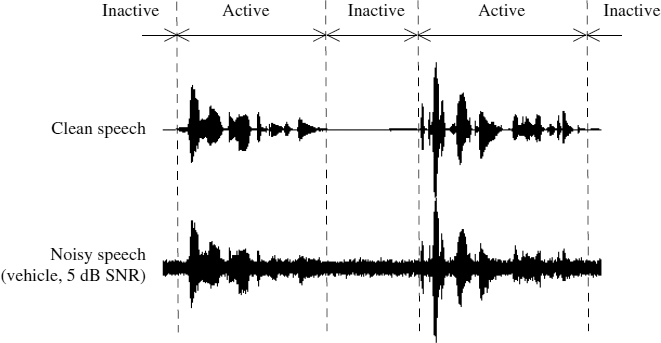
The VAD usually produces a binary decision for a given speech segment (usually 10–20 ms long) indicating either speech presence or absence, which is quite easy for clean background speech. For example, by checking the energy level of the input signal, it is possible to obtain a high speech/nonspeech detection performance. However, in real environments, the input signal may be mixed with noise characteristics which may be unknown and changing with time. In some cases where the background noise is significantly high, the speech may be obscured by this noise. Especially, the unvoiced sounds, which are important for speech intelligibility, may be misdetected in such noisy environments. Figure 10.1 shows an example for a noisy speech segment with vehicle noise of 5 dB signal to noise ratio (SNR). As can be seen from the figure, some low energy speech parts are fully submerged in noise, making it very difficult to discriminate these talk-spurts even by visual inspection. Incorrect classification of these talk-spurts can cause clipped sounds which may result in significantly degraded speech quality. On the other hand, the increase in false detection of silence loses the potential benefits of silence compression. There is a trade-off in VAD performance, maximizing the detection rate for active speech while minimizing the false detection rate of inactive speech regions.
10.2 Standard VAD Methods
In order to exploit the advantages of silence compression, a number of VAD algorithms have been proposed, some of which have been selected by standards organizations including ITU-T, ETSI, and TIA/EIA. ITU-T released G.729 Annex B (G.729B) [1] and G.723.1 Annex A (G.723.1A) [2] as extensions to the 8 kb/s G.729 [3] and 5.3/6.3 kb/s G.723.1 [4] speech coders for performing discontinuous transmission (DTX). ETSI recommended GSM-FR, -HR, and -EFR VAD methods for European digital cellular systems [5–7]. Recently, ETSI released two more VADs, adaptive multi-rate VAD option 1 (AMR1) and option 2 (AMR2) [8], with a view to using it in UMTS (the third generation mobile communications). The North American standards organisation, TIA/EIA, released two VADs one for IS-96 [9] and the other for IS-127 [10] and IS-733 [11] (the VADs suggested for IS-127 and IS-733 have the same structure). Table 10.1 shows standard VADs classified in terms of the input features mainly consisting of subband energies and the spectral shape. For example, the TIA/EIA VADs use a small number of subbands whereas the IS-96 VAD uses the overall signal energy. The IS-127 and IS-733 VAD, on the other hand, decomposes the input signal into two subbands only. Traditionally, ETSI VAD methods have been based on a more accurate spectral shape of the input signal. The reason behind this is that the energy of the predictive coding error increases when the spectral shapes between the background and input signal mismatch (i.e. when speech active). However, in the recent standard for AMR, ETSI adopted two kinds of VAD algorithms both of which are based on the spectral subband energies rather than the more accurate spectral shape. The ITU-T VAD standards, G.729B and G.723.1A, conduct the detection using four different features including both the spectral shape and subband energies.
Table 10.1 Classification of standard VAD methods depending on input features; the values in parentheses indicate the number of spectral subbands
| Main features | VAD |
| Spectral shape | GSM-FR, GSM-HR, GSM-EFR |
| Sub-band energies | IS-96 (1), IS-127 (2), IS-733 (2) |
| AMR1 (9), AMR2 (16) | |
| Others | G.729B, G.723.1A |
10.2.1 ITU-T G.729B/G. 723.1A VAD
As an extension to the G.729 speech coder, ITU-T SG16 released G.729 Annex B in order to support DTX by means of VAD, CNI, and CNG. G.729B conducts a VAD decision every frame of 10 ms, using four different parameters:
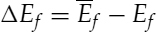
- a full-band energy difference,
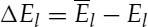
- a low-band energy difference,
- a spectral distortion,
- a zero-crossing rate difference,
where Ef, El, LSFi, and ZC are the full-band energy, low-band energy, ith line spectral frequency, and zero-crossing rate of the input signal. ![]() ,
, ![]() ,
, ![]() , and
, and ![]() are the noise characterizing parameters updated using the background noise.
are the noise characterizing parameters updated using the background noise.
The block diagram of G.729B VAD is shown in Figure 10.3. The input parameters for the VAD can be obtained from the input signal or from the intermediate values of the speech encoder. Subsequently, the difference parameters, ΔEf, ΔEl, ΔLSF, and ΔZC, are computed from the input and noise parameters. A decision of voice activity is conducted over a four-dimensional hyper-space, based on a region classification technique, followed by a hangover scheme. The noise parameters are updated based on a first order autoregressive (AR) scheme, if the full-band energy difference is less than a certain fixed threshold. ITU-T G.723.1A VAD has a structure similar to G.729B VAD.
10.2.2 ETSI GSM-FR/HR/EFR VAD
The VAD algorithms of ETSI GSM-FR, -HR, and -EFR have a common structure, in which the predictive residual energy is compared with an adaptive threshold. The predictive residual energy is computed using the current and smoothed autocorrelation values which describe the spectral characteristics of the signal. The assumption is that if the signal is background noise only, which is fairly stationary, the average spectral shape will be similar to the current frame's shape and hence result in smaller residual signal energy. The threshold for VAD decision is updated during noise-only regions using the most recent noise signals in order to reflect up-to-date noise characteristics. A block diagram of the GSM-FR/HR/EFR VAD is shown in Figure 10.4.
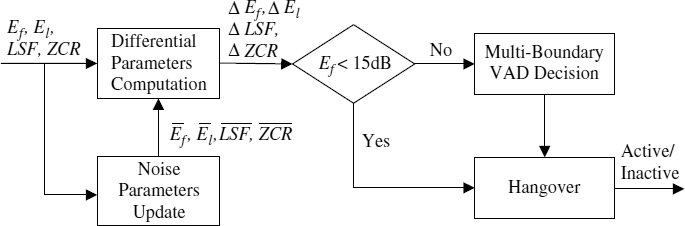
Figure 10.3 Block diagram of ITU-T G.729B VAD
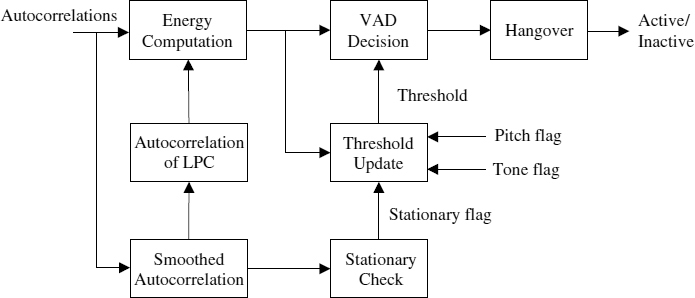
Figure 10.4 Block diagram of ETSI GSM-EFR VAD
10.2.3 ETSI AMR VAD
AMR1 decomposes the input signal into nine nonuniform subbands using filter banks where lower frequency bands have smaller bandwidths and higher frequency bands have larger bandwidths. Then it calculates each subband energy followed by its corresponding SNR estimate. The energy of the background noise used in calculating the SNR is computed by an adaptive method based on a first-order AR-model together with internal VAD logic. Finally, VAD decision is conducted by comparing the sum of the subband SNRs with an adaptive threshold, followed by a hangover. The block diagram of AMR1 is shown in Figure 10.5.
AMR2 has a structure similar to AMR1 in that VAD is performed using the subband energies together with the background noise energy. However, AMR2 transforms the input signal into the frequency domain using FFT, instead of the filter bank used in AMR1, and then calculates each subband energy in which the number of bands is 16 with a nonlinear scale in band grouping. Subsequently, SNRs for each subband are calculated using the input and the background noise spectra. The background noise energy for each band is adapted during noise frames using a first-order AR-based scheme. In order to prevent being over sensitive to nonstationary background noise conditions, AMR2 increases the threshold for final VAD decision for highly fluctuating signals, measured by the variance of their instantaneous frame-to-frame SNRs. Furthermore, noise adaptation may not be accurately performed by measuring the spectral deviation when subband energies fluctuate rapidly. Thus, AMR2 changes the VAD threshold in an adaptive way together with the variation of burst and hangover counts. The hangover control is performed by measuring the peak-to-average SNR, in which the average SNR is calculated using AR-adaptation with the increased instantaneous SNR. In other words, for an increase of the peak-to-average SNR, it decreases the hangover and burst counts while increasing the VAD threshold. The block diagram of AMR2 is shown in Figure 10.6.
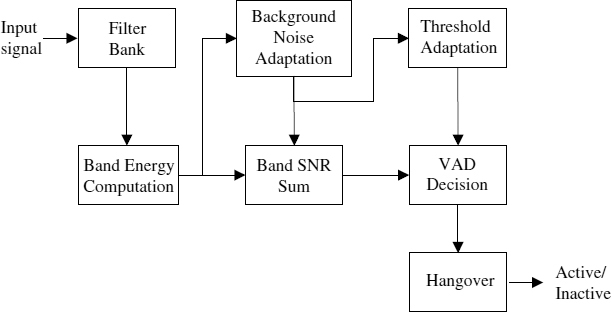
Figure 10.5 Block diagram of ETSI AMR VAD option 1
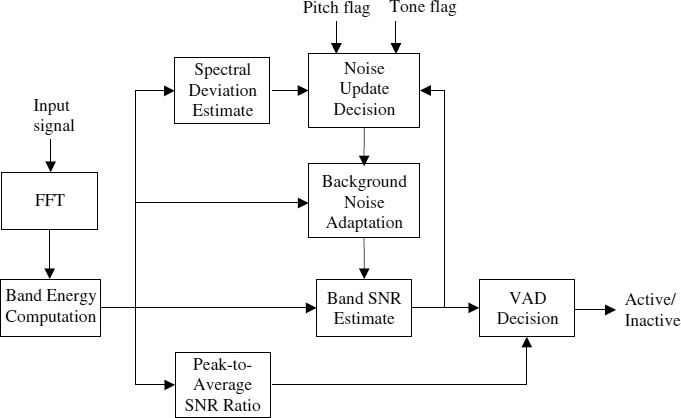
Figure 10.6 Block diagram of ETSI AMR VAD option 2
10.2.4 TIA/EIA IS-127/733 VAD
CDMA-based digital cellular systems have a natural structure for incorporating VAD, called a rate determination algorithm (RDA), which gives substantial improvement in channel capacity by controlling the radio transmission power to reduce co-channel interference. TIA/EIA released two kinds of RDA for IS-96 and IS-127, called 8 kb/s Qualcomm code-excited linear prediction (QCELP) and enhanced variable rate codec (EVRC), respectively. In the North American CDMA standard, IS-127 RDA supports three rates: 1, 1/2, and 1/8. Active speech is encoded in 1 or 1/2 rate and background noise is encoded in 1/8 rate. The RDA of IS-733, called 13 kb/s QCELP, is the same as IS-127.
As input parameters, IS-127 RDA uses two subband energies with the long-term prediction gain. Firstly, it calculates the smoothed subband energy using a first-order AR-model. Subsequently, the signal and noise energies for each subband are adapted depending on the long-term prediction gain. In other words, the signal energy is actively adapted to the current input if the prediction gain is relatively high. On the other hand, if the gain is relatively low, it increases the noise adaptation rate. Using the two subband energies of the signal and noise, each subband SNR is calculated. The final rate is determined by comparing the SNRs with adaptive thresholds depending on the level of background noise and the SNR of the previous frame, followed by a hangover. The block diagram of IS-127 RDA is shown in Figure 10.7.
10.2.5 Performance Comparison of VADs
The five standard VAD algorithms have been evaluated in terms of detection error rates for speech and silence. The test data was 96 seconds of speech, filtered by the modified IRS, and then mixed with vehicle and babble noises of 5, 10, 15, and 25 dB SNR. The active and inactive regions of the speech material were marked manually. The proportions of the inactive and active regions of the speech material were 0.43 and 0.57, respectively. The VAD decision is carried out every 10 ms in the cases of G.729B and AMR2, and every 20 ms in GSM-EFR, AMR1 and IS-127. With slight modification to the AMR2 source code, it is possible to obtain 10 ms results because AMR2 basically conducts the detection every 10 ms and then returns 20 ms results using a logical combination of the two 10 ms results. In handling the multiple rates of IS-127, the upper two rates, 1 and 1/2, have been assumed to be voice active and the lowest rate, 1/8, is treated as voice inactive.
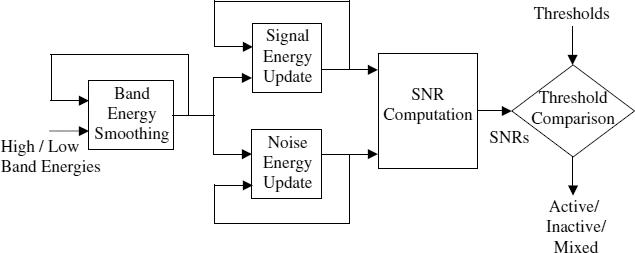
Figure 10.7 Block diagram of TIA/EIA IS-127 RDA
Performance in a vehicle noise environment are shown in Figures 10.8 and 10.9, and performance for babble noise are shown in Figures 10.10 and 10.11. G.729B exhibits the worst performance compared with other methods, especially for low SNRs. G.729B produces high speech detection errors, which can cause severe clipping of speech. IS-127 exhibits relatively high error rates for speech detection compared with those of ETSI VADs. However, it produces quite reasonable performances in silence detection for babble noisy speech. ETSI VAD methods, i.e. GSM-EFR, AMR1, and AMR2, exhibit similar performances in speech detection, while giving quite variable performances in silence detection. GSM-EFR produces the most desirable performances for relatively high SNRs, i.e. greater than 15 dB. However, the error rates of silence detection increase substantially for decreasing SNR. AMR2 produces relatively consistent results regardless of the noise levels in silence detection for vehicle noisy speech. The performance of AMR1 is between GSM-EFR and AMR2. The characteristics of frame-wise voice activity decisions for various noise sources and levels are shown in Figures 10.12 and 10.13.

Figure 10.8 Comparison of speech detection error rates against various vehicle noise levels
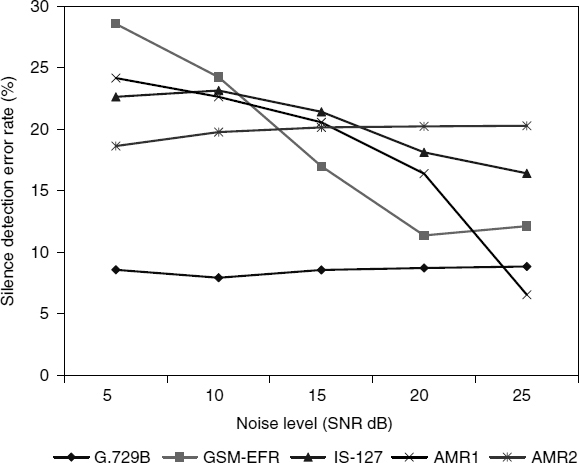
Figure 10.9 Comparison of silence detection error rates against various vehicle noise levels

Figure 10.10 Comparison of speech detection error rates against various babble noise levels
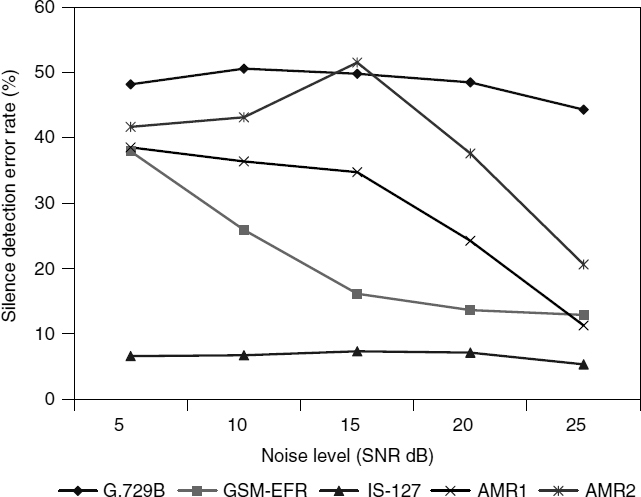
Figure 10.11 Comparison of silence detection error rates against various babble noise levels
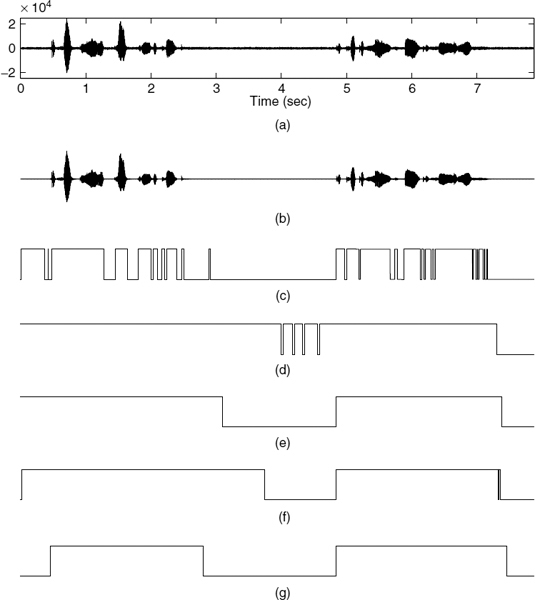
Figure 10.12 Comparison of VAD results over vehicle noise of 15 dB SNR: (a) noisy input speech, (b) clean speech, (c) G.729B, (d) IS-127, (e) GSM-EFR, (f) AMR1, and (g) AMR2
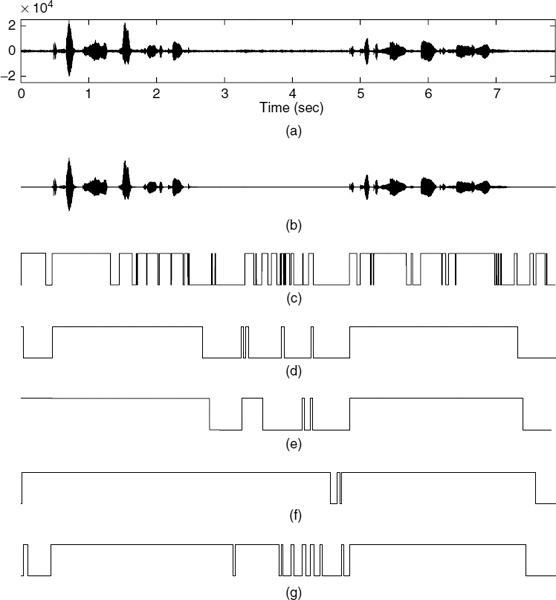
Figure 10.13 Comparison of VAD results over babble noise of 15 dB SNR: (a) noisy input speech, (b) clean speech, (c) G.729B, (d) IS-127, (e) GSM-EFR, (f) AMR1, and (g) AMR2
10.3 Likelihood-Ratio-Based VAD
Sohn et al. have proposed a novel method which, unlike traditional VAD methods, is based on a statistical model. They report that it can produce a high detection accuracy [12]. The reason for the high performance is attributed to the adoption of Ephraim and Malah's noise suppression rules [13] for the voice activity decision rules.
A voice activity decision can be considered as a test of hypotheses: H0 and H1, which indicate speech absence and presence, respectively. Assuming that each spectral component of speech and noise has complex Gaussian distribution [13], in which the noise is additive and uncorrelated with speech, the conditional probability density functions (PDF) of a noisy spectral component Yk, given H0,k and H1,k, are:
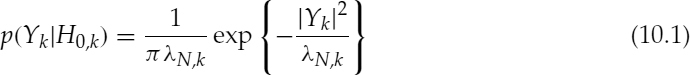
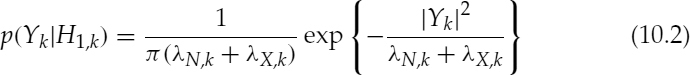
where k indicates the spectral bin index, and λN, k and λX, k denote the variances of the noise and speech spectra, respectively.
The likelihood ratio (LR) of the kth spectral bin, Λk, is defined from the above two PDFs as [12]:

where γk and ξk are the a posteriori and a priori SNRs defined as, γk = |Yk|2/λN, k − 1 and ξk = λX, k/λN, k. Note that the definition of the a posteriori SNR is slightly different from the original one, γk = |Yk|2/λN, k [13]. The noise variance is assumed to be known through noise adaptation (see Section 10.3.2). However, the variance of the speech is unknown, thus the a priori SNR of the nth frame, ![]() , is estimated using the decision-directed (DD) method [13] as:
, is estimated using the decision-directed (DD) method [13] as:
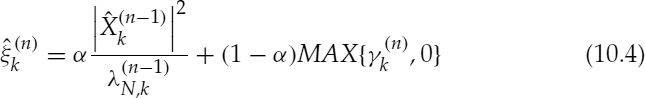
where α is a weighting term, e.g. 0.98, and the clean speech spectral amplitude, ![]() , is estimated using the minimum mean square error of the log spectral amplitude estimator [14]. The decision about the voice activity is performed by the geometric mean of the Λk over all spectral bins as:
, is estimated using the minimum mean square error of the log spectral amplitude estimator [14]. The decision about the voice activity is performed by the geometric mean of the Λk over all spectral bins as:
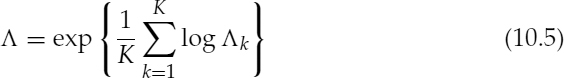
where K denotes the number of spectral bins.
The a posteriori SNR γk fluctuates highly from frame to frame because of the high fluctuation of the short-time spectral amplitude |Yk|. On the other hand, the a priori SNR ![]() changes slowly due to the smoothing effect. As the value of α increases,
changes slowly due to the smoothing effect. As the value of α increases, ![]() becomes smoother. The variations of γk and
becomes smoother. The variations of γk and ![]() balance each other in the calculation of Λk and, consequently, result in enhanced performance for the VAD. The DD estimator for the a priori SNR is therefore useful not only for avoiding the musical noise phenomenon in speech enhancement [15], but also for reducing the error rate in voice activity detection.
balance each other in the calculation of Λk and, consequently, result in enhanced performance for the VAD. The DD estimator for the a priori SNR is therefore useful not only for avoiding the musical noise phenomenon in speech enhancement [15], but also for reducing the error rate in voice activity detection.
10.3.1 Analysis and Improvement of the Likelihood Ratio Method
The behaviour of the LR in equation (10.3) with respect to the a priori and a posteriori SNRs, is shown in Figure 10.14. The ML estimator [12] results in lower performance in comparison with the DD estimator because of the inherent high-fluctuation of the a posteriori SNR. The LR employing the DD estimator has the following properties:
- If the a posteriori SNR is very high, i.e.
 , and the range of the a priori SNR is limited, the LR becomes very high, i.e.
  .
. - If the a posteriori SNR is low, i.e. γk < 1, the a priori SNR becomes a key parameter in the calculation of the LR.
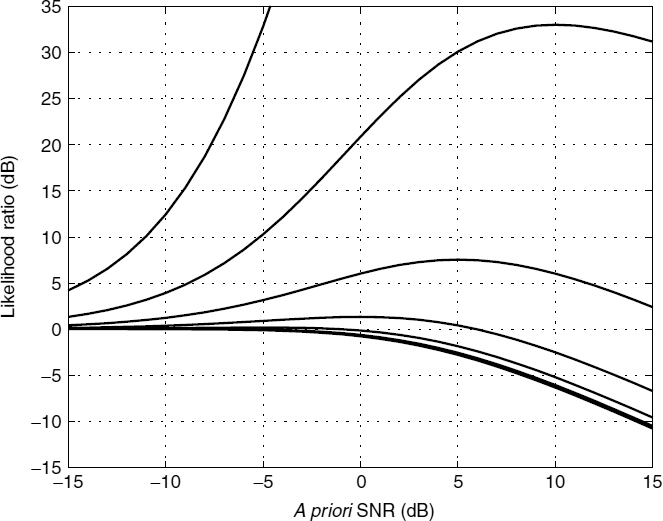
Figure 10.14 Likelihood ratio vs a priori SNR vs a posteriori SNR (the solid lines from the top represent a posteriori SNRs of 15, 10, 5, 0, −5, −10, and −15 dB, respectively)
In practice, the threshold of the LR is set between 0.2 dB and 0.8 dB, and both the a posteriori and the a priori SNRs are bounded between −15 dB and 15 dB.
Assuming that the noise characteristics change slowly, delay in estimation of the noise variance ![]() in equation (10.4) does not seriously affect the a priori SNR
in equation (10.4) does not seriously affect the a priori SNR ![]() . However, the spectral amplitude of the speech signal may change abruptly, particularly in onset and offset regions, in which the power of the spectral bins can increase and decrease rapidly, respectively. At the offset region, γk can be low but
. However, the spectral amplitude of the speech signal may change abruptly, particularly in onset and offset regions, in which the power of the spectral bins can increase and decrease rapidly, respectively. At the offset region, γk can be low but ![]() can be much higher than γk due to the delay in
can be much higher than γk due to the delay in ![]() as given in equation (10.4). Thus Λk becomes too low, according to the second property above, and, consequently, Λ may become lower than the threshold of VAD. On the other hand, the delay rarely causes a problem at the onset regions, according to the first property above, as
as given in equation (10.4). Thus Λk becomes too low, according to the second property above, and, consequently, Λ may become lower than the threshold of VAD. On the other hand, the delay rarely causes a problem at the onset regions, according to the first property above, as ![]() in equation (10.3) is usually large enough.
in equation (10.3) is usually large enough.
It is possible to consider an adaptive weighting factor in the estimation of the a priori SNR in equation (10.4). In other words, a lower α can be assigned for the active region, and a higher α for the inactive region. When a low α is assigned at the offset region, it reduces the effect of the delay in equation (10.4), producing a lower ![]() , and therefore may prevent the abrupt decay of Λk. However, it is not easy to design a generalized adaptive rule that will result in good performance over various kinds of speech and noise signals. Instead, Cho [16, 17] has suggested a smoothed likelihood ratio (SLR)
, and therefore may prevent the abrupt decay of Λk. However, it is not easy to design a generalized adaptive rule that will result in good performance over various kinds of speech and noise signals. Instead, Cho [16, 17] has suggested a smoothed likelihood ratio (SLR) ![]() which is defined as
which is defined as
where κ is a smoothing factor and ![]() is defined in equation (10.3) for the nth frame. The decision of the voice activity is finally carried out by computing,
is defined in equation (10.3) for the nth frame. The decision of the voice activity is finally carried out by computing,
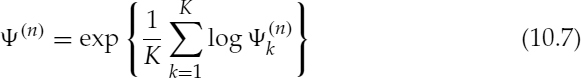
and comparing it against a threshold. An nth input frame is classified as voice-active if ψ(n) is greater than a threshold and voice-inactive otherwise.
Examples of the LR and the SLR over a segment of speech are shown in Figure 10.15. The SLR seems to overcome the problem outlined for the LR. As shown in Figure 10.15b, the SLR is relatively higher than the LR at the offset regions. The comparison over inactive frames is also shown in Figure 10.15c, which indicates that the SLR fluctuates less than the LR.
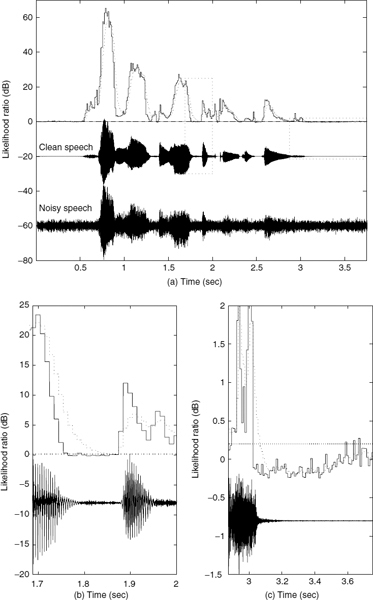
Figure 10.15 The LR (solid line) and SLR (dotted line) of a segment of vehicle noise signals of 5 dB SNR; the dotted horizontal-line indicates the VAD threshold and the boxed regions in (a) are enlarged in figures (b) and (c)
10.3.2 Noise Estimation Based on SLR
Depending on the characteristics of the noise source, the short-time spectral amplitudes of the noise signal can fluctuate strongly from frame to frame. In order to cope with time-varying noise signals, the variance of the noise spectrum is adapted to the current input signal by a soft decision-based method. The speech absence probability (SAP) of the kth spectral bin, p(H0,k|Yk), can be calculated by Bayes' rule as:
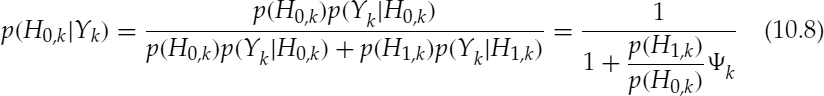
where p(H1,k) = 1 − p(H0,k), and the unknown a priori speech absence probability (PSAP), p(H0,k), is estimated in an adaptive manner given by:
where β is a smoothing factor, e.g. 0.65. The lower and upper limits, ![]() and
and ![]() , of the PSAP are determined through experiments, e.g. 0.2 and 0.8. Note that, for SLR, ψk is applied to the calculation of the SAP instead of LR, Λk.
, of the PSAP are determined through experiments, e.g. 0.2 and 0.8. Note that, for SLR, ψk is applied to the calculation of the SAP instead of LR, Λk.
The variance of the noise spectrum of the kth spectral component in the nth frame, ![]() , is updated in a recursive way as:
, is updated in a recursive way as:
where η is a smoothing factor, e.g. 0.95. The expected noise power-spectrum ![]() is estimated by means of a soft-decision technique [18] as:
is estimated by means of a soft-decision technique [18] as:
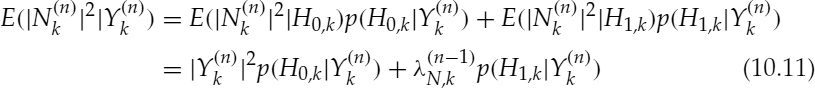
where ![]() . During some tests, it is observed that SLR-based adaptation is useful for the estimation of the noise spectra with high variations, such as a babble noise source.
. During some tests, it is observed that SLR-based adaptation is useful for the estimation of the noise spectra with high variations, such as a babble noise source.
10.3.3 Comparison
The effect of the smoothing factor κ in equation (10.6) is shown in Figure 10.16. Note that the case of κ = 0 reduces equation (10.6) to the LR-based method. It is obvious from the results that the detection accuracy increases with increase in κ, at the offset regions without serious degradations in the performance at the onset regions for both vehicle and babble noisy signals. In the case of vehicle noisy signals, as κ increases, the false alarm rate in the inactive frames increases gradually for κ < 0.9, and then substantially for κ > 0.9. However, in the case of babble noisy signals, it can be seen that the error rate decreases gradually as κ increases for κ < 0.9, and then increases like the case of the vehicle noisy signal, for κ > 0.9. Therefore, if κ is selected properly, SLR-based method can give significantly improved performances over the LR-based method.
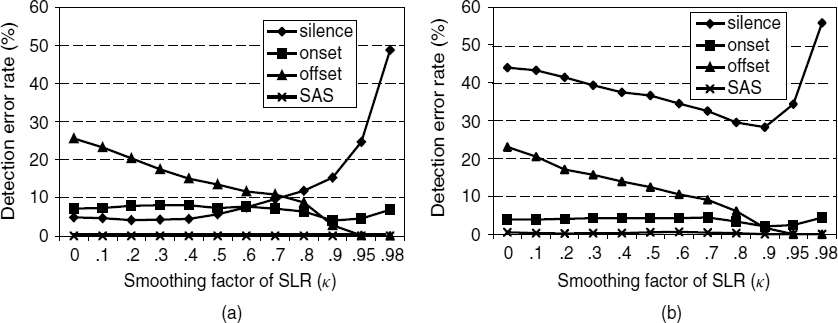
Figure 10.16 Analysis of the smoothing factor κ of the SLR with respect to detection error rates; the noise level is 10 dB SNR and the noise sources are (a) vehicle and (b) babble; SAS indicates speech active sections
Under various noise levels and sources, the performance of VAD methods such as SLR-based VAD [16, 17], ITU-T G.729 annex B VAD (G.729B) [1], ETSI AMR VAD option 2 (AMR2) [8], and LR-based VAD with and without the hangover scheme [12] have been compared as shown in Table 10.2. Original AMR2 produces the detection result every 20 ms by the logical OR operation of two 10 ms detection results, thus the 10 ms result can be obtained easily by slight modification of the original code. Taking into account the results in Figure 10.16, κ = 0.9 is selected for SLR-based VAD. G.729B generates considerably high error rates at the active regions in comparison with other methods. It is important to note that frequent detection errors of speech frames lead to serious degradation in speech quality, thus the error rate of speech frame detection should be as low as possible. LR-based VAD gives consistently superior performance to G.729B, but VAD without the hangover scheme produces relatively high detection error rates in the active regions. The hangover scheme can considerably alleviate this problem, but the speech detection error rate is still somewhat high in comparison with the results of both SLR-based VAD and AMR2. The performance of SLR-based VAD and AMR2 seems to be comparable.
Table 10.2 Comparison of speech and silence detection error rates of SLR-based, LR-based, AMR2, and G.729B VADs

LR + HO means LR-based VAD with the hangover scheme
10.4 Summary
In this chapter, standard VAD techniques as well as LR- and SLR-based VAD have been reviewed. Through performance evaluation of the standard VAD methods, including G.729B, GSM-EFR, AMR1, AMR2, and IS-127, it has been shown that both AMR1 and AMR2 produce relatively high and consistent performances over various noise sources and levels. On the other hand, statistical-model-based LR VAD, performs well but may have a problem at the offset regions of speech signals which may be solved with a hangover in the decision making. The SLR method newly-proposed by Cho [16, 17] has overcome this problem without the need for a hangover. SLR VAD has comparable performance to AMR2.
Bibliography
[1] ITU-T (1996) A silence compression scheme for G.729 optimised for terminals conforming to ITU-T V.70, ITU-T Rec. G.729 Annex B.
[2] ITU-T (1996) Dual rate speech coder for multimedia communications transmitting at 5.3 and 6.3 kbit/s. Annex A: Silence compression scheme, ITU-T Rec. G.723.1 Annex A.
[3] ITU-T (1996) Coding of speech at 8 kbit/s using conjugate-structure algebraic-code-excited linear prediction (CS-ACELP), ITU-T Rec. G.729.
[4] ITU-T (1996) Dual rate speech coder for multimedia communications transmitting at 5.3 and 6.3 kbit/s, ITU-T Rec. G.723.1.
[5] ETSI (1998) Digital cellular telecommunications system (phase 2+); Voice activity detector (VAD) for full rate speech traffic channels, GSM 06.32 (ETSI EN 300 965 v7.0.1).
[6] ETSI (1999) Digital cellular telecommunications system (phase 2+); Voice activity detector (VAD) for full rate speech traffic channels, GSM 06.42 (draft ETSI EN 300 973 v8.0.0).
[7] ETSI (1997) Digital cellular telecommunications system; Voice activity detector (VAD) for enhanced full rate (EFR) speech traffic channels, GSM 06.82 (ETS 300 730), March.
[8] ETSI (1998) Digital cellular telecommunications system (phase 2+); Voice activity detector (VAD) for adaptive multi-rate (AMR) speech traffic channels, GSM 06.94 v7.1.1 (ETSI EN 301 708).
[9] P. DeJaco, W. Gardner, and C. Lee (1993) ‘QCELP: The North American CDMA digital cellular variable rate speech coding standard’, in IEEE Workshop on Speech Coding for Telecom, pp. 5–6.
[10] TIA/EIA (1997) Enhanced variable rate codec, speech service option 3 for wideband spread spectrum digital systems, IS-127.
[11] TIA/EIA (1998) High rate speech service option 17 for wideband spread spectrum communication systems, IS-733.
[12] J. Sohn, N. S. Kim, and W. Sung (1999) ‘A statistical model-based voice activity detection’, in IEEE Signal Processing Letters, 6(1):1–3.
[13] Y. Ephraim and D. Malah (1984) ‘Speech enhancement using a minimum mean square error short-time spectral amplitude estimator’, in IEEE Trans. on Acoust., Speech and Signal Processing, 32(6):1109–20.
[14] Y. Ephraim and D. Malah (1985) ‘Speech enhancement using a minimum mean square error log-spectral amplitude estimator’, in IEEE Trans. on Acoust., Speech and Signal Processing, 33(2):443–5.
[15] O. Cappé (1994) ‘Elimination of musical noise phenomenon with the Ephraim and Malah noise suppression’, in IEEE Trans. Speech and Audio Processing, 2(2):345–9.
[16] Y. D. Cho (2001) ‘Speech detection enhancement and compression for voice communications’, Ph.D. thesis, CCSR, University of Surrey, UK.
[17] Y. Cho and A. M. Kondoz (2001) ‘Analysis and improvement of a statistical model-based voice activity detector’, in IEEE Signal Processing Letters, 8(10):276–8.
[18] J. Sohn and W. Sung (1995) ‘A voice activity detection employing soft decision based noise spectrum adaptation’, in Proc. of Int. Conf.on Acoust., Speech and Signal Processing, pp. 365–8. Amsterdam