
Often the pivotal factor in achieving development timetables comes down to one’s efficiency in finding and fixing bugs. Debugging inside the Linux kernel can be quite challenging. No matter how you approach it, kernel debugging will always be complex. This chapter examines some of the complexities and presents ideas and methods to improve your debugging skills inside the kernel and device drivers.
Debugging a modern operating system involves many challenges. Virtual memory operating systems present their own unique challenges. Gone are the days when we could replace a processor with an in-circuit emulator. Processors have become far too fast and complex. Moreover, pipeline architectures hide important code-execution details, partly because memory accesses on the bus can be ordered differently from code execution, and particularly because of internal caching of instruction streams. It is not always possible to correlate external bus activity to internal processor instruction execution, except at a rather coarse level.
Some of the challenges you will encounter while debugging Linux kernel code are:
Linux kernel code is highly optimized for speed of execution in many areas.
Compilers use optimization techniques that complicate the correlation of C source to actual machine instruction flow. Inline functions are a good example of this.
Single-stepping through compiler optimized code often produces unusual and unexpected results.
Virtual memory isolates user space memory from kernel memory and can make various debugging scenarios especially difficult.
Some code cannot be stepped through with traditional debuggers.
Startup code can be especially difficult because of its proximity to the hardware and the limited resources available (for example, no console, limited memory mapping, and so on).
The Linux kernel has matured into a very high-performance operating system capable of competing with the best commercial operating systems. Many areas within the kernel do not lend themselves to easy analysis by simply reading the source code. Knowledge of the architecture and detailed design are often necessary to understand the code flow in a particular area. Several good books are available that describe the kernel design in detail. Refer to Section 14.6.1, “Suggestions for Additional Reading,” for recommendations.
GCC is an optimizing compiler. By default, the Linux kernel is compiled with the -O2 compiler flag. This enables many optimization algorithms that can change the fundamental structure and order of your code.[1] For example, the Linux kernel makes heavy use of inline functions. Inline functions are small functions declared with the inline keyword, which results in the function being included directly in the execution thread instead of generating a function call and the associated overhead.[2] Inline functions require a minimum of -O1 optimization level. Therefore, you cannot turn off optimization, which would be desirable for easier debugging.
In many areas within the Linux kernel, single-stepping through code is difficult or impossible. The most obvious examples are code paths that modify the virtual memory settings. When your application makes a system call that results in entry into the kernel, this results in a change in address space as seen by the process. In fact, any transition that involves a processor exception changes the operational context and can be difficult or impossible to single-step through.
Two popular methods enable symbolic source-level debugging within the Linux kernel:
Using KGDB as a remote
gdbagentUsing a hardware JTAG probe to control the processor
We cover JTAG debugging in Section 14.4, “Hardware-Assisted Debugging.”
KGDB (Kernel GDB) is a set of Linux kernel patches that provide an interface to gdb via its remote serial protocol. KGDB implements a gdb stub that communicates to a cross-gdb running on your host development workstation. Until very recently, KGDB on the target required a serial connection to the development host. Some targets support KGDB connection via Ethernet, although this is relatively new. Complete support for KGDB is still not in the mainline kernel.org kernel. You need to port KGDB to your chosen target or obtain an embedded Linux distribution for your chosen architecture and platform that contains KGDB support. Most embedded Linux distributions available today support KGDB.
Figure 14-1 describes the KGDB debug setup. Up to three connections to the target board are used. Ethernet is used to enable NFS root mount and telnet sessions from the host. If your board has a ramdisk image in Flash that it mounts as a root file system, you can eliminate the Ethernet connection.
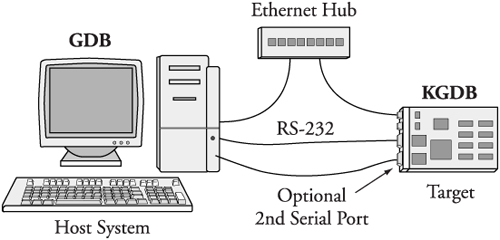
A serial port is dedicated for the connection between KGBD and gdb running on the development host system, and an optional second serial port serves as a console. Systems that have only one serial port make KGDB somewhat more cumbersome to use.
As you can see in Figure 14-1, the debugger (your cross-version of gdb) runs on your development host system. KGDB is part of the kernel running on your target system. KGDB implements the hooks required to interface gdb with your target board to enable features such as setting breakpoints, examining memory, and enabling single-step program execution.
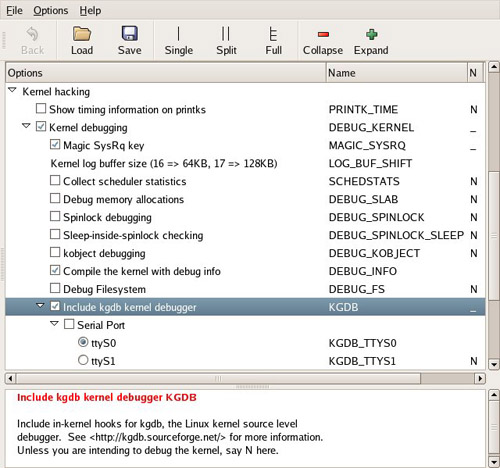
KGDB is a kernel feature and must be enabled in your kernel. KGDB is selected from the Kernel Hacking menu, as shown in Figure 14-2. As part of the configuration, you must select the serial port for KGDB to use. Notice also from Figure 14-2 that we enabled the option to compile the kernel with debug information. This adds the -g compiler flag to the build process to enable symbolic debugging.
After your kernel is built with KGDB support, it must be enabled. Unfortunately, the method to enable it is not yet uniform across all architectures and implementations. In general, KGDB is enabled by passing a command-line switch to the kernel via the kernel command line. If KGDB support is compiled into the kernel but not enabled via a command-line switch, it does nothing. When KGDB is enabled, the kernel stops at a KGDB-enabled breakpoint very early in the boot cycle to allow you to connect to the target using gdb. Figure 14-3 shows the logic for generating an initial breakpoint when KGDB is enabled.
KGDB requires a serial port for connection to the host.[3] The first step in setting up KGDB is to enable a serial port very early in the boot process. In many architectures, the hardware UART must be mapped into kernel memory before access. After the address range is mapped, the serial port is initialized. Debug trap handlers are installed to allow processor exceptions to trap into the debugger.
Listing 14-1 displays the terminal output when booting with KGDB enabled. This example is based on the AMCC 440EP Evaluation Kit (Yosemite board), which ships with the U-Boot bootloader.
Example 14-1. Booting with KGDB Enabled Using U-Boot
=> sete bootargs console=ttyS1,115200 root=/dev/nfs rw ip=dhcp gdb
=> bootm 200000
## Booting image at 00200000 ...
   Image Name:   Linux-2.6.13
   Image Type:   PowerPC Linux Kernel Image (gzip compressed)
   Data Size:    1064790 Bytes =  1 MB
   Load Address: 00000000
   Entry Point:  00000000
   Verifying Checksum ... OK
   Uncompressing Kernel Image ... OK
$T0440:c000ae5c;01:c0205fa0;#d9    <<< See text
Most of the boot sequence is familiar from our coverage of U-Boot in Chapter 7, “Bootloaders.” This kernel boot sequence has two unique features: the command-line parameter to enable KGDB and the odd-looking text string after the kernel is uncompressed.
Recall from Chapter 7 that the kernel command line is defined by the U-Boot bootargs environment variable. Notice that we have added the gdb parameter, which instructs the kernel to force an early breakpoint and wait for the host debugger (your cross-gdb) to connect.
As diagrammed in Figure 14-3, the kernel detects the presence of the gdb parameter and attempts to pass control to the remote (host-based) debugger. This is evidenced by the sequence of ASCII characters dumped to the serial port in Listing 14-1. If you are curious about this gdb remote serial protocol, it is documented in the gdb manual cited at the end of this chapter. In this example, KGDB is sending a Stop Reply packet reporting the breakpoint trap to the remote gdb session on the host. The two 32-bit parameters indicate the location of the program and the stack frame.
Now that the kernel is set up and waiting for the host debugger, we can begin our debugging session. We invoke cross-gdb from our host development workstation and connect to the target via gdb’s remote protocol. In this example, we are sharing the serial port, so we must disconnect the terminal emulator from the target before trying to connect with gdb. Listing 14-2 highlights the gdb connection process. This assumes that we have already exited our terminal emulator and freed the serial port for gdb to use.
Example 14-2. Connecting to KGDB
$ ppc_4xx-gdb --silent vmlinux
(gdb) target remote /dev/ttyS0
Remote debugging using /dev/ttyS0
breakinst () at arch/ppc/kernel/ppc-stub.c:825
825     }
(gdb) l
820                     return;
821             }
822
823             asm("   .globl breakinst

824                  breakinst: .long 0x7d821008");
825     }
826
827     #ifdef CONFIG_KGDB_CONSOLE
828     /* Output string in GDB O-packet format if GDB has connected.
If nothing
829        output, returns 0 (caller must then handle output). */
(gdb)
Here we have performed three actions:
Invoked
gdb, passing it the kernel ELF filevmlinuxConnected to the target using the
target remotecommand withingdbIssued the
listcommand, using its abbreviated form to display our location in the source code
At the risk of pointing out the obvious, the vmlinux image that we pass to gdb must be from the same kernel build that produced the target kernel binary. It also must have been compiled with the -g compiler flag to contain debug information.
When we issued the target remote command, gdb responded by displaying the location of the program counter (PC). In this example, the kernel is stopped at the breakpoint defined by the inline assembler statement at line 823 in file .../arch/ppc/kernel/ppc-stub.c. When we issue the continue (c) command, execution resumes starting at line 825, as indicated.
We have now established a debug connection with the kernel on our target board. When we issue the gdb continue (c) command, the kernel proceeds to boot, and if there are no problems, the boot process completes. There is one minor limitation of using KGDB on many architectures and processors. An engineering trade-off was made between the need to support very early kernel debugging (for example, before a full-blown interrupt-driven serial port driver is installed) and the desire to keep the complexity of the KGDB debug engine itself very simple and, therefore, robust and portable. KGDB uses a simple polled serial driver that has zero overhead when the kernel is running. As a drawback to this implementation, the traditional Ctl-C or Break sequence on the serial port will have no effect. Therefore, it will be impossible to stop execution of the running kernel unless a breakpoint or other fault is encountered.
For this reason, it has become common practice to define some system-wide breakpoints, which provide the capability to halt the current thread of execution. Two of the most common are highlighted in Listing 14-3.
Using the gdb breakpoint command, again using its abbreviated version, we enter two breakpoints. One is at panic() and the other is at the sync system call entry sys_sync(). The former allows the debugger to be invoked if a later event generates a panic. This enables examination of the system state at the time of the panic. The second is a useful way to halt the kernel and trap into the debugger from user space by entering the sync command from a terminal running on your target hardware.
We are now ready to proceed with our debugging session. We have a KGDB-enabled kernel running on our target, paused at a KGDB-defined early breakpoint. We established a connection to the target with our host-based cross debugger—in this case, invoked as ppc_4xx-gdb—and we have entered a pair of useful system breakpoints. Now we can direct our debugging activities to the task at hand.
One caveat: By definition, we cannot use KGDB for stepping through code before the breakpoint() function in .../arch/ppc/setup.c used to establish the connection between a KGDB-enabled kernel and cross-gdb on our host. Figure 14-3 is a rough guide to the code that executes before KGDB gains control. Debugging this early code requires the use of a hardware-assisted debug probe. We cover this topic shortly in Section 14.4, “Hardware-Assisted Debugging.”
One of the more common reasons you might find yourself stepping through kernel code is to modify or customize the platform-specific code for your custom board. Let’s see how this might be done using the AMCC Yosemite board. We place a breakpoint at the platform-specific architecture setup function and then continue until that breakpoint is encountered. Listing 14-4 shows the sequence.
Example 14-4. Debugging Architecture-Setup Code
(gdb) b yosemite_setup_arch
    Breakpoint 3 at 0xc021a488:
        file arch/ppc/platforms/4xx/yosemite.c, line 308.
(gdb) c
Continuing.
Can't send signals to this remote system.  SIGILL not sent.

Breakpoint 3, yosemite_setup_arch () at arch/ppc/platforms/4xx/yosemite.c:308
308             yosemite_set_emacdata();
(gdb) l
303     }
304
305     static void __init
306     yosemite_setup_arch(void)
307     {
308             yosemite_set_emacdata();
309
310             ibm440gx_get_clocks(&clocks, YOSEMITE_SYSCLK, 6 * 1843200);
311             ocp_sys_info.opb_bus_freq = clocks.opb;
312
(gdb)
When the breakpoint at yosemite_setup_arch() is encountered, control passes to gdb at line 308 of yosemite.c. The list (l) command displays the source listing centered on the breakpoint at line 308. The warning message displayed by gdb after the continue (c) command can be safely ignored.
It is part of gdb’s way of testing the capabilities of the remote system. It first sends a remote continue_with_signal command to the target. The KGDB implementation for this target board does not support this command; therefore, it is NAK’d by the target. gdb responds by displaying this informational message and issuing the standard remote continue command instead.
gdb includes a debug switch that enables us to observe the remote protocol being used between gdb on your development host and the target. This can be very useful for understanding the underlying protocol, as well as troubleshooting targets that exhibit unusual or errant behavior. To enable this debug mode, issue the following command:
(gdb) set debug remote 1With remote debugging enabled, it is instructive to observe the continue command in action and the steps taken by gdb. Listing 14-5 illustrates the use of the continue command with remote debugging enabled.
Example 14-5. continue Remote Protocol Example
(gdb) c
Continuing.
Sending packet: $mc0000000,4#80...Ack
Packet received: c022d200
Sending packet: $Mc0000000,4:7d821008#68...Ack
Packet received: OK
Sending packet: $mc0016de8,4#f8...Ack
Packet received: 38600001
Sending packet: $Mc0016de8,4:7d821008#e0...Ack
Packet received: OK
Sending packet: $mc005bd5c,4#23...Ack
Packet received: 38600001
Sending packet: $Mc005bd5c,4:7d821008#0b...Ack
Packet received: OK
Sending packet: $mc021a488,4#c8...Ack
Packet received: 4bfffbad
Sending packet: $Mc021a488,4:7d821008#b0...Ack
Packet received: OK
Sending packet: $c#63...Ack
    <<< program running, gdb waiting for event
Although it might look daunting at first, what is happening here is easily understood. In summary, gdb is restoring all its breakpoints on the target. Recall from Listing 14-3 that we entered two breakpoints, one at panic() and one at sys_sync(). Later in Listing 14-4, we added a third breakpoint at yosemite_setup_arch(). Thus, there are three active user-specified breakpoints. These can be displayed by issuing the gdb info breakpoints command. As usual, we use the abbreviated version.
(gdb) i b
Num Type           Disp Enb Address    What
1   breakpoint     keep y   0xc0016de8 in panic at kernel/panic.c:74
2   breakpoint     keep y   0xc005bd5c in sys_sync at fs/buffer.c:296
3   breakpoint     keep y   0xc021a488 in yosemite_setup_arch at
arch/ppc/platforms/4xx/yosemite.c:308
        breakpoint already hit 1 time
(gdb)
Now compare the previous breakpoint addresses with the addresses in the gdb remote $m packet in Listing 14-5. The $m packet is a “read target memory” command, and the $M packet is a “write target memory” command. Once for each breakpoint, the address of the breakpoint is read from target memory, stored away locally on the host by gdb (so it can be restored later), and replaced with the PowerPC trap instruction twge r2, r2 (0x7d821008), which results in control passing back to the debugger. Figure 14-4 illustrates this action.
You might have noticed that gdb is updating four breakpoints, whereas we entered only three. The first one at target memory location 0xc000_0000 is put there by gdb automatically upon startup. This location is the base address of the linked kernel image from the ELF file—essentially, _start. It is equivalent to a breakpoint at main() for user space debugging and is done by gdb automatically. The other three breakpoints are the ones we entered earlier.
The same thing happens in reverse when an event occurs that returns control to gdb. Listing 14-6 details the action when our breakpoint at yosemite_setup_arch() is encountered.
Example 14-6. Remote Protocol: Breakpoint Hit
Packet received: T0440:c021a488;01:c020ff90;
Sending packet: $mc0000000,4#80...Ack  <<< Read memory @c0000000
Packet received: 7d821008
Sending packet: $Mc0000000,4:c022d200#87...Ack  <<< Write memory
Packet received: OK
Sending packet: $mc0016de8,4#f8...Ack
Packet received: 7d821008
Sending packet: $Mc0016de8,4:38600001#a4...Ack
Packet received: OK
Sending packet: $mc005bd5c,4#23...Ack
Packet received: 7d821008
Sending packet: $Mc005bd5c,4:38600001#cf...Ack
Packet received: OK
Sending packet: $mc021a488,4#c8...Ack
Packet received: 7d821008
Sending packet: $Mc021a488,4:4bfffbad#d1...Ack
Packet received: OK

Sending packet: $mc021a484,c#f3...Ack
Packet received: 900100244bfffbad3fa0c022
Breakpoint 3, yosemite_setup_arch () at arch/ppc/platforms/4xx/yosemite.c:308
308             yosemite_set_emacdata();
(gdb)
The $T packet is a gdb Stop Reply packet. It is sent by the target to gdb when a breakpoint is encountered. In our example, the $T packet returned the value of the program counter and register r1.[4] The rest of the activity is the reverse of that in Listing 14-5. The PowerPC trap breakpoint instructions are removed, and gdb restores the original instructions to their respective memory locations.
At the start of this chapter, we said that one of the challenges identified in debugging kernel code results from compiler optimization. We noted that the Linux kernel is compiled by default with optimization level -O2. In the examples up to this point, we used -O1 optimization to simplify the debugging task. Here we illustrate one of the many ways optimization can complicate debugging.
The related Internet mail lists are strewn with questions related to what appear to be broken tools. Sometimes the poster reports that his debugger is single-stepping backward or that his line numbers do not line up with his source code. Here we present an example to illustrate the complexities that optimizing compilers bring to source-level debugging. In this example, the line numbers that gdb reports when a breakpoint is hit do not match up with the line numbers in our source file due to function inlining.
For this demonstration, we use the same debug code snippet as shown in Listing 14-4. However, for this example, we have compiled the kernel with the compiler optimization flag -O2. This is the default for the Linux kernel. Listing 14-7 shows the results of this debugging session.
Example 14-7. Optimized Architecture-Setup Code
$ ppc_44x-gdb --silent vmlinux
(gdb) target remote /dev/ttyS0
Remote debugging using /dev/ttyS0
breakinst () at arch/ppc/kernel/ppc-stub.c:825
825     }
(gdb) b panic
Breakpoint 1 at 0xc0016b18: file kernel/panic.c, line 74.
(gdb) b sys_sync
Breakpoint 2 at 0xc005a8c8: file fs/buffer.c, line 296.
(gdb) b yosemite_setup_arch
Breakpoint 3 at 0xc020f438: file arch/ppc/platforms/4xx/yosemite.c, line 116.
(gdb) c
Continuing.

Breakpoint 3, yosemite_setup_arch ()
    at arch/ppc/platforms/4xx/yosemite.c:116
116             def = ocp_get_one_device(OCP_VENDOR_IBM, OCP_FUNC_EMAC, 0);
(gdb) l
111             struct ocp_def *def;
112             struct ocp_func_emac_data *emacdata;
113
114             /* Set mac_addr and phy mode for each EMAC */
115
116             def = ocp_get_one_device(OCP_VENDOR_IBM, OCP_FUNC_EMAC, 0);
117             emacdata = def->additions;
118             memcpy(emacdata->mac_addr, __res.bi_enetaddr, 6);
119             emacdata->phy_mode = PHY_MODE_RMII;
120
(gdb) p yosemite_setup_arch
$1 = {void (void)} 0xc020f41c <yosemite_setup_arch>
Referring back to Listing 14-4, notice that the function yosemite_setup_arch() actually falls on line 306 of the file yosemite.c. Compare that with Listing 14-7. We hit the breakpoint, but gdb reports the breakpoint at file yosemite.c line 116. It appears at first glance to be a mismatch of line numbers between the debugger and the corresponding source code. Is this a gdb bug? First let’s confirm what the compiler produced for debug information. Using the readelf[5] tool described in Chapter 13, “Development Tools,” we can examine the debug information for this function produced by the compiler.
$ ppc_44x-readelf --debug-dump=info vmlinux | grep -u6
  yosemite_setup_arch | tail -n 7
    DW_AT_name        : (indirect string, offset: 0x9c04): yosemite_setup_arch
    DW_AT_decl_file   : 1
    DW_AT_decl_line   : 307
       DW_AT_prototyped  : 1
    DW_AT_low_pc      : 0xc020f41c
    DW_AT_high_pc     : 0xc020f794
    DW_AT_frame_base  : 1 byte block: 51       (DW_OP_reg1)
We don’t have to be experts at reading DWARF2 debug records[6] to recognize that the function in question is reported at line 307 in our source file. We can confirm this using the addr2line utility, also introduced in Chapter 13. Using the address derived from gdb in Listing 14-7:
$ ppc_44x-addr2line  -e vmlinux 0xc020f41c
    arch/ppc/platforms/4xx/yosemite.c:307
At this point, gdb is reporting our breakpoint at line 116 of the yosemite.c file. To understand what is happening, we need to look at the assembler output of the function as reported by gdb. Listing 14-8 is the output from gdb after issuing the disassemble command on the yosemite_setup_arch() function.
Example 14-8. Disassemble Function yosemite_setup_arch
(gdb) disassemble yosemite_setup_arch
0xc020f41c <yosemite_setup_arch+0>:     mflr    r0
0xc020f420 <yosemite_setup_arch+4>:     stwu    r1,-48(r1)
0xc020f424 <yosemite_setup_arch+8>:     li      r4,512
0xc020f428 <yosemite_setup_arch+12>:    li      r5,0
0xc020f42c <yosemite_setup_arch+16>:    li      r3,4116
0xc020f430 <yosemite_setup_arch+20>:    stmw    r25,20(r1)
0xc020f434 <yosemite_setup_arch+24>:    stw     r0,52(r1)
0xc020f438 <yosemite_setup_arch+28>:    bl      0xc000d344
<ocp_get_one_device>
0xc020f43c <yosemite_setup_arch+32>:    lwz     r31,32(r3)
0xc020f440 <yosemite_setup_arch+36>:    lis     r4,-16350
0xc020f444 <yosemite_setup_arch+40>:    li      r28,2
0xc020f448 <yosemite_setup_arch+44>:    addi    r4,r4,21460
0xc020f44c <yosemite_setup_arch+48>:    li      r5,6
0xc020f450 <yosemite_setup_arch+52>:    lis     r29,-16350
0xc020f454 <yosemite_setup_arch+56>:    addi    r3,r31,48
0xc020f458 <yosemite_setup_arch+60>:    lis     r25,-16350
0xc020f45c <yosemite_setup_arch+64>:    bl      0xc000c708
<memcpy>
0xc020f460 <yosemite_setup_arch+68>:    stw     r28,44(r31)
0xc020f464 <yosemite_setup_arch+72>:    li      r4,512
0xc020f468 <yosemite_setup_arch+76>:    li      r5,1
0xc020f46c <yosemite_setup_arch+80>:    li      r3,4116
0xc020f470 <yosemite_setup_arch+84>:    addi    r26,r25,15104
0xc020f474 <yosemite_setup_arch+88>:    bl      0xc000d344
<ocp_get_one_device>
0xc020f478 <yosemite_setup_arch+92>:    lis     r4,-16350
0xc020f47c <yosemite_setup_arch+96>:    lwz     r31,32(r3)
0xc020f480 <yosemite_setup_arch+100>:   addi    r4,r4,21534
0xc020f484 <yosemite_setup_arch+104>:   li      r5,6
0xc020f488 <yosemite_setup_arch+108>:   addi    r3,r31,48
0xc020f48c <yosemite_setup_arch+112>:   bl      0xc000c708
<memcpy>
0xc020f490 <yosemite_setup_arch+116>:   lis     r4,1017
0xc020f494 <yosemite_setup_arch+120>:   lis     r5,168
0xc020f498 <yosemite_setup_arch+124>:   stw     r28,44(r31)
0xc020f49c <yosemite_setup_arch+128>:   ori     r4,r4,16554
0xc020f4a0 <yosemite_setup_arch+132>:   ori     r5,r5,49152
0xc020f4a4 <yosemite_setup_arch+136>:   addi    r3,r29,-15380
0xc020f4a8 <yosemite_setup_arch+140>:   addi    r29,r29,-15380
0xc020f4ac <yosemite_setup_arch+144>:   bl      0xc020e338
<ibm440gx_get_clocks>
0xc020f4b0 <yosemite_setup_arch+148>:   li      r0,0
0xc020f4b4 <yosemite_setup_arch+152>:   lis     r11,-16352
0xc020f4b8 <yosemite_setup_arch+156>:   ori     r0,r0,50000
0xc020f4bc <yosemite_setup_arch+160>:   lwz     r10,12(r29)
0xc020f4c0 <yosemite_setup_arch+164>:   lis     r9,-16352
0xc020f4c4 <yosemite_setup_arch+168>:   stw     r0,8068(r11)
0xc020f4c8 <yosemite_setup_arch+172>:   lwz     r0,84(r26)
0xc020f4cc <yosemite_setup_arch+176>:   stw     r10,8136(r9)
0xc020f4d0 <yosemite_setup_arch+180>:   mtctr   r0
0xc020f4d4 <yosemite_setup_arch+184>:   bctrl
0xc020f4d8 <yosemite_setup_arch+188>:   li      r5,64
0xc020f4dc <yosemite_setup_arch+192>:   mr      r31,r3
0xc020f4e0 <yosemite_setup_arch+196>:   lis     r4,-4288
0xc020f4e4 <yosemite_setup_arch+200>:   li      r3,0
0xc020f4e8 <yosemite_setup_arch+204>:   bl      0xc000c0f8
<ioremap64>
End of assembler dump.
(gdb)
Once again, we need not be PowerPC assembly language experts to understand what is happening here. Notice the labels associated with the PowerPC bl instruction. This is a function call in PowerPC mnemonics. The symbolic function labels are the important data points. After a cursory analysis, we see several function calls near the start of this assembler listing:
Address | Function |
|---|---|
|
|
|
|
|
|
|
|
|
|
Listing 14-9 reproduces portions of the source file yosemite.c. Correlating the functions we found in the gdb disassemble output, we see those labels occurring in the function yosemite_set_emacdata(), around the line numbers reported by gdb when the breakpoint at yosemite_setup_arch() was encountered. The key to understanding the anomaly is to notice the subroutine call at the very start of yosemite_setup_arch(). The compiler has inlined the call to yosemite_set_emacdata() instead of generating a function call, as would be expected by simple inspection of the source code. This inlining produced the mismatch in the line numbers when gdb hit the breakpoint. Even though the yosemite_set_emacdata() function was not declared using the inline keyword, GCC inlined the function as a performance optimization.
Example 14-9. Portions of Source File yosemite.c
109 static void __init yosemite_set_emacdata(void)
110 {
111         struct ocp_def *def;
112         struct ocp_func_emac_data *emacdata;
113
114         /* Set mac_addr and phy mode for each EMAC */
115
116         def = ocp_get_one_device(OCP_VENDOR_IBM, OCP_FUNC_EMAC, 0);
117         emacdata = def->additions;
118         memcpy(emacdata->mac_addr, __res.bi_enetaddr, 6);
119         emacdata->phy_mode = PHY_MODE_RMII;
120
121         def = ocp_get_one_device(OCP_VENDOR_IBM, OCP_FUNC_EMAC, 1);
122         emacdata = def->additions;
123         memcpy(emacdata->mac_addr, __res.bi_enet1addr, 6);
124         emacdata->phy_mode = PHY_MODE_RMII;
125 }
126
...
304
305 static void __init
306 yosemite_setup_arch(void)
307 {
308         yosemite_set_emacdata();
309
310         ibm440gx_get_clocks(&clocks, YOSEMITE_SYSCLK, 6 * 1843200);
311         ocp_sys_info.opb_bus_freq = clocks.opb;
312
313         /* init to some ~sane value until calibrate_delay() runs */
314         loops_per_jiffy = 50000000/HZ;
315
316         /* Setup PCI host bridge */
317         yosemite_setup_hose();
318
319 #ifdef CONFIG_BLK_DEV_INITRD
320        if (initrd_start)
321               ROOT_DEV = Root_RAM0;
322         else
323 #endif
324 #ifdef CONFIG_ROOT_NFS
325                 ROOT_DEV = Root_NFS;
326 #else
327                 ROOT_DEV = Root_HDA1;
328 #endif
329
330         yosemite_early_serial_map();
331
332         /* Identify the system */
333         printk( "AMCC PowerPC " BOARDNAME " Platform
" );
334 }
335
To summarize the previous discussion:
We entered a breakpoint in
gdbatyosemite_setup_arch().When the breakpoint was hit, we found ourselves at line 116 of the source file, which was far removed from the function where we defined the breakpoint.
We produced a disassembly listing of the code at
yosemite_setup_arch()and discovered the labels to which this sequence of code was branching.Comparing the labels back to our source code, we discovered that the compiler had placed the
yosemite_set_emacdata()subroutine inline with the function where we entered a breakpoint, causing potential confusion.
This explains the line numbers reported by gdb when the original breakpoint in yosemite_setup_arch() was hit.
Compilers employ many different kinds of optimization algorithms. This example presented but one: function inlining. Each can confuse a debugger (the human and the machine) in a different way. The challenge is to understand what is happening at the machine level and translate that into what we as developers had intended. You can see now the benefits of using the minimum possible optimization level for debugging.
You might already realize that gdb looks for an initialization file on startup, called .gdbinit. When first invoked, gdb loads this initialization file (usually found in the user’s home directory) and acts on the commands within it. One of my favorite combinations is to connect to the target system and set initial breakpoints. In this case, the contents of .gdbinit would look like Listing 14-10.
This simple .gdbinit file enables the storing of command history in a user-specified file and sets the default output radix for printing of values. Then it defines a gdb user-defined command called connect. (User-defined commands are also often called macros.) When issued at the gdb command prompt, gdb connects to the target system via the desired method and sets the system breakpoints at panic() and sys_sync(). One method is commented out; we discuss this method shortly in Section 14.4.
There is no end to the creative use of gdb user-defined commands. When debugging in the kernel, it is often useful to examine global data structures such as task lists and memory maps. Here we present several useful gdb user-defined commands capable of displaying specific kernel data that you might need to access during your kernel debugging.
During kernel debugging, it is often useful to view the processes that are running on the system, as well as some common attributes of those processes. The kernel maintains a linked list of tasks described by struct task_struct. The address of the first task in the list is contained in the kernel global variable init_task, which represents the initial task spawned by the kernel during startup. Each task contains a struct list_head, which links the tasks in a circular linked list. These two ubiquitous kernel structures are described in the following header files:
struct task_struct            .../include/linux/sched.h
struct list_head              .../include/linux/list.h
Using gdb macros, we can traverse the task list and display useful information about the tasks. It is easy to modify the macros to extract the data you might be interested in. It is also a very useful tool for learning the details of kernel internals.
The first macro we examine is a simple one that searches the kernel’s linked list of task_struct structures until it finds the given task. If it is found, it displays the name of the task.
Example 14-11. gdb find_task Macro
 1 # Helper function to find a task given a PID or the
 2 # address of a task_struct.
 3 # The result is set into $t
 4 define find_task
 5   # Addresses greater than _end: kernel data...
 6   # ...user passed in an address
 7   if ((unsigned)$arg0 > (unsigned)&_end)
 8     set $t=(struct task_struct *)$arg0
 9   else
10     # User entered a numeric PID
11     # Walk the task list to find it
12     set $t=&init_task
13     if (init_task.pid != (unsigned)$arg0)
14       find_next_task $t
15       while (&init_task!=$t && $t->pid != (unsigned)$arg0)
16         find_next_task $t
17       end
18       if ($t == &init_task)
19         printf "Couldn't find task; using init_task
"
20       end
21     end
22   end
23   printf "Task "%s":
", $t->comm
24 end
Place this text into your .gdbinit file and restart gdb, or source[7] it using gdb's source command. (We explain the find_next_task macro later in Listing 14-15.) Invoke it as follows:
(gdb) find_task 910
   Task "syslogd":
or
(gdb) find_task 0xCFFDE470
   Task "bash":
Line 4 defines the macro name. Line 7 decides whether the input argument is a PID (numeric entry starting at zero and limited to a few million) or a task_struct address that must be greater than the end of the Linux kernel image itself, defined by the symbol _end.[8] If it’s an address, the only action required is to cast it to the proper type to enable dereferencing the associated task_struct. This is done at line 8. As the comment in line 3 states, this macro returns a gdb convenience variable typecasted to a pointer to a struct task_struct.
If the input argument is a numeric PID, the list is traversed to find the matching task_struct. Lines 12 and 13 initialize the loop variables (gdb does not have a for statement in its macro command language), and lines 15 through 17 define the search loop. The find_next_task macro is used to extract the pointer to the next task_struct in the linked list. Finally, if the search fails, a sane return value is set (the address of init_task) so that it can be safely used in other macros.
Building on the find_task macro in Listing 14-11, we can easily create a simple ps command that displays useful information about each process running on the system.
Listing 14-12 defines a gdb macro that displays interesting information from a running process, extracted from the struct task_struct for the given process. It is invoked like any other gdb command, by typing its name followed by any required input parameters. Notice that this user-defined command requires a single argument, either a PID or the address of a task_struct.
Example 14-12. gdb Macro: Print Process Information
 1 define ps
 2   # Print column headers
 3   task_struct_header
 4   set $t=&init_task
 5   task_struct_show $t
 6   find_next_task $t
 7   # Walk the list
 8   while &init_task!=$t
 9     # Display useful info about each task
10     task_struct_show $t
11     find_next_task $t
12   end
13 end
14
15 document ps
16 Print points of interest for all tasks
17 end
This ps macro is similar to the find_task macro, except that it requires no input arguments and it adds a macro (task_struct_show) to display the useful information from each task_struct. Line 3 prints a banner line with column headings. Lines 4 through 6 set up the loop and display the first task. Lines 8 through 11 loop through each task, calling the task_struct_show macro for each.
Notice also the inclusion of the gdb document command. This allows the gdb user to get help by issuing the help ps command from the gdb command prompt as follows:
(gdb) help ps
   Print points of interest for all tasks
Listing 14-13 displays the output of this macro on a target board running only minimal services.
Example 14-13. gdb ps Macro Output
(gdb) ps
Address      PID State      User_NIP  Kernel-SP  device comm
0xC01D3750     0 Running              0xC0205E90 (none) swapper
0xC04ACB10     1 Sleeping  0x0FF6E85C 0xC04FFCE0 (none) init
0xC04AC770     2 Sleeping             0xC0501E90 (none) ksoftirqd/0
0xC04AC3D0     3 Sleeping             0xC0531E30 (none) events/0
0xC04AC030     4 Sleeping             0xC0533E30 (none) khelper
0xC04CDB30     5 Sleeping             0xC0535E30 (none) kthread
0xC04CD790    23 Sleeping             0xC06FBE30 (none) kblockd/0
0xC04CD3F0    45 Sleeping             0xC06FDE50 (none) pdflush
0xC04CD050    46 Sleeping             0xC06FFE50 (none) pdflush
0xC054B7B0    48 Sleeping             0xC0703E30 (none) aio/0
0xC054BB50    47 Sleeping             0xC0701E20 (none) kswapd0
0xC054B410   629 Sleeping             0xC0781E60 (none) kseriod
0xC054B070   663 Sleeping             0xCFC59E30 (none) rpciod/0
0xCFFDE0D0   675 Sleeping  0x0FF6E85C 0xCF86DCE0 (none) udevd
0xCF95B110   879 Sleeping  0x0FF0BE58 0xCF517D80 (none) portmap
0xCFC24090   910 Sleeping  0x0FF6E85C 0xCF61BCE0 (none) syslogd
0xCF804490   918 Sleeping  0x0FF66C7C 0xCF65DD70 (none) klogd
0xCFE350B0   948 Sleeping  0x0FF0E85C 0xCF67DCE0 (none) rpc.statd
0xCFFDE810   960 Sleeping  0x0FF6E85C 0xCF5C7CE0 (none) inetd
0xCFC24B70   964 Sleeping  0x0FEEBEAC 0xCF64FD80 (none) mvltd
0xCFE35B90   973 Sleeping  0x0FF66C7C 0xCFEF7CE0 ttyS1  getty
0xCFE357F0   974 Sleeping  0x0FF4B85C 0xCF6EBCE0 (none) in.telnetd
0xCFFDE470   979 Sleeping  0x0FEB6950 0xCF675DB0 ttyp0  bash
0xCFFDEBB0   982<Running   0x0FF6EB6C 0xCF7C3870 ttyp0  sync
(gdb)
The bulk of the work done by this ps macro is performed by the task_struct_show macro. As shown in Listing 14-13, the task_struct_show macro displays the following fields from each task_struct:
Address—Address of thetask_structfor the processPID—Process IDState—Current state of the processUser_NIP—Userspace Next Instruction PointerKernel_SP—Kernel Stack Pointerdevice—Device associated with this processcomm—Name of the process (or command)
It is relatively easy to modify the macro to show the items of interest for your particular kernel debugging task. The only complexity is in the simplicity of the macro language. Because function equivalents such as strlen do not exist in gdb’s user-defined command language, screen formatting must be done by hand.
Listing 14-14 reproduces the task_struct_show macro that produced the previous listing.
Example 14-14. gdb task_struct_show Macro
 1 define task_struct_show
 2   # task_struct addr and PID
 3   printf "0x%08X %5d", $arg0, $arg0->pid
 4
 5   # Place a '<' marker on the current task
 6   #  if ($arg0 == current)
 7   # For PowerPC, register r2 points to the "current" task
 8   if ($arg0 == $r2)
 9     printf "<"
10   else
11     printf " "
12   end
13
14   # State
15   if ($arg0->state == 0)
16     printf "Running   "
17   else
18     if ($arg0->state == 1)
19       printf "Sleeping  "
20     else
21       if ($arg0->state == 2)
22         printf "Disksleep "
23       else
24         if ($arg0->state == 4)
25           printf "Zombie    "
26         else
27           if ($arg0->state == 8)
28             printf "sTopped   "
29           else
30             if ($arg0->state == 16)
31               printf "Wpaging   "
32             else
33               printf "%2d        ", $arg0->state
34             end
35           end
36         end
37       end
38     end
39   end
40
41   # User NIP
42   if ($arg0->thread.regs)
43     printf "0x%08X ", $arg0->thread.regs->nip
44   else
45     printf "           "
46   end
47
48   # Display the kernel stack pointer
49   printf "0x%08X ", $arg0->thread.ksp
50
51   # device
52   if ($arg0->signal->tty)
53     printf "%s   ", $arg0->signal->tty->name
54   else
55     printf "(none) "
56   end
57
58   # comm
59   printf "%s
", $arg0->comm
60 end
Line 3 displays the address of the task_struct. Lines 8 through 12 display the process ID. If this is the current process (the process that was currently running on this CPU at the time the breakpoint was hit), it is marked with a < character.
Lines 14 through 39 decode and display the state of the process. This is followed by displaying the user process next instruction pointer (NIP) and the kernel stack pointer (SP). Finally, the device associated with the process is displayed, followed by the name of the process (stored in the ->comm element of the task_struct.)
It is important to note that this macro is architecture dependent, as shown in lines 7 and 8. In general, macros such as these are highly architecture- and version-dependent. Any time a change in the underlying structure is made, macros such as these must be updated. However, if you spend a lot of time debugging the kernel using gdb, the payback is often worth the effort.
For completeness, we present the find_next_task macro. Its implementation is less than obvious and deserves explanation. (It is assumed that you can easily deduce the task_struct_header that completes the series necessary for the ps macro presented in this section. It is nothing more than a single line arranging the column headers with the correct amount of whitespace.) Listing 14-15 presents the find_next_task macro used in our ps and find_task macros.
The function performed by this macro is simple. The implementation is slightly less than straightforward. The goal is to return the ->next pointer, which points to the next task_struct on the linked list. However, the task_struct structures are linked by the address of the struct list_head member called tasks, as opposed to the common practice of being linked by the starting address of the task_struct itself. Because the ->next pointer points to the address of the task structure element in the next task_struct on the list, we must subtract to get the address of the top of the task_struct itself. The value we subtract from the ->next pointer is the offset from that pointer’s address to the top of task_struct. First we calculate the offset and then we use that offset to adjust the ->next pointer to point to the top of task_struct. Figure 14-5 should make this clear.
Now we present one final macro that will be useful in the next section when we discuss debugging loadable modules. Listing 14-16 is a simple macro that displays the kernel’s list of currently installed loadable modules.
Example 14-16. gdb List Modules Macro
 1 define lsmod
 2   printf "Address		Module
"
 3   set $m=(struct list_head *)&modules
 4   set $done=0
 5   while ( !$done )
 6     # list_head is 4-bytes into struct module
 7     set $mp=(struct module *)((char *)$m->next - (char *)4)
 8     printf "0x%08X	%s
", $mp, $mp->name
 9     if ( $mp->list->next == &modules)
10       set $done=1
11     end
12     set $m=$m->next
13   end
14 end
15
16 document lsmod
17 List the loaded kernel modules and their start addresses
18 end
This simple loop starts with the kernel’s global variable module. This variable is a struct list_head that marks the start of the linked list of loadable modules. The only complexity is the same as that described in Listing 14-15. We must subtract an offset from the struct list_head pointer to point to the top of the struct module. This is performed in line 7. This macro produces a simple listing of modules containing the address of the struct module and the module’s name. Here is an example of its use:
(gdb) lsmod
Address         Module
0xD1012A80      ip_conntrack_tftp
0xD10105A0      ip_conntrack
0xD102F9A0      loop
(gdb) help lsmod
List the loaded kernel modules and their start addresses
(gdb)
Macros such as the ones presented here are very powerful debugging aids. You can create macros in a similar fashion to display anything in the kernel that lends itself to easy access, especially the major data structures maintained as linked lists. Examples include process memory map information, module information, file system information, and timer lists and so on. The information presented here should get you started.
The most common reason for using KGDB is to debug loadable kernel modules, that is, device drivers. One of the more convenient features of loadable modules is that, under most circumstances, it is not necessary to reboot the kernel for each new debugging session. You can start a debugging session, make some changes, recompile, and reload the module without the hassle and delay of a complete kernel reboot.
The complication associated with debugging loadable modules is in gaining access to the symbolic debug information contained in the module’s object file. Because loadable modules are dynamically linked when they are loaded into the kernel, the symbolic information contained in the object file is useless until the symbol table is adjusted.
Recall from our earlier examples how we invoke gdb for a kernel debugging session:
$ ppc_4xx-gdb vmlinuxThis launches a gdb debugging session on your host, and reads the symbol information from the Linux kernel ELF file vmlinux. Of course, you will not find symbols for any loadable modules in this file. Loadable modules are separate compilation units and are linked as individual standalone ELF objects. Therefore, if we intend to perform any source-level debugging on a loadable module, we need to load its debug symbols from the ELF file. gdb provides this capability in its add-symbol-file command.
The add-symbol-file command loads symbols from the specified object file, assuming that the module itself has already been loaded. However, we are faced with the chicken-and-egg syndrome. We don’t have any symbol information until the loadable module has been loaded into the kernel and the add-symbol-file command is issued to read in the module’s symbol information. However, after the module has been loaded, it is too late to set breakpoints and debug the module’s *_init and related functions because they have already executed.
The solution to this dilemma is to place a breakpoint in the kernel code that is responsible for loading the module, after it has been linked but before its initialization function has been called. This work is done by .../kernel/module.c. Listing 14-17 reproduces the relevant portions of module.c.
Example 14-17. module.c: Module Initialization
...
1901 down(¬ify_mutex);
1902 notifier_call_chain(&module_notify_list, MODULE_STATE_COMING, mod);
1903 up(¬ify_mutex);
1904
1905 /* Start the module */
1906 if (mod->init != NULL)
1907 ret = mod->init();
1908 if (ret < 0) {
1909 /* Init routine failed: abort. Try to protect us from
1910 buggy refcounters. */
1911 mod->state = MODULE_STATE_GOING;
...We load the module using the modprobe utility, which was demonstrated in Listing 8-5 in Chapter 8, “Device Driver Basics,” and looks like this:
$ modprobe loopThis command issues a special system call that directs the kernel to load the module. The module loading begins at sys_init_module() in module.c. After the module has been loaded into kernel memory and dynamically linked, control is passed to the module’s _init function. This is shown in lines 1906 and 1907 of Listing 14-17. We place our breakpoint here. This enables us to add the symbol file to gdb and subsequently set breakpoints in the module. We demonstrate this process using the Linux kernel’s loopback driver called loop.ko. This module has no dependencies on other modules and is reasonably easy to demonstrate.
Listing 14-18 shows the gdb commands to initiate this debugging session on loop.ko.
Example 14-18. Initiate Module Debug Session: loop.ko
 1 $ ppc-linux-gdb --silent vmlinux
 2 (gdb) connect
 3 breakinst () at arch/ppc/kernel/ppc-stub.c:825
 4 825     }
 5 Breakpoint 1 at 0xc0016b18: file kernel/panic.c, line 74.
 6 Breakpoint 2 at 0xc005a8c8: file fs/buffer.c, line 296.
 7 (gdb) b module.c:1907
 8 Breakpoint 3 at 0xc003430c: file kernel/module.c, line 1907.
 9 (gdb) c
10 Continuing.
11 >>>> Here we let the kernel finish booting
12      and then load the loop.ko module on the target
13
14 Breakpoint 3, sys_init_module (umod=0x30029000, len=0x2473e,
15     uargs=0x10016338 "") at kernel/module.c:1907
16 1907                    ret = mod->init();
17 (gdb) lsmod
18 Address         Module
19 0xD102F9A0      loop
20 (gdb) set $m=(struct module *)0xD102F9A0.
21 (gdb) p $m->module_core
22 $1 = (void *) 0xd102c000
23 (gdb) add-symbol-file ./drivers/block/loop.ko 0xd102c000
24 add symbol table from file "./drivers/block/loop.ko" at
25         .text_addr = 0xd102c000
26 (y or n) y
27 Reading symbols from /home/chris/sandbox/linux-2.6.13-amcc/
drivers/block        /loop.ko...done.
Starting with line 2, we use the gdb user-defined macro connect created earlier in Listing 14-10 to connect to the target board and set our initial breakpoints. We then add the breakpoint in module.c, as shown in line 7, and we issue the continue command (c). Now the kernel completes the boot process and we establish a telnet session into the target and load the loop.ko module (not shown). When the loopback module is loaded, we immediately hit breakpoint #3. gdb then displays the information shown in lines 14 through 16.
At this point, we need to discover the address where the Linux kernel linked our module’s .text section. Linux stores this address in the module information structure struct module in the module_core element. Using the lsmod macro we defined in Listing 14-16, we obtain the address of the struct module associated with our loop.ko module. This is shown in lines 17 through 19. Now we use this structure address to obtain the module’s .text address from the module_core structure member. We pass this address to the gdb add-symbol-file command, and gdb uses this address to adjust its internal symbol table to match the actual addresses where the module was linked into the kernel. From there, we can proceed in the usual manner to set breakpoints in the module, step through code, examine data, and so on.
We conclude this section with a demonstration of placing a breakpoint in the loopback module’s initialization function so that we can step through the module’s initialization code. The complication here is that the kernel loads the module’s initialization code into a separately allocated portion of memory so that it can be freed after use. Recall from Chapter 5, “Kernel Initialization,” our discussion of the __init macro. This macro expands into a compiler attribute that directs the linker to place the marked portion of code into a specially named ELF section. In essence, any function defined with this attribute is placed in a separate ELF section named .init.text. Its use is similar to the following:
static int __init loop_init(void){...}This invocation would place the compiled loop_init() function into the .init.text section of the loop.ko object module. When the module is loaded, the kernel allocates a chunk of memory for the main body of the module, which is pointed to by the struct module member named module_core. It then allocates a separate chunk of memory to hold the .init.text section. After the initialization function is called, the kernel frees the memory that contained the initialization function. Because the object module is split like this, we need to inform gdb of this addressing scheme to be able to use symbolic data for debugging the initialization function.[9] Listing 14-19 demonstrates these steps.
Example 14-19. Debugging Module init Code
$ ppc_4xx-gdb -slient vmlinux
(gdb) target remote /dev/ttyS0
Remote debugging using /dev/ttyS0
breakinst () at arch/ppc/kernel/ppc-stub.c:825
825     }

<< Place a breakpoint before calling module init >>
(gdb) b module.c:1907

Breakpoint 1 at 0xc0036418: file kernel/module.c, line 1907.
(gdb) c
Continuing.

Breakpoint 1, sys_init_module (umod=0xd102ef40, len=0x23cb3, uargs=0x10016338 "") at kernel/
module.c:1907
1907                    ret = mod->init();

<< Discover init addressing from struct module >>
(gdb) lsmod
Address         Module
0xD102EF40      loop
(gdb) set $m=(struct module *)0xD102EF40
(gdb) p $m->module_core
$1 = (void *) 0xd102b000
(gdb) p $m->module_init
$2 = (void *) 0xd1031000

<< Now load a symbol file using the core and init addrs >>
(gdb) add-symbol-file ./drivers/block/loop.ko 0xd102b000 -s .init.text 0xd1031000
add symbol table from file "./drivers/block/loop.ko" at
        .text_addr = 0xd102b000
        .init.text_addr = 0xd1031000
(y or n) y
Reading symbols from /home/chris/sandbox/linux-2.6.13-amcc/drivers/block/loop.ko...done.
(gdb) b loop_init
Breakpoint 3 at 0xd1031000: file drivers/block/loop.c, line 1244.
(gdb) c
Continuing.

<< Breakpoint hit, proceed to debug module init function >>
Breakpoint 3, 0xd1031000 in loop_init () file drivers/block/loop.c, line 1244
1244        if (max_loop < 1 || max_loop > 256) {
(gdb)
Debugging kernel and device driver code using printk is a popular technique, mostly because printk has evolved into a very robust method. You can call printk from almost any context, including from interrupt handlers. printk is the kernel’s version of the familiar printf() C library function. printk is defined in .../kernel/printk.c.
It is important to understand the limitations of using printk for debugging. First, printk requires a console device. Moreover, although the console device is configured as early as possible during kernel initialization, there are many calls to printk before the console device has been initialized. We present a method to cope with this limitation later, in Section 14.5, “When It Doesn’t Boot.”
The printk function allows the addition of a string marker that identifies the level of severity of a given message. The header file .../include/linux/kernel.h defines eight levels:
#define    KERN_EMERG    "<0>" /* system is unusable */
#define    KERN_ALERT    "<1>" /* action must be taken immediately */
#define    KERN_CRIT     "<2>" /* critical conditions */
#define    KERN_ERR      "<3>" /* error conditions */
#define    KERN_WARNING  "<4>" /* warning conditions */
#define    KERN_NOTICE   "<5>" /* normal but significant condition */
#define    KERN_INFO     "<6>" /* informational */
#define    KERN_DEBUG    "<7>" /* debug-level messages */
A simple printk message might look like this:
printk("foo() entered w/ %s
", arg);
If the severity string is omitted, the kernel assigns a default severity level, which is defined in printk.c. In recent kernels, this is set at severity level 4, KERN_WARNING. Specifying printk with a severity level might look something like this:
printk(KERN_CRIT "vmalloc failed in foo()
");
By default, all printk messages below a predefined loglevel are displayed on the system console device. The default loglevel is defined in printk.c. In recent Linux kernels, it has the value 7. This means that any printk message that is greater in importance than KERN_DEBUG will be displayed on the console.
You can set the default kernel loglevel in a variety of ways. At boot time, you can specify the default loglevel on your target board by passing the appropriate kernel command-line parameters to the kernel at boot time. Three kernel command line options defined in main.c affect the default loglevel:
debug—. Sets the console loglevel to 10quiet—. Sets the console loglevel to 4loglevel=—. Sets the console loglevel to your choice of value
Using debug effectively displays every printk message. Using quiet displays all printk messages of severity KERN_ERR or higher.
printk messages can be logged to files on your target or via the network. Use klogd (kernel log daemon) and syslogd (system log daemon) to control the logging behavior of printk messages. These popular utilities are described in man pages and many Linux references, and are not described here.
This useful debugging aid is invoked through a series of special predefined key sequences that send messages directly to the kernel. For many target architectures and boards, you use a simple terminal emulator on a serial port as a system console. For these architectures, the Magic SysReq key is defined as a break character followed by a command character. Consult the documentation on the terminal emulator you use for how to send a break character. Many Linux developers use the minicom terminal emulator. For minicom, the break character is sent by typing Ctl-A F. After sending the break in this manner, you have 5 seconds to enter the command character before the command times out.
This useful kernel tool can be very helpful for development and debugging, but it can also cause data loss and system corruption. Indeed, the b command immediately reboots your system without any notification or preparation. Open files are not closed, disks are not synced, and file systems are not unmounted. When the reboot (b) command is issued, control is immediately passed to the reset vector of your architecture in a most abrupt and stunning manner. Use this powerful tool at your own peril!
This feature is well documented in the Linux kernel documentation subdirectory in a file called sysrq.txt. There you find the details for many architectures and the description of available commands.
For example, another way to set the kernel loglevel just discussed is to use the Magic SysReq key. The command is a number from 0 through 9, which results in the default loglevel being set to the number of the command. From minicom, press Ctl-A F followed by a number, such as 9. Here is how it looks on the terminal:
$ SysRq : Changing Loglevel
    Loglevel set to 9
Commands can be used to dump registers, shut down your system, reboot your system, dump a list of processes, dump current memory information to your console, and more. See the documentation file in any recent Linux kernel for the details.
This feature is most commonly used when something causes your system to lock up. Often the Magic SysReq key provides a way to learn something from an otherwise dead system.
By now you’ve probably realized that you cannot debug very early kernel-startup code with KGDB. This is because KGDB is not initialized until after most of the low-level hardware-initialization code has executed. Furthermore, if you are assigned the task of bringing up a brand-new board design and porting a bootloader and the Linux kernel, having a hardware-debug probe is without a doubt the most efficient means of debugging problems in these early stages of board porting.
You can choose from a wide variety of hardware-debug probes. For the examples in this section, we use a unit manufactured by Abatron called the BDI-2000 (see www.abatron.ch). These units are often called JTAG probes because they use a low-level communications method that was first employed for boundary scan testing of integrated circuits defined by the Joint Test Action Group (JTAG).
A JTAG probe contains a small connector designed for connection to your target board. It is often a simple square-pin header and ribbon cable arrangement. Most modern high-performance CPUs contain a JTAG interface that is designed to provide this software debugging capability. The JTAG probe connects to this CPU JTAG interface. The other side of the JTAG probe connects to your host development system usually via Ethernet, USB, or a parallel port. Figure 14-6 details the setup for the Abatron unit.
JTAG probes can be complicated to set up. This is a direct result of the complexity of the CPU to which it is connected. When power is applied to a target board and its CPU comes out of reset, almost nothing is initialized. In fact, many processors need at least a small amount of initialization before they can do anything. Many methods are available for getting this initial configuration into the CPU. Some CPUs read a hardware-configuration word or initial values of specific pins to learn their power-on configuration. Others rely on reading a default location in a simple nonvolatile storage device such as Flash. When using a JTAG probe, especially for bringing up a new board design, a minimum level of CPU and board initialization must be performed before anything else can be done. Many JTAG probes rely on a configuration file for this initialization.
The Abatron unit uses a configuration file to initialize the target hardware it is connected to, as well as to define other operational parameters of the debugger. This configuration file contains directives that initialize the CPU, memory system, and other necessary board-level hardware. It is the developer’s responsibility to customize this configuration file with the proper directives for his own board. The details on the configuration command syntax can be found in the JTAG probe’s documentation. However, only the embedded developer can create the unique configuration file required for a given board design. This requires detailed knowledge of the CPU and board-level design features. Much like creating a custom Linux port for a new board, there is no shortcut or substitute for this task.
Appendix F, “Sample BDI-2000 Configuration File,” contains a sample Abatron configuration file for a custom board based on the Freescale Semiconductor MPC5200 embedded controller. In that appendix, you can see the necessary setup for a custom board. Notice the liberal use of comments describing various registers and initialization details. This makes it easier to update and maintain over time, and it can help you to get it right the first time.
Hardware probes are generally used in two ways. Most have a user interface of some type that enables the developer to use features of the probe. Examples of this are to program Flash or download binary images. The second usage is as a front end to gdb or other source-level debuggers. We demonstrate both usage scenarios.
Many hardware probes include the capability to program a wide variety of Flash memory chips. The Abatron BDI-2000 is no exception. The BDI-2000 configuration file includes a [FLASH] section to define the characteristics of the target Flash. Refer to Appendix F for a sample. The [FLASH] section defines attributes of the Flash chip as used in a particular design, such as the chip type, the size of the device, and its data bus width. Also defined are the location in memory and some way to describe the chip’s storage organization.
When updating one portion of the Flash, you often want to preserve the contents of other portions of the same Flash. In this case, your hardware probe must have some way to limit the sectors that are erased. In the case of the Abatron unit, this is done by adding a line starting with the keyword ERASE for each sector to be erased. When the erase command is issued to the Abatron unit via its telnet user interface, all sectors defined with an ERASE specification are erased. Listing 14-20 demonstrates erasing a portion of Flash on a target board and subsequently programming a new U-Boot bootloader image.
Example 14-20. Erase and Program Flash
$ telnet bdi
Trying 192.168.1.129...
Connected to bdi (192.168.1.129).
Escape character is '^]'.
BDI Debugger for Embedded PowerPC
=================================
...  (large volume of help text)

uei> erase
Erasing flash at 0xfff00000
Erasing flash at 0xfff10000
Erasing flash at 0xfff20000
Erasing flash at 0xfff30000
Erasing flash at 0xfff40000
Erasing flash passed
uei> prog 0xfff00000 u-boot.bin BIN
Programming u-boot.bin , please wait ....
Programming flash passed
uei>
First we establish a telnet session to the Abatron BDI-2000. After some initialization, we are presented with a command prompt. When the erase command is issued, the Abatron displays a line of output for each section defined in the configuration file. With the configuration shown in Appendix F, we defined five erase sectors. This reserves up to 256KB of space for the U-Boot bootloader binary.
The prog command is shown with all three of its optional parameters. These specify the location in memory where the new image is to be loaded, the name of the image file, and the format of the file—in this case, a binary file. You can specify these parameters in the BDI-2000 configuration file. In this case, the command reduces to simply prog without parameters.
This example only scratches the surface of these two BDI-2000 commands. Many more combinations of usage and capabilities are supported. Each hardware JTAG probe has its own way to specify Flash erasure and programming capabilities. Consult the documentation for your particular device for the specifics.
Instead of interfacing directly with a JTAG probe via its user interface, many JTAG probes can interface with your source-level debugger. By far the most popular debugger supported by hardware probes is the gdb debugger. In this usage scenario, gdb is instructed to begin a debug session with the target via an external connection, usually an Ethernet connection. Rather than communicate directly with the JTAG probe via a user interface, the debugger passes commands back and forth between itself and the JTAG probe. In this model, the JTAG probe uses the gdb remote protocol to control the hardware on behalf of the debugger. Refer again to Figure 14-6 for connection details.
JTAG probes are especially useful for source-level debugging of bootloader and early startup code. In this example, we demonstrate the use of gdb and an Abatron BDI-2000 for debugging portions of the U-Boot bootloader on a PowerPC target board.
Many processors contain debugging registers that include the capability to set traditional address breakpoints (stop when the program reaches a specific address) as well as data breakpoints (stop on conditional access of a specified memory address). When debugging code resident in read-only memory such as Flash, this is the only way to set a breakpoint. However, these registers are typically limited. Many processors contain only one or two such registers. This limitation must be understood before using hardware breakpoints. The following example demonstrates this.
Using a setup such as that shown in Figure 14-6, assume that our target board has U-Boot stored in Flash. When we presented bootloaders in Chapter 7, you learned that U-Boot and other bootloaders typically copy themselves into RAM as soon as possible after startup. This is because hardware read (and write) cycles from RAM are orders of magnitude faster than typical read-only memory devices such as Flash. This presents two specific debugging challenges. First, we cannot modify the contents of read-only memory (to insert a software breakpoint), so we must rely on processor-supported breakpoint registers for this purpose.
The second challenge comes from the fact that only one of the execution contexts (Flash or RAM) can be represented by the ELF executable file from which gdb reads its symbolic debugging information. In the case of U-Boot, it is linked for the Flash environment where it is initially stored. The early code relocates itself and performs any necessary address adjustments. This means that we need to work with gdb within both of these execution contexts. Listing 14-21 shows an example of such a debug session.
Example 14-21. U-Boot Debugging Using JTAG Probe
$ ppc-linux-gdb --silent u-boot
(gdb) target remote bdi:2001
Remote debugging using bdi:2001
_start () at /home/chris/sandbox/u-boot-1.1.4/cpu/mpc5xxx/start.S:91
91        li      r21, BOOTFLAG_COLD   /* Normal Power-On */
Current language:  auto; currently asm

<< Debug a flash resident code snippet >>
(gdb)  mon break hard
(gdb)  b board_init_f
Breakpoint 1 at 0xfff0457c: file board.c, line 366.
(gdb) c
Continuing.

Breakpoint 1, board_init_f (bootflag=0x7fc3afc) at board.c:366
366             gd = (gd_t *) (CFG_INIT_RAM_ADDR + CFG_GBL_DATA_OFFSET);
Current language:  auto; currently c
(gdb) bt
#0  board_init_f (bootflag=0x1) at board.c:366
#1  0xfff0456c in board_init_f (bootflag=0x1) at board.c:353
(gdb) i frame
Stack level 0, frame at 0xf000bf50:
 pc = 0xfff0457c in board_init_f (board.c:366); saved pc 0xfff0456c
 called by frame at 0xf000bf78
 source language c.
 Arglist at 0xf000bf50, args: bootflag=0x1
 Locals at 0xf000bf50, Previous frame's sp is 0x0

<< Now debug a memory resident code snippet after relocation >>
(gdb) del 1
(gdb) symbol-file
Discard symbol table from '/home/chris/sandbox/u-boot-1.1.4-powerdna/u-boot'? (y or n) y
No symbol file now.
(gdb) add-symbol-file u-boot 0x7fa8000
add symbol table from file "u-boot" at
        .text_addr = 0x7fa8000
(y or n) y
Reading symbols from u-boot...done.
(gdb) b board_init_r
Breakpoint 2 at 0x7fac6c0: file board.c, line 608.
(gdb) c
Continuing.

Breakpoint 2, board_init_r (id=0x7f85f84, dest_addr=0x7f85f84) at board.c:608
608             gd = id;      /* initialize RAM version of global data */
(gdb) i frame
Stack level 0, frame at 0x7f85f38:
 pc = 0x7fac6c0 in board_init_r (board.c:608); saved pc 0x7fac6b0
 called by frame at 0x7f85f68
 source language c.
 Arglist at 0x7f85f38, args: id=0x7f85f84, dest_addr=0x7f85f84
 Locals at 0x7f85f38, Previous frame's sp is 0x0
(gdb)  mon break soft
(gdb)
Study this example carefully. Some subtleties are definitely worth taking the time to understand. First, we connect to the Abatron BDI-2000 using the target remote command. The IP address in this case is that of the Abatron unit, represented by the symbolic name bdi.[10] The Abatron BDI-2000 uses port 2001 for its remote gdb protocol connection.
Next we issue a command to the BDI-2000 using the gdb mon command. The mon command tells gdb to pass the rest of the command directly to the remote hardware device. Therefore, mon break hard sets the BDI-2000 into hardware breakpoint mode.
We then set a hardware breakpoint at board_init_f. This is a routine that executes while still running out of Flash memory at address 0xfff0457c. After the breakpoint is defined, we issue the continue c command to resume execution. Immediately, the breakpoint at board_init_f is encountered, and we are free to do the usual debugging activities, including stepping through code and examining data. You can see that we have issued the bt command to examine the stack backtrace and the i frame command to examine the details of the current stack frame.
Now we continue execution again, but this time we know that U-Boot copies itself to RAM and resumes execution from its copy in RAM. So we need to change the debugging context while keeping the debugging session alive. To accomplish this, we discard the current symbol table (symbol-file command with no arguments) and load in the same symbol file again using the add-symbol-file command. This time, we instruct gdb to offset the symbol table to match where U-Boot has relocated itself to memory. This ensures that our source code and symbolic debugging information match the actual memory resident image.
After the new symbol table is loaded, we can add a breakpoint to a location that we know will reside in RAM when it is executed. This is where one of the subtle complications is exposed. Because we know that U-Boot is currently running in Flash but is about to move itself to RAM and jump to its RAM-based copy, we must still use a hardware breakpoint. Consider what happens at this point if we use a software breakpoint. gdb dutifully writes the breakpoint opcode into the specified memory location, but U-Boot overwrites it when it copies itself to RAM. The net result is that the breakpoint is never hit, and we begin to suspect that our tools are broken. After U-Boot has entered the RAM copy and our symbol table has been updated to reflect the RAM-based addresses, we are free to use RAM-based breakpoints. This is reflected by the last command in Listing 14-21 setting the Abatron unit back to soft breakpoint mode.
Why do we care about using hardware versus software breakpoints? If we had unlimited hardware breakpoint registers, we wouldn’t. But this is never the case. Here is what it looks like when you run out of processor-supported hardware breakpoint registers during a debug session:
(gdb) b flash_init
Breakpoint 3 at 0x7fbebe0: file flash.c, line 70.
(gdb) c
Continuing.
warning: Cannot insert breakpoint 3:
Error accessing memory address 0x7fbebe0: Unknown error 4294967295.
Because we are debugging remotely, we aren’t told about the resource constraint until we try to resume after entering additional breakpoints. This is because of the way gdb handles breakpoints. When a breakpoint is hit, gdb restores all the breakpoints with the original opcodes for that particular memory location. When it resumes execution, it restores the breakpoint opcodes at the specified locations. You can observe this behavior by enabling gdb’s remote debug mode:
(gdb) set debug remote 1One of the most frequently asked questions on the various mailing lists that serve embedded Linux goes something like this:
I am trying to boot Linux on my board, and I get stuck after this message prints to my console:
“Uncompressing Kernel Image . . . OK.”
Thus starts the long and sometimes frustrating learning curve of embedded Linux! Many things that can go wrong could lead to this common failure. With some knowledge and a JTAG debugger, there are ways to determine what went awry.
The first tool you might have available is CONFIG_SERIAL_TEXT_DEBUG. This Linux kernel-configuration option adds support for debug messages very early in the boot process. At the present time, this feature is limited to the PowerPC architecture, but nothing prevents you from duplicating the functionality in other architectures. Listing 14-22 provides an example of this feature in use on a PowerPC target using the U-Boot bootloader.
Example 14-22. Early Serial Text Debug
## Booting image at 00200000 ...
   Image Name:   Linux-2.6.14
   Created:      2005-12-19  22:24:03 UTC
   Image Type:   PowerPC Linux Kernel Image (gzip compressed)
   Data Size:    607149 Bytes = 592.9 kB
   Load Address: 00000000
   Entry Point:  00000000
   Verifying Checksum ... OK
   Uncompressing Kernel Image ... OK
id mach(): done      <== Start of messages enabled by
MMU:enter            <== CONFIG_SERIAL_TEXT_DEBUG
MMU:hw init
MMU:mapin
MMU:setio
MMU:exit
setup_arch: enter
setup_arch: bootmem
arch: exit
arch: real exit
Using this feature, you can often tell where your board is getting stuck during the boot process. Of course, you can add your own early debug messages in other places in the kernel. Here is an example of its usage found in .../arch/ppc/mm/init.c:
/* Map in all of RAM starting at KERNELBASE */
if (ppc_md.progress)
        ppc_md.progress("MMU:mapin", 0x301);
mapin_ram();
The AMCC Yosemite platform is an excellent example of this infrastructure. Consult the following files in the Linux source tree[11] for details of how this debugging system is implemented:
File | Function | Purpose |
|---|---|---|
|
| Serial port setup, called by yosemite.c platform-initialization file |
|
| Low-level serial output routine |
|
| Binds platform-specific progress routine to generic ppc machine-dependent infrastructure |
When we discussed printk debugging in Section 14.3.6, we pointed out some of the limitations of this method. printk itself is a very robust implementation. One of its shortcomings is that you can’t see any printk messages until later in the boot sequence when the console device has been initialized. Very often, when your board hangs on boot, quite a few messages are stuck in the printk buffer. If you know where to find them, you can often pinpoint the exact problem that is causing the boot to hang. Indeed, many times you will discover that the kernel has encountered an error that led to a call to panic(). The output from panic() has likely been dumped into the printk buffer, and you can often pinpoint the exact line of offending code.
This is best accomplished with a JTAG debugger, but it is still possible to use a bootloader and its memory dump capability to display the contents of the printk buffer after a reset. Some corruption of memory contents might occur as a result of the reset, but log buffer text is usually very readable.
The actual buffer where printk stores its message text is declared in the printk source file .../kernel/printk.c.
static char __log_buf[__LOG_BUF_LEN];
We can easily determine the linked location of this buffer from the Linux kernel map file System.map.
$ grep __log_buf System.map
      c022e5a4 b __log_buf
Now if the system happens to hang upon booting, right after displaying the "Uncompressing Kernel Image ... OK" message, reboot and use the bootloader to examine the buffer. Because the relationship between kernel virtual memory and physical memory is fixed and constant on a given architecture, we can do a simple conversion. The address of __log_buf shown earlier is a kernel virtual address; we must convert it to a physical address. On this particular PowerPC architecture, that conversion is a simple subtraction of the constant KERNELBASE address, 0xc0000000. This is where we probe in memory to read the contents, if any, of the printk log buffer.
Listing 14-23 is an example of the listing as displayed by the U-Boot memory dump command.
Example 14-23. Dump of Raw printk Log Buffer
=> md 22e5a4
0022e5a4: 3c353e4c 696e7578 20766572 73696f6e    <5>Linux version
0022e5b4: 20322e36 2e313320 28636872 6973406a     2.6.13 (chris@
0022e5c4: 756e696f 72292028 67636320 76657273    junior) (gcc
0022e5d4: 696f6e20 332e342e 3320284d 6f6e7461    version 3.4.3 (Monta
0022e5e4: 56697374 6120332e 342e332d 32352e30    Vista 3.4.3-25.0
0022e5f4: 2e37302e 30353031 39363120 32303035    .70.0501961 2005
0022e604: 2d31322d 31382929 20233131 20547565    -12-18)) #11 Tue
0022e614: 20466562 20313420 32313a30 353a3036     Feb 14 21:05:06
0022e624: 20455354 20323030 360a3c34 3e414d43     EST 2006.<4>AMC
0022e634: 4320506f 77657250 43203434 30455020    C PowerPC 440EP
0022e644: 596f7365 6d697465 20506c61 74666f72    Yosemite Platform.
0022e654: 6d0a3c37 3e4f6e20 6e6f6465 20302074    <7>On node 0
0022e664: 6f74616c 70616765 733a2036 35353336    totalpages: 65536
0022e674: 0a3c373e 2020444d 41207a6f 6e653a20    .<7>  DMA zone:
0022e684: 36353533 36207061 6765732c 204c4946    65536 pages, LIF
0022e694: 4f206261 7463683a 33310a3c 373e2020    0 batch:31.<7>
=>
0022e6a4: 4e6f726d 616c207a 6f6e653a 20302070    Normal zone: 0
0022e6b4: 61676573 2c204c49 464f2062 61746368    pages, LIFO batch
0022e6c4: 3a310a3c 373e2020 48696768 4d656d20    :1.<7>  HighMemzone:
0022e6d4: 7a6f6e65 3a203020 70616765 732c204c    0 pages,
0022e6e4: 49464f20 62617463 683a310a 3c343e42    LIFO batch:1.<4>
0022e6f4: 75696c74 2031207a 6f6e656c 69737473    Built 1 zonelists
0022e704: 0a3c353e 4b65726e 656c2063 6f6d6d61    .<5>Kernel command
0022e714: 6e64206c 696e653a 20636f6e 736f6c65    line: console
0022e724: 3d747479 53302c31 31353230 3020726f    =ttyS0,115200
0022e734: 6f743d2f 6465762f 6e667320 72772069    root=/dev/nfs rw
0022e744: 703d6468 63700a3c 343e5049 44206861    ip=dhcp.<4>PID
0022e754: 73682074 61626c65 20656e74 72696573    hash table entries
0022e764: 3a203230 34382028 6f726465 723a2031    : 2048 (order:
0022e774: 312c2033 32373638 20627974 6573290a    11, 32768 bytes).
0022e784: 00000000 00000000 00000000 00000000    ................
0022e794: 00000000 00000000 00000000 00000000    ................
=>
It’s not very pretty to read, but the data is there. We can see in this particular example that the kernel crashed someplace after initializing the PID hash table entries. With some additional use of printk messages, we can begin to close in on the actual source of the crash.
As shown in this example, this is a technique that can be used with no additional tools. You can see the importance of some kind of early serial port output during boot if you are working on a new board port.
If KGDB is enabled, the kernel attempts to pass control back to KGDB upon error exceptions. In some cases, the error itself will be readily apparent. To use this feature, a connection must already be established between KGDB and gdb. When the exception condition occurs, KGDB emits a Stop Reply packet to gdb, indicating the reason for the trap into the debug handler, as well as the address where the trap condition occurred. Listing 14-24 illustrates the sequence.
Example 14-24. Trapping Crash on Panic Using KGDB
$ ppc-_4xx-gdb --silent vmlinux
(gdb) target remote /dev/ttyS0
Remote debugging using /dev/ttyS0
Malformed response to offset query, qOffsets
(gdb) target remote /dev/ttyS0
Remote debugging using /dev/ttyS0
breakinst () at arch/ppc/kernel/ppc-stub.c:825
825     }
(gdb) c
Continuing.

<< KGDB gains control from panic() on crash >>
Program received signal SIGSEGV, Segmentation fault.
0xc0215d6c in pcibios_init () at arch/ppc/kernel/pci.c:1263
1263            *(int *)-1 = 0;
(gdb) bt
#0  0xc0215d6c in pcibios_init () at arch/ppc/kernel/pci.c:1263
#1  0xc020e728 in do_initcalls () at init/main.c:563
#2  0xc020e7c4 in do_basic_setup () at init/main.c:605
#3  0xc0001374 in init (unused=0x20) at init/main.c:677
#4  0xc00049d0 in kernel_thread ()
Previous frame inner to this frame (corrupt stack?)
(gdb)
The crash in this example was contrived by a simple write to an invalid memory location (all ones). We first establish a connection from gdb to KGDB and allow the kernel to continue to boot. Notice that we didn’t even bother to set breakpoints. When the crash occurs, we see the line of offending code and get a nice backtrace to help us determine its cause.
Linux kernel debugging presents many complexities, especially in a cross-development environment. Understanding how to navigate these complexities is the key to successful kernel debugging.
KGDB is a very useful kernel-level
gdb stubthat enables direct symbolic source-level debugging inside the Linux kernel and device drivers. It uses thegdbremote protocol to communicate to your host-based cross-gdb.Understanding (and minimizing) compiler optimizations helps make sense of seemingly strange debugger behavior when stepping through compiler-optimized code.
gdbsupports user-defined commands, which can be very useful for automating tedious debugging tasks such as iterating kernel linked lists and accessing complex variables.Kernel-loadable modules present their own challenges to source-level debugging. The module’s initialization routine can be debugged by placing a breakpoint in
module.cat the call tomodule->init().printkand the Magic SysReq key provide additional tools to help isolate problems during kernel development and debugging.Hardware-assisted debugging via a JTAG probe enables debugging Flash or ROM resident code where other debugging methods can be cumbersome or otherwise impossible.
Enabling
CONFIG_SERIAL_TEXT_DEBUGon architectures where this feature is supported is a powerful tool for debugging a new kernel port.Examining the
printk log_bufoften leads to the cause of a silent kernel crash on boot.KGDBpasses control togdbon a kernel panic, enabling you to examine a backtrace and isolate the cause of the kernel panic.
Linux Kernel Development, 2nd EditionRobert LoveNovell Press, 2005
The Linux Kernel PrimerClaudia Salzberg Rodriguez et al.Prentice Hall, 2005
“Using the GNU Compiler Collection”Richard M. Stallman and the GCC Developer CommunityGNU Press, a division of Free Software Foundationhttp://gcc.gnu.org/onlinedocs/
KGDB Sourceforge home pagehttp://sourceforge.net/projects/KGDB
Debugging with GDBRichard Stallman, Roland Pesch, Stan Shebs, et al.Free Software Foundationwww.gnu.org/software/gdb/documentation/
Tool Interface StandardsDWARF Debugging Information Format SpecificationVersion 2.0TIS Committee, May 1995
[1] See the GCC manual referenced at the end of this chapter in Section 14.6.1, “Suggestions for Additional Reading” for details on the optimization levels.
[2] Inline functions are like macros, but with the advantage of compile-time type checking.
[3] Notwithstanding the comments made earlier about KGDB over Ethernet.
[4] As pointed out earlier, the gdb remote protocol is detailed in the gdb manual cited at the end of this chapter in Section 14.6.1, “Suggestions for Additional Reading”
[5] Remember to use your cross-version of readelf—for example, ppc_44x-readelf for the PowerPC 44x architecture.
[6] A reference for the Dwarf debug specification appears at the end of this chapter in Section 14.6.1, “Suggestions for Additional Reading.”
[7] A helpful shortcut for macro development is the gdb source command. This command opens and reads a source file containing macro definitions.
[8] The symbol _end is defined in the linker script file during the final link.
[9] As of this writing, there is a bug in gdb that prevents this technique from working properly. Hopefully, by the time you read this, it will be fixed.
[10] An entry in the host system’s /etc/hosts file enables the symbolic IP address reference.
[11] All these filenames are unique, so they can be found without full pathname references.