
Traditionally, one of the most frustrating aspects of building ASP-based Web applications has been the inconsistent debugging and diagnostic support. The script debuggers for diagnosing server-side VBScript or JavaScript errors are notoriously unreliable, and the most commonly used diagnostic tool used for analyzing ASP applications is Response.Write(). Contrast these tools with the rich debugging and diagnostic facilities that both C++ and Visual Basic developers have had for years, and it is obvious why ASP developers have been frustrated with debugging.
Fortunately, ASP.NET changes all that. To begin with, because ASP.NET pages are now compiled into complete assemblies before execution, they can be debugged with the same debugging facilities available to component and application developers, including the full-featured Visual Studio .NET debugger. Second, the diagnostics for building ASP.NET applications have also improved significantly, including a tracing facility that lets you print diagnostic messages that display only when tracing is enabled, and a number of new performance monitor counters to track everything from worker process lifetime to requests processed per second.
In addition to diagnostic support, ASP.NET provides comprehensive error handling and recovery support. You can provide custom error pages to be displayed when specific error codes are returned, and because all of ASP.NET is built on top of the CLR, the native exception handling mechanism in .NET is used to transmit unexpected errors.
ASP.NET offers several tools for diagnosing problems in your applications. Tracing provides a welcome alternative to printing diagnostic messages to your pages using Response.Write, which ASP developers have always relied on heavily. Application-level tracing is useful for tracking down problems that occur across multiple pages in an application. And more than 50 new performance monitor counters provide detailed diagnostic information about ASP.NET's behavior on your server.
One of the most useful, and easiest-to-use, diagnostic features of ASP.NET is page tracing. Simply adding Trace=true to your @Page directive causes ASP.NET to generate diagnostic information at the end of your normal page rendering, containing everything you would ever want to know about the request and its response. Page-level tracing is extremely convenient because just by placing one additional attribute on your .aspx page, you can quickly collect information about the any request made to that page. Figure 5-1 shows an example of a page that has enabled tracing and the resulting output generated when that page is rendered.
Enabling page tracing displays six pieces of information for a page, as listed in Table 5-1. The request details section shows the session ID, the time of the request, the encoding types of the request and response, and the resulting status code. The trace information section contains the output of trace statements made either by system libraries or by the page. The control tree section displays all the controls that were created to render the page along with how many rendering bytes they occupied and how much information they stored in the view state cache. The cookies collection shows the names and values of all cookies sent by a client. The headers collection shows all the header information presented by the client at the time of the request. Finally, the server variables section shows all the intrinsic server variables available to page scripts, and their values.
Table 5-1. Contents of Page Trace Information
Section | Description |
|---|---|
Request details | Details of the request, including the session ID, the time the request was made, the request and response encodings, the request type, and the return status code |
Trace information | Output of any |
Control tree | Hierarchical display of all server-side controls in the requested page |
Cookies collection | All cookies accompanying the request |
Headers collection | All headers accompanying the request |
Server variables | All the server variables and their values at the time of the request |
The goal of enabling tracing on a page is to be able to see at a glance all the relevant data associated with a particular request, to easily diagnose any problems that might have occurred. Many of the methods in ASP.NET classes generate some output to the trace stream, as you will see if you enable tracing on a page. In addition to the ASP.NET-generated output, however, it is often even more useful to have custom output from your own classes and pages printed to the trace output stream. To do this, you can access the Trace property of your Page class that references an instance of the TraceContext class. You can use the Write method to send information to the trace information region of the trace output. If instead you use the Warn method, the trace statement is printed in red to indicate it is a warning. Finally, you can check to see whether tracing is enabled by querying the IsEnabled property of the TraceContext object if your trace operation involves any additional code that should be avoided when tracing is disabled, as shown in Figure 5-2.
It is good practice to add trace output to most of your pages and classes, even if you see no immediate need for the information. When something goes wrong on a page, you are better off having more diagnostic information to help resolve the problem quickly. Tracing is appealing because it does not generate any output or occupy any additional computation time unless you explicitly enable it, so there is no cost in liberally adding trace messages to your pages.
It is often useful, when you are trying to track down a problem, to be able to save several page traces for later review and analysis. You can do this by enabling tracing at the application level instead of the page level. When you enable tracing in your application-wide configuration file, ASP.NET saves the trace output of every page visited until you disable it. Figure 5-3 shows an example of enabling trace at the application level and the corresponding output generated by navigating to the trace.axd URL at any location in your application.
The attributes for the trace element are shown in Table 5-2. In addition to simply enabling, trace accepts requestLimit as an attribute to control how many pages to trace (which defaults to 10), pageOutput to control whether page-level tracing is shown as well, traceMode to control the sorting of the trace output, and localOnly to control whether remote access to the site can see the trace output. Once tracing has been enabled for an application, all requests made for pages in that application are traced and stored in-memory in the worker process. To view the page traces, navigate to trace.axd at the root of the application, for which a special HttpHandler is defined, and ASP.NET displays a list of all the traces stored since application-level tracing was enabled.
Table 5-2. trace Element Attributes
| Values | Description |
|---|---|---|
|
| Whether application-level tracing is enabled or disabled |
|
| Show trace output on the localhost only |
|
| Display trace output on individual pages in addition to caching application-level traces |
| Number | How many traces to store in memory before removing earlier traces (defaults to 10) |
|
| How to sort the trace output |
In addition to the page-level diagnostic features, ASP.NET provides many counters for the performance monitoring utility to track the performance and behavior of your applications. More than 50 counters are available, ranging from how many times the worker process has restarted to how many requests are processed per second. A partial list of the available counters is shown in Table 5-3.
Table 5-3. Performance Counters Available for ASP.NET
Counter | Description |
|---|---|
Application Restarts | Number of times the application has been restarted during the Web server's lifetime |
Applications Running | Number of currently running Web applications |
Request Execution Time | Number of milliseconds it took to execute the most recent request |
Requests Queued | Number of requests waiting to be processed |
Requests Rejected | Number of requests rejected because the request queue was full |
Worker Process Restarts | Number of times a worker process has restarted on the machine |
Anonymous Requests/Sec | Number of anonymous requests per second |
Cache API Entries | Number of user-added entries in the cache |
Cache API Hit Ratio | Ratio of hits called from user code |
Compilations Total | Number of .asax, .ascx, .ashx, or .aspx source files dynamically compiled |
Errors During Execution | Number of errors that have occurred during the processing of a request |
Output Cache Hit Ratio | Ratio of hits to requests for output cacheable requests |
Pipeline Instance Count | Number of active pipeline instances |
Requests Succeeded | Number of requests that executed successfully |
Requests/Sec | Number of requests executed per second |
Sessions Active | Number of currently active sessions |
Sessions Total | Number of sessions since the application was started |
When you install ASP.NET, these counters should be installed on the same machine. To use any of the counters, bring up the Performance administrative tool (perfmon.exe), and choose to add a counter. You should see two categories of ASP.NET performance objects, one simply labeled ASP.NET and the other labeled ASP.NET Applications. Figure 5-4 shows a sample instance of the Performance tool with three of the ASP.NET performance counters activated.
Because ASP.NET pages are compiled into assemblies, you can debug them in much the same way you might debug any other .NET component. First, you must be sure you compile your pages with debug symbols. To do this on a per-page basis, set the Debug attribute on the Page directive to true, as shown in Listing 5-1.
Alternatively, you can enable debug compilation for all the pages in your application by adding the compilation element to your web.config file with debug set to true, as shown in Listing 5-2.
Example 5-2. web.config with Debug Compilation
<configuration>
  <system.web>
    <compilation debug='true' />
  </system.web>
</configuration>
Also keep in mind that any code-behind assemblies that you precompile must be built with debug symbols enabled in order to debug them with source display. Once debug symbols have been generated for your page assemblies, you can use the Visual Studio .NET debugger to step through any server-side or client-side code. If you are building a Web application with Visual Studio .NET, the simplest way to execute your program is with Debug/Start. If, on the other hand, you are trying to debug an application that is already running or that was not built with Visual Studio .NET, you can use the alternative technique of attaching to the ASP.NET worker process. To do this, select Debug/Processes from the menu within Visual Studio .NET. When presented with a dialog, select the aspnet_wp.exe process to attach. This will bring up a second dialog, displaying all the active AppDomains in the worker process. Select the AppDomain that has your virtual directory name in it, and attach. You can now open any source files from your application that you would like to debug, and place breakpoints as desired. Figure 5-5 shows the dialogs you are presented with when you attach to the process.
By default, ASP.NET displays generic error pages for any server errors that occur, such as missing files or internal server errors. The default display for a 404 error is shown in Figure 5-6.
If you prefer, you can build specific error pages to display to users when an error occurs in your application. You can specify a particular page to be displayed when an error occurs on a page-by-page basis by using the ErrorPage attribute of the Page directive with the URL of the error page, as shown in Listing 5-3. It is more likely, however, that you will want to specify a general error page, or a collection of specific error pages, to be used for an entire application. Application-wide error pages can be specified in your web.config file by using the customErrors element, as shown in Listing 5-4.
Example 5-4. Specifying Error Pages for an Application
<configuration>
  <system.web>
    <customErrors defaultredirect='ouch.aspx' mode='On'>
      <error statuscode='404' redirect='nofile.aspx'/>
    </customErrors>
  </system.web>
</configuration>
With the customErrors element, you can specify a unique error page (or URL) for each HTTP error code, and one top-level page that users will be redirected to if none of the specific error codes are encountered. The other attribute of the customErrors element, mode, controls when these custom error pages are displayed. By default, mode is set to RemoteOnly, which shows the custom error pages only when the pages are accessed by a remote machine (any machine but the server). This is useful because the ASP.NET error page that is displayed for an unhandled exception contains useful information, including source code and a stack trace. If you are developing on a test server machine, it is useful to see the full diagnostic information in the generated error page for unhandled exceptions. However, you probably don't want clients to see that level of detail, which is exactly what the RemoteOnly setting does for you—show the detailed error information when the page is accessed locally, and show whatever you have specified in the customErrors element when the page is accessed remotely. Table 5-4 shows the complete set of attributes associated with the customErrors element, with associated descriptions.
Table 5-4. customErrors Attributes
| Values | Description |
|---|---|---|
|
|
|
Specifying | ||
Specifying | ||
| URL to redirect to | If there is no specific page designated to display when an error is encountered, the URL specified here is used. |
One of the most compelling aspects of working with the CLR is that even poorly written code is unlikely to cause your program to crash. Because all memory is accessed through references, array boundaries are maintained and checked on access, and direct pointers into memory are a thing of the past,[12] it is almost impossible to cause a program error by writing to the wrong block of memory. This is not to say, however, that programs are now guaranteed error-free, but that errors are recognized by the runtime and can be dealt with programmatically.
Whenever errors are detected by the runtime, such as a divide by zero or a failure to connect to a database, an exception is thrown. Ideally, your ASP.NET pages and components should trap any potential exceptions and decide what to do for recovery where the exception occurred. Often, however, programs do not check for all potential exceptions, so any unhandled exceptions propagate up the call stack to a top-level exception handler provided by ASP.NET. If you receive an unhandled exception when you are running on the server machine, ASP.NET will print a useful diagnostic message containing a stack trace and source code showing the location the error was generated. If your application is accessed remotely when an unhandled exception occurs, however, your clients will see an error page that looks like the one shown in Figure 5-7.
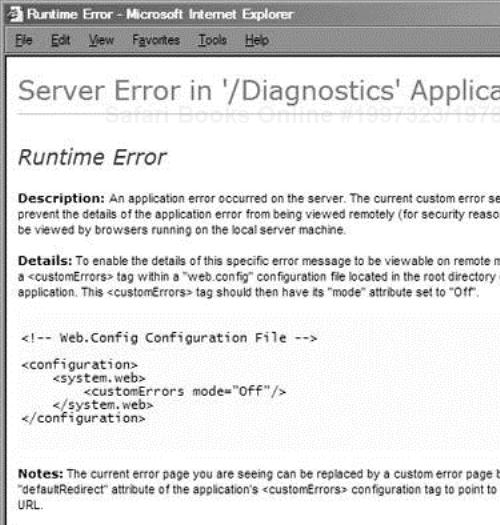
As a developer, you should be embarrassed if your clients ever see this page. Not only does it state that an unhandled error occurred on the server, but it gives advice on how to configure the application to avoid showing this page again. The second piece of advice given by this page is one you should always follow: Include a customErrors element in your configuration file that provides a redirection to your own internal error handling page so that clients never see this page. The only disadvantage to this solution is that you lose the exception information when ASP.NET redirects clients to the default error page you specify, so there is no way to log information about the error or to give clients information to pass along to you so that you can analyze what went wrong.
To deal with this lack of error information in your default redirection page, you can provide a handler for the Error event of the HttpApplication class. This event is issued whenever there is an unhandled exception, and it is called before the internal ASP.NET unhandled event code executes, giving you the chance to deal with the error yourself and perhaps not display an error page at all. To add a handler to this even, create a global.asax file, and define a function named Application_Error, as shown in Listing 5-5. By calling the ClearError() method of the HttpContext class, you can prevent ASP.NET's unhandled exception code from ever being executed. Be warned, however, that calling ClearError() also prevents any redirection to other error pages you may have defined for specific HTTP error codes.
Example 5-5. Dealing with Unhandled Exceptions
<!— global.asax —>
<%@ Application Language='C#' %>
<script runat=server>
protected void Application_Error(object src, EventArgs e)
{
  Exception ex = Server.GetLastError();
  // do something with the error here, such as
  // writing to the event log
  // The following line writes the error message
  // to the event log with a source of "MyApp"
  // Note that the "MyApp" source must be preregistered
  EventLog.WriteEntry("MyApp", ex.Message,
                      EventLogEntryType.Error);

  // At this point you could call:
  // Context.ClearError();
  // to clear the error and continue execution.
  // In general, you don't want to do this, because it will
  // prevent ASP.NET from redirecting to your error pages
}
</script>
The one other possible approach, which gives you the best of both worlds, is to look at the error in your Error handler, and if it is an unhandled exception, perform a Server.Transfer() to a custom error page you have built that displays information to users about the unhandled exception, which they could then relay to you. If it is any other type of error, just let it pass through, and ASP.NET will take care of redirecting users to the appropriate error page. It is important to perform the Server.Transfer() to the error page to retain the exception information, because performing a Server.Redirect() cause a round-trip back to the client, and the error information will be lost. Listing 5-6 shows the technique for performing the test on the exception and executing a transfer to the error page, and Listing 5-7 shows the sample error page that then has access to the exception information. Note that the exception typically is passed through the InnerException field of the Exception class.
Example 5-6. Retaining Exception Information
// in global.asax
protected void Application_Error(Object sender, EventArgs e) {
  if (Server.GetLastError() is HttpUnhandledException)
      Server.Transfer("MyErrorPage.aspx");

  // Otherwise, we fall through, and the normal ASP.NET
  // error handling takes over
}
Example 5-7. Accessing Exception Information in an Error Page
<!— MyErrorPage.aspx —>
<%@ Page Language='C#' %>
<html>
<h1>My error page</h1>
<%
Exception ex = Server.GetLastError();
     if (ex != null)
     {
          string err="";
          if (ex.InnerException != null)
          Response.Output.Write("The error was: {0}",
                        ex.InnerException.Message);
}
%> </html>
ASP.NET provides a welcome set of new diagnostic tools to Web application development. The shift from interpretation to compilation means that all the debugging facilities available for standard application development are now available for Web application development too. Page and application tracing provide comprehensive diagnostic output for any page in an application, and generating custom trace messages is a great way to track problems in an application. The installation of ASP.NET also includes a number of performance monitor counters that track virtually every aspect of an application. Finally, it is possible to specify custom error pages to display to users when things inadvertently go wrong.
[12] Note that it is still possible to use pointers in C# with code that is marked as “unsafe,” and managed C++ still works directly with pointers. Code written with pointers is known as unverifiable code and can be prevented from running at all by imposing the appropriate Code Access Security restriction. Most code written for ASP.NET applications will be verifiable C# or VB.NET code.