
Chapter 2. A Risk Management Framework[1]
No noble thing can be done without risks. | ||
| --MICHEL DE MONTAIGNE | ||
We’ve all said it—security is risk management. However, nomenclature remains a persistent problem in the security community. The idea of risk management as a key tenet of security, though pervasive and oft repeated, is presented under a number of different rubrics in software security, attached to particular processes, such as “threat modeling” and “risk analysis,” as well as to larger-scale activities such as “security analysis.” As I describe in Chapter 1, a continuous risk management process is a necessity. By teasing apart architectural risk analysis (one of the critical software security touchpoints described later in the book) and an overall risk management framework (RMF, described here), we can begin to make more sense of software security risk.
An RMF is at its heart a philosophy for software security. Following the RMF is by definition a full lifecycle activity, no matter whether you’re working on a little project or a huge corporate application strategy. The key to reasonable risk management is to identify and keep track of risks over time as a software project unfolds. As touchpoints are applied and risks are uncovered, for example, an RMF allows us to track them and display information about status. For the purposes of this chapter, consider risk management as a high-level approach to iterative risk management that is deeply integrated throughout the software development lifecycle (SDLC) and unfolds over time. The basic idea is simple: identify, rank, track, and understand software security risk as it changes over time.
What follows in this chapter is a detailed explanation of a mature RMF used at Cigital. This chapter may be a bit heavy for some. If you’re more interested in specific best practices for software security, you should skip ahead to Part II. If you do skip ahead, make sure you cycle back around later in order to understand how the framework described here supports all of the best practices.
The software security touchpoints exist to drive out technical risk. Critical to proper application of the touchpoints is the notion of keeping track of security risks as they are uncovered and making sure they are properly dealt with. The RMF is about identifying, tracking, and mitigating software risk over time.
Central to the notion of risk management is the idea of describing impact. Recall from Chapter 1 that risk is defined as probability × impact. Without a clear and compelling tie to either business or mission consequences, technical risks, software defects, and the like are not often compelling enough on their own to spur action. Though the risks I focus on in this book are all tied directly to software and all have clear security ramifications, unless they are described in terms that business people and decision makers understand, they will not likely be addressed. There is nothing more frustrating to a technical person than identifying a serious problem that never gets fixed. We can avoid that frustration by properly describing impact.
Put more succinctly, a major hurdle to the proper handling of technical risk has been the inability to tie risk clearly to business impact. This leads to the techno-gibberish problem. Software is a fairly geeky domain. It’s about arcane technology that business people don’t understand. The question needs to be: How do you get business people to care whether their software works or not? The answer has to be that software risk must be discussed, understood, and related in terms of business impact. As a technical person, you need to say something like, “If the flimflobble in sector four has a floosblozzle failure, that means we will miss the first quarter number by $2 million” (as opposed to just saying the first part). Business people can relate to the last part of the statement.
The RMF described here is a condensed version of the Cigital RMF, which has been applied in the field for almost ten years. An RMF is designed to manage software-induced business risks. For purposes of clarity, the RMF is described here in the context of a particular project; however, many of the activities can be applied at different levels. Through the application of these activities, analysts bring to bear their own technical expertise, relevant tools, and technologies.
The purpose of an RMF like this is to allow a consistent and repeatable expertise-driven approach to risk management. By converging on and describing software risk management activities in a consistent manner, the basis for measurement and common metrics emerges. Such metrics are sorely needed and will prove to be extremely valuable, allowing organizations to better manage business and technical risks given particular quality goals; make more informed, objective business decisions regarding software (e.g., whether an application is ready to release); and improve internal software development processes so that they in turn better manage software risks.
How to Use This Chapter[2]
An RMF like the one described here should be applied by anyone charged with software risk management. This goes for reliability, performance, and safety risk managers just as well as it does for security personnel. Whether software risk management is being imposed from above in a top-down exercise of corporate governance or bubbling up from the technical trenches, a clear and consistent approach to risk is a necessity. For that reason, the RMF is designed to fit a tiny little summer internship project just as well as it fits a large-scale enterprise risk management regimen.
Application of the RMF occurs in parallel with standard SDLC activities. Applying the RMF as a parallel thread is not a particularly time-consuming undertaking (especially if parts of the framework have been automated). In our experience at Cigital, a small risk management team of two to four people can track and manage risks for even the largest project. For a small project, the RMF can be applied as the part-time activity of an existing team member.
The RMF is not specific to security risks. In fact, the RMF is general enough that it is likely to apply even in non-software situations. We do know from experience that the RMF works well for tracking reliability risks, project management and governance risks, and a host of other software-induced business risks just as well as it tracks security risks. To remind you of this applicability, the example used in this chapter to step you through the RMF does not concentrate solely on security risks.
Don’t forget that the main purpose of the RMF is to consistently track and handle risks. By grounding the touchpoints described in Part II in the RMF philosophy, you can develop a powerful risk management capability.
The RMF is described in a pyramid fashion. Because this material is difficult, it may help to understand the presentation order. I begin with a picture (Figure 2-1) and then present a bird’s-eye view of the five fundamental activities, which I refer to as stages. Next, a detailed walkthrough features the mythical company KillerAppCo, whose product, iWare 1.0 Server, is under analysis. The example is rigorous and provides a number of “work product” tables and other guides to help make each of the five stages concrete and applicable. As you step through the example, don’t forget that the skeleton of the process is available for your reference in Figure 2-1.

Figure 2-1. The risk management framework (RMF). In this picture, the RMF is a closed-loop process with five basic activity stages, each of which is numbered. Throughout the application of the RMF, tracking, reporting, measurement, and display activities that focus on understanding progress regarding software risk can occur. The touchpoints described in this book feed the RMF with risks and other data. The RMF displayed here is a condensed version of the Cigital RMF, which has been used for almost ten years in the field.
The RMF consists of the five fundamental activity stages shown in Figure 2-1:
Understand the business context
Identify the business and technical risks
Synthesize and prioritize the risks, producing a ranked set
Define the risk mitigation strategy
Carry out required fixes and validate that they are correct
Each of the stages is briefly summarized next. Particular tasks, processes, measurements, work products, and templates are described in detail later in the chapter. Critical business decisions, including release readiness, can be made in a more straightforward and informed manner by identifying, tracking, and managing software risk explicitly as described in the RMF.
Software risk management occurs in a business context. Risks are unavoidable and are a necessary part of software development. Management of risks, including the notion of risk aversion and technical tradeoffs, is deeply impacted by business motivation. Thus the first stage of software risk management involves getting a handle on the business situation. Commonly, business goals are neither obvious nor explicitly stated. In some cases, you may even have difficulty expressing these goals clearly and consistently. During this stage, the analyst must extract and describe business goals, priorities, and circumstances in order to understand what kinds of software risks to care about and which business goals are paramount. Business goals include but are not limited to increasing revenue, meeting service-level agreements (SLAs), reducing development costs, and generating high return on investment (ROI). The purpose of this stage is to gather data to answer the all-important “Who cares?” question.
Business risks directly threaten one or more business goals. The identification of such risks helps to clarify and quantify the possibility that certain events will directly impact business goals. Business risks have impacts that include direct financial loss, damage to brand or reputation, violation of customer or regulatory constraints, exposure to liability, and increase in development costs. The severity of a business risk should be expressed in financial or project management terms. These include but are not limited to market share (percentage), direct cost, level of productivity, and cost of rework.
Business risk identification helps to define and steer use of particular technical methods for extracting, measuring, and mitigating software risk given various software artifacts. The identification of business risks provides a necessary foundation that allows software risk (especially impact) to be quantified and described in business terms. This makes impact statements tangible and spurs action on risk mitigation.
The key to making risk management work for any business lies in tying technical risks to the business context in a meaningful way. The ability to thoroughly identify and understand risks is thus essential. Uncovering and recognizing technical risks is a high-expertise undertaking that usually requires years of experience. But on their own, out of the business context, technical risks are often not actionable.
Central to this stage of the RMF is the ability to discover and describe technical risks and map them (through business risks) to business goals. A technical risk is a situation that runs counter to the planned design or implementation of the system under consideration. For example, a technical risk may give rise to the system behaving in an unexpected way, violating its own design strictures, or failing to perform as required. If the builders do not make proper use of touchpoints, these kinds of risks may slip by unnoticed. Technical risks can also be related to the process of building software. The process an organization follows may offer too many opportunities for mistakes in design or implementation. Technical risks involve impacts such as unexpected system crashes, avoidance of controls (audit or otherwise), unauthorized data modification or disclosure, and needless rework of artifacts during development.
Technical risk identification is supported by the software security touchpoints described throughout this book.
Large numbers of risks will be apparent in almost any given system. Identifying these risks is important, but it is the prioritization of them that leads directly to creation of value. Through the activities of synthesizing and prioritizing risks, the critical “Who cares?” question can (and must) be answered. Synthesis and prioritization should be driven to answer questions such as: “What shall we do first given the current risk situation?” and “What is the best allocation of resources, especially in terms of risk mitigation activities?” Clearly, the prioritization process must take into account which business goals are the most important to the organization, which goals are immediately threatened, and how likely technical risks are to manifest themselves in a way that impacts the business. This stage creates as its output lists of all the risks and their appropriate weighting for resolution.
Typical risk metrics include but are not limited to risk likelihood, risk impact, risk severity, and number of risks emerging and mitigated over time. Collection and display of these metrics can be automated. The Cigital Workbench, which automates parts of the RMF, including collection and display of metrics over time, is described later in the chapter.
One of the big problems in software security is that technical analysts are pretty good at finding technical problems and pointing them out, but not so good at determining what to do about them.[3] Nobody wants to hear about their problems without hearing some suggested fixes. A risk analysis is only as good as the mitigation strategy it contains.
Given a set of risks and their priorities from stage 3, the next stage is to create a coherent strategy for mitigating the risks in a cost-effective manner. Any suggested mitigation activities must take into account cost, implementation time, likelihood of success, completeness, and impact over the entire corpus of risks. A risk mitigation strategy must be constrained by the business context and should consider what the organization can afford, integrate, and understand. The strategy must also directly identify validation techniques that can be used to demonstrate that risks are properly mitigated.
Typical metrics to consider during this stage are financial in nature and include estimated cost takeout, ROI, method effectiveness in terms of dollar impact, and percentage of risk coverage (related in terms of removing costly impact).
Once a mitigation strategy has been defined, it must be executed. Those artifacts where problems have been identified (e.g., architectural flaws in a design, requirements collisions, coding errors, or problems in testing) should be rectified. Risk mitigation is carried out according to the strategy defined in stage 4. Progress at this stage should be measured in terms of completeness against the risk mitigation strategy. Good status metrics include but are not limited to progress against risks, open risks remaining, and any artifact quality metrics previously identified.
This stage also involves carrying out the validation techniques previously identified. The validation stage provides some confidence that risks have been properly mitigated through artifact improvement and that the risk mitigation strategy is working. Testing can be used to demonstrate and measure the effectiveness of risk mitigation activities. The central concern at this stage is to validate that software artifacts and processes no longer bear unacceptable risk. This stage should define and leave in place a repeatable, measurable, verifiable validation process that can be run from time to time to continually verify artifact quality.
Typical metrics employed during this stage include artifact quality metrics as well as levels of risk mitigation effectiveness.
The importance of the central activity of identifying, tracking, storing, measuring, and reporting software risk information cannot be overemphasized. Successful use of the RMF depends on continuous and consistent identification and storage of risk information as it changes over time. A master list of risks should be maintained during all stages of RMF execution and continually revisited. At Cigital, we use a tool called the Workbench to track risk information. Before the Workbench existed, we used Excel spreadsheets.
Measurements regarding this master list make excellent reporting fodder. For example, the number of risks identified in various software artifacts and/or software lifecycle phases can be used to identify problem areas in the software process. This makes topnotch driving data for defect phase containment activities, the gist being to figure out where in the software lifecycle problems are born. Likewise, the number of risks mitigated over time can be used to show concrete progress as risk mitigation activities unfold.
The RMF shown in Figure 2-1 has an obvious loop. This loop is meant to graphically represent the idea that risk management is a continuous process. That is, identifying risks only once during a software project is insufficient. The idea of “crossing off a particular stage” once it has been executed and never doing those activities again is incorrect. Though the five stages are shown in a particular serial order in Figure 2-1, they may need to be applied over and over again throughout a project, and their particular ordering may be interleaved in many different ways.
There are two main reasons for this complication. First, risks can crop up at any time during the software lifecycle. One natural way to apply a cycle of the loop is during each particular software lifecycle phase. For example, software risks should be identified, ranked, and mitigated (one loop) during requirements and again during design (another loop). Second, risks can crop up between stages, regardless of where in the process a project finds itself.[4]
In addition to the issue of continuous looping is a further complication regarding level of application. Put simply, the RMF is fractal. In other words, the entire process can be applied at several different levels. The primary level is the project level. Each stage of the loop clearly must have some representation during a complete project in order for risk management to be effective. Another level is the software lifecycle phase level. The loop will most likely have a representation at the requirements phase, the design phase, the architecture phase, the test planning phase, and so on. A third level is the artifact level. The loop will have a representation during both requirements analysis and use case analysis, for example. Fortunately, a generic description of the validation loop as a serial looping process is sufficient to capture critical aspects at all of these levels at once.
In order to facilitate the learning process, this chapter presents the RMF as a series of stages, tasks, and methods that can be performed in succession, each stage following a particular process and producing a new set of work products and metrics that enhances and clarifies previously created data sets. In reality I describe how the RMF encompasses a particular cycle of the loop that is repeatedly executed on more than one level. The RMF loop restarts continuously so that newly arising business and technical risks can be identified and the status of existing risks currently undergoing mitigation can be kept up.
Understanding that the risk management process is by nature cumulative, and at times arbitrary and difficult to predict (depending on project circumstances), is an important insight. Given this insight, I acknowledge that the practice of specific RMF stages, tasks, and methods (as described serially here, for pedagogical reasons) may occur independently of one another, in parallel, repeatedly, and unsystematically.
Analysts may “skip through” an analytical process, as information gained from the performance of one activity may require the analyst to perform an activity located earlier, or several steps later, in the process cycle. For instance, after finding a rare technical risk, an analyst may need to conduct additional research prior to reprioritizing the risk tables and updating the risk mitigation strategy. In light of our discussion, users of the RMF should focus more on the basic concepts and activities presented here than on the particular order they are presented in.
In practice, less experienced analysts should rely on following these processes as closely as possible, preserving order, and proceeding in continuous loops. Expert analysts are likely to devise work patterns that use the concepts and processes described here, but in a less ordered way.
Now that we have a basic understanding of the RMF and its five stages, we can push down a level or two into the details of its application. I use the fictional company KillerAppCo’s iWare 1.0 Server product as an example. Don’t forget that we’re still following the five stages as described earlier. It may be useful to refer back to Figure 2-1 from time to time to track where we are.
Although the RMF is a multilevel loop, the remainder of this chapter describes the RMF as a series of stages, tasks, and methods to be performed in succession. The idea is to step through an imaginary example (in this case, KillerAppCo is producing iWare 1.0 Server) and show the kinds of tasks and work products that the RMF suggests. I’ve already given you a bird’s-eye view of the five stages; now it’s time to roll up our sleeves and get our hands dirty. In the following treatment, each of the five stages previously introduced follows a process to produce various tables and metrics that build on each other.
This example is overly simple. In a normal application of the RMF, it is not unusual for 30 to 50 risks to be identified and tracked. Thus the sizes and makeup of the tables shown in this section would vary.
An enhanced version of the RMF has been automated in order to make following the various processes described here more intuitive and less tedious (see the description of the Cigital Workbench near the end of this chapter).
During the first stage of RMF execution, an analyst must extract and describe business goals, priorities, and circumstances in order to understand what kinds of software risks to care about and which business goals are paramount.
The first step is to obtain documentation about target system resources and artifacts. This is a good time to identify any missing resources necessary for the analysis but not in hand. Typical resources include system architecture (especially with regard to software), accounts, permissions, environments, documents, software artifacts, automated documents, data, and supporting materials.
After collecting the artifacts and resources, it is important to validate that they are the correct versions and that the set is complete. Note that an analyst may discover the need to obtain additional system resources and/or to collect additional software artifacts at any point in applying the RMF.
An analyst should research the business, program, processes, systems, products, and technologies to the extent dictated by the project’s scope. This work should be done independently. In particular, an analyst characterizes the system and may author draft documents and illustrations that summarize the system. One example that almost always comes in handy is a one-page overview of the system’s software architecture (see Chapter 5). If a forest-level view is not available, it should be created as early as possible in the RMF process. At this point the analyst should also determine any technical, management, and operational controls that the project currently has in place to detect or prevent software risk.
The scope of the RMF project and the size and complexity of the system under review may not allow a uniform approach to analysis across the entire system. To resolve this problem, the analyst should examine the overall system and make an effort to decompose it into a reasonably small set of manageable components. These components comprise the system’s software architecture (and should thus be represented in the one-page architectural overview).
Each component and the interfaces between them can be analyzed separately by applying a different level of rigor. Depending on function and importance, a subsystem may reside in one component or may be made up of multiple components. The importance of each subsystem is assessed in terms of the identified business goals. All subsystems are subsequently prioritized based on the identified business goals, and a decision is made based on the scope of the RMF project about the depth of the analysis that will be conducted against each subsystem. This approach goes hand-in-hand with the concept of risk management, as the depth of the analysis of any subsystem depends on the importance of the subsystem, and the analyses of different subsystems is likely to shed light on the quality and security of the software system in general.
At the end of the research activities, the risk posture of the entire system is examined based on the results obtained for each of the subsystems and their interactions. Knowledge and experience with analysis of similar systems is extremely helpful in this process.[5] During performance of this research, analysts generate research notes and gain a general understanding of the business context, how the target products work, and the role that software plays in the final product.
The identification of business risks provides a necessary foundation that allows software risk (especially its impact component) to be quantified and described in business terms. Business risk identification helps to define and steer use of particular technical methods for extracting, measuring, and mitigating software risk given various software artifacts.
Preliminary research results should be organized so that an initial set of business risks is identified. At this point, developing a set of risk questions to ask about the project is an important step. These questions should address business risks (e.g., motivation, market, resource, schedule, people, facilities, budget, contracts, program interfaces), project risks (e.g., development process, development system, management methods, work environment), and product risks (e.g., technical defects, design flaws, bugs, issues with languages and platforms).
Particular effort should be made to address questions regarding risk indicators, the likelihood that risks may occur, and business impact estimates in case risks materialize. Questions should directly address the project’s concerns, how the target technologies work, the fundamental assumptions built into the target, and expected quality and security requirements.
After developing a set of risk questionnaires, the analyst must identify the RMF project’s key information sources and schedule independent interviews with each of the following types of personnel:
Upper management
Project management
Architects
Developers
Testers
Other technical personnel, such as configuration managers, as well as subject matter experts and end users may also be interviewed. An independent interview approach permits the interviewee to openly disclose and discuss sensitive, critical information without bias or constraints that may be imposed by the presence of others. In most cases, two analysts—a facilitator who asks the questions and a recorder who scribes the responses—interview the principals to ensure efficiency and accuracy.
During an interview, the analyst:
Collaborates with the interviewee to validate the comprehensiveness and accuracy of the draft summary documentation
Employs the risk questionnaire as a reference to question the interviewee (not a script)
Records the interviewee’s answers to the questionnaire as well as other pertinent information discussed during the interview
Identifies content presented by the interviewee that is inconsistent with the analyst’s present knowledge set, resolves any inconsistencies, and documents the necessary changes
Based on an analysis of the quality of the interview results, and the number and type of new questions that may have resulted from the interview, the analyst may elect to conduct additional research and perform additional risk discovery interviews with newly identified stakeholders to gain a better understanding of the project’s software risks and possible solutions.
After completing the first set of interviews with the project team, the analyst reviews the interview data to identify, list, and prioritize the business goals and business risks.
As an example, Table 2-1 indicates that KillerAppCo’s most important business goal, represented by the high (H) ranking, is to release the initial version of their software, iWare Server version 1.0, on January 1, 2008, so that the company can be first-to-market and secure an estimated 25% market share prior to its competitor’s entry. KillerAppCo’s next most important business goal, ranked as moderate (M), is for the iWare 1.0 Server to meet its Fortune 500 end-user availability requirements: 99.999% uptime, not including normal maintenance and upgrade activities.
Table 2-1. KillerAppCo’s Prioritized Business Goals
Rank | Business Goal | Description |
|---|---|---|
H | TIME TO MARKET iWare 1.0 Server must be released on January 1, 2008. | KillerAppCo desires to release iWare 1.0 on January 1, 2008, to achieve first-to-market status, which will enable KillerAppCo to secure 25% of the market prior to competitor entry. |
M | AVAILABILITY iWare 1.0 Server must provide 99.999% uptime. | A large share of the iWare 1.0 Server market consists of Fortune 500 companies with whom KillerAppCo will have SLAs. The server’s availability is a critical factor in enabling KillerAppCo to meet the SLA requirements. |
M | ACCURACY Transactions must be recorded with 100% accuracy, with no invalid, duplicate, or missing transactions. | Federal regulations stipulate that iWare 1.0 Server must perform all financial transactions with 100% accuracy. |
Another of KillerAppCo’s moderate business goals is for the product to perform all transactions with 100% accuracy, as required by federal financial regulations and standards. Table 2-2 provides very rough guidelines for ranking business goals.
Table 2-2. Guidelines for Business Goal Rankings (from NIST)
Rank | Definition |
|---|---|
Note: New analysts should use the business goal ranking definitions in this table as guidelines only. Ideally, analysts should attempt to define these rankings early in the RMF project process in terms of the project’s unique business context. More senior analysts can draw on prior experience to help define these rankings against previous performance and comparable industry benchmarks. | |
High (H) | These goals are critical to the existence of the project (and possibly the company). If these goals are not met, there is a real risk that the project will cease to exist and the company will be directly impacted. |
Medium (M) | These goals are very important for the existence of the project (and possibly the company). A large number of employees may be affected if these goals are not met. A failure to achieve a medium-rank business goal (e.g., to successfully release an important project) may result in a negative affect to high-rank goals (e.g., damage to the company’s brand and reputation). |
Low (L) | These goals affect only a small portion of the company’s revenue. A small number of employees may be affected if these goals are not met. |
After listing and prioritizing the business goals, the analyst analyzes the data gathered to identify and list the business risks.
As indicated in Table 2-3, in our example, the analyst identifies and records four business risks. A similar table should be created as a work product in each application of the RMF.
Table 2-3. KillerAppCo’s Business Risks
Description | |
|---|---|
The software fails to meet the acceptance criteria required for release. | The software may fail user acceptance testing criteria. Such failure will affect the release date, negatively affecting the time to market and possibly the company’s brand and reputation. The share price of a publicly owned company may be negatively impacted. |
System failures cause unplanned downtime. | Any unplanned downtime caused by system failures negatively affects the revenue from the project. In case of the existence of an SLA, this may cause direct monetary loss for the company. Unplanned downtime requires additional resources to execute disaster recovery plans and, possibly, to manually process the data usually processed by the system. News about the unplanned downtime may damage users’ perceptions about the system and negatively affect users’ demand for the system’s services. The share price of a publicly owned company may be negatively impacted. |
Security weaknesses cause system failures. | A successful attack against a system negatively affects many business goals at once. First, a successful attack demonstrates that the system is not robust, something that negatively affects the public’s perception of the system. This, in turn, causes a decrease in the demand for system services and a decline in revenue. Every successful attack requires investigation and disaster recovery efforts. These efforts consume additional resources, negatively affecting the bottom line. The share price of a publicly owned company may be negatively impacted. |
The software fails to perform critical operational functions correctly. | The failure of the system to perform critical operational functions negatively affects users’ interest in the system. The use of the system may decline, thus negatively affecting revenue. Large efforts may be needed to apply fixes to shore up system functionality. These efforts may be resource-intensive and will negatively affect the bottom line of the product. News about the failure of the system may damage the company’s brand and reputation, and the share price of a publicly owned company may be negatively impacted if the information about the failures makes it to the media. |
After fully populating business risk tables with data (the tables shown here present a very small amount of example data), the analyst identifies the risk indicators associated with each identified business risk, as well as the likelihood that each of the identified risks will occur. A risk indictor is a sign that the risk is materializing, an objective, measurable event that can be monitored and measured by the analyst to determine the status of a risk over time.
As an example, Table 2-4 identifies the principle risk indicators for the four business risks shown in Table 2-3. For example, one indicator for the risk of failing to meet the acceptance criteria is the number of missed project milestones. Based on experience, professional consultation, and research, the analyst assigns the likelihood that the server will not meet the final acceptance criteria as high (H) (as defined in Table 2-5 on page 56). The analyst also defines indicators for the remaining business risks and assigns the probability of their occurrence as moderate (M). The impact of business risks on business goals should be evaluated. The level of impact and the likelihood of occurrence will allow the analyst to evaluate the impact of a business risk on different business goals.
Table 2-4. KillerAppCo’s Business Risk Indicators and Likelihood of Occurrence
Table 2-5. Risk Likelihood Scale (from NIST)
Likelihood Value | Definition |
|---|---|
Note: New analysts should use the risk likelihood definitions in this table as guidelines only. Ideally, analysts should attempt to define these rankings early in the RMF project process in terms of the project’s unique business context. More senior analysts should draw on prior experience to help define these rankings against historical performance or comparable industry benchmarks. The analyst should in all cases document the reasons for selecting the likelihood value of an event. | |
High (H) | The threat is highly motivated and sufficiently capable, and controls to prevent the risk from occurring are ineffective. |
Medium (M) | The threat is motivated and capable, but controls are in place that may impede successful materialization of the risk. |
Low (L) | The threat lacks motivation or capability, or controls are in place to prevent or at least significantly impede the risk from occurring. |
Table 2-5 shows likelihood values and definitions that analysts can use to determine the likelihood that a risk will occur.
After identifying the risk indicators and likelihood probabilities of each business risk, the analyst determines the business impact of each business risk in case the risk materializes. This determination is made by qualitatively describing each risk’s impact, including an estimation of the total cost of a materialized risk.
For example, in Table 2-6, the analyst specifies that if the iWare 1.0 Server is unable to meet its final acceptance criteria, KillerAppCo will be unable to release the product to the general public on January 1, 2008, and will experience significant business loss due to schedule slippage. The analyst also notes that forecasts currently estimate a product release date of April 1, 2008. Based on initial market analyses, the analyst concludes that the estimated revenue loss due to the protracted schedule is $10 million. Market share loss is also estimated to be 15% and limited brand damage may occur. Given the significance of these drawbacks, a high (H) business impact rating is used (as defined in Table 2-7). The impacts and costs of the remaining three business risks are also defined by the analyst, and the business impact rating for them is determined to be medium (M).
Table 2-6. Business Impacts of KillerAppCo’s Business Risks
Business Risk Indicators | Likelihood | Impact | Estimated Cost | Impact | |
|---|---|---|---|---|---|
The software fails to meet the acceptance criteria required for release. | Number of missed project milestones | H | KillerAppCo will be unable to release the product to the market. | Revenue loss: $10 million Market share loss: 15% Brand and reputation damage: limited | H |
System failures cause unplanned downtime. | Clients reporting downtime due to system failures Need to execute disaster recovery plans | M | KillerAppCo will be unable to meet its clients’ SLA availability requirements. | Revenue loss: $3 million Market share loss: 5% Brand and reputation damage: extreme | M |
Security weaknesses cause system failures. | Clients reporting system failures due to security breeches Need to create software patches | M | KillerAppCo will be unable to meet its clients’ SLA availability requirements. | Revenue loss: $3 million Market share loss: 5% Brand and reputation damage: extreme Regulatory violation Legal risk | M |
The software fails to perform critical operational functions correctly. | Clients reporting inaccurate transaction data processing Liability case filed | M | KillerAppCo will be noncompliant with federal regulations. Lawsuits will ensue. | Revenue loss: $2 million Market share loss: 2% Brand and reputation damage: extreme Regulatory violation Legal risk | M |
Table 2-7. Business Impact Scale (from NIST)
Business Impact Value | Definition |
|---|---|
Note: New analysts should use the business impact definitions in this table as guidelines only. Ideally, analysts should attempt to define these rankings early in the RMF project process in terms of the project’s unique business context. More senior analysts can draw from prior experience to help define these rankings against historical performance or comparable industry benchmarks. In the final analysis, analysts should define business impact in terms of financial impact: revenue and market share loss. Other primary determinants are liability exposure, brand and reputation damage, and productivity loss. | |
High (H) | (1) Very costly loss of major tangible assets or resources; (2) significant violation of, or harm or impediment to, an organization’s mission, reputation, or interest; or (3) human death or serious injury. |
Medium (M) | (1) Costly loss of tangible assets or resources; (2) violation of, or harm or impediment to, an organization’s mission, reputation, or interest; or (3) human injury. |
Low (L) | (1) Loss of some tangible assets or resources; or (2) a noticeable effect on an organization’s mission, reputation, or interest. |
Table 2-7 shows values that can be used to rate the business impact caused by specific business risks. After assessing the business impact of each business risk, the analyst determines each risk’s severity, which is a function of the likelihood that the risk will occur (Table 2-5) and the risk’s business impact (Table 2-7).
In our example, the likelihood that iWare 1.0 Server will be unable to meet its final acceptance criteria is high, and the business impact rating of the risk is also high. By referencing Table 2-8, the analyst deduces that high likelihood and high impact produce a high (H) severity score. The severity scores of the three remaining business risks are determined by the analyst to be medium (M).
Table 2-8. Risk Severity Key (from NIST)
Likelihood | Impact | ||
|---|---|---|---|
Low | Medium | High | |
Note: New analysts should use the risk severity key definitions defined in this table as guidelines only. Ideally, analysts should attempt to define custom business impact levels (similar to what the International Electrotechnical Commission [IEC] refers to as Safety Integrity Levels, or SILs). The idea is to create a set of target quality metrics for each type of software subsystem or system component to be implemented. That is, the analyst should develop relative target failure and success metrics for each system or system component related to stated quality goal(s). (See IEC 61508; Parts 3, 6 and 7; Version 12.0 05/12/97 [IEC 61508].) The integrity levels may be expressed in terms of low, medium, and high as defined by underlying “cut levels” or target metrics dictated by quality goals. Experienced analysts can draw on prior experience to help define these rankings against historical performance or comparable industry benchmarks. | |||
High (H) | L | M | H |
Medium (M) | L | M | M |
Low (L) | L | L | L |
The following severity value descriptions are used to rate business risks: | |||
| |||
After determining the severity score of each business risk, the analyst compiles the full set of business risk data. An example of the resulting table is presented in Table 2-9.
Table 2-9. KillerAppCo’s Full Set of Business Risk Data
Business Risk Indicators | Likelihood | Impact | Estimated Cost | Impact | Severity | |
|---|---|---|---|---|---|---|
The software fails to meet the acceptance criteria required for release. | Series of major project milestones missed | H | KillerAppCo will be unable to release the product to the market. | Revenue loss: $10 million Market share loss: 15% Brand and reputation damage: limited | H | H |
System failures cause unplanned downtime. | Clients reporting downtime due to system failures Need to execute disaster recovery plans | M | KillerAppCo will be unable to meet its clients’ SLA availability requirements. | Revenue loss: $3 million Market share loss: 5% Brand and reputation damage: extreme | M | M |
Security weaknesses cause system failures. | Clients reporting system failures due to security breeches Need to create software patches | M | KillerAppCo will be unable to meet its clients’ SLA availability requirements. | Revenue loss: $3 million Market share loss: 5% Brand and reputation damage: extreme Regulatory violation Legal risk | M | M |
The software fails to perform critical operational functions correctly. | Clients reporting inaccurate transaction data processing Liability case filed | M | KillerAppCo will be noncompliant with federal regulations. Lawsuits will ensue. | Revenue loss: $2 million Market share loss: 2% Brand and reputation damage: extreme Regulatory violation Legal risk | M | M |
This stage of the RMF also involves discovering and describing technical risks and mapping them to business goals. A technical risk is a situation that runs counter to the planned design or implementation of the system under consideration.
The analyst begins to evaluate software artifacts by performing selected analytical best practices (including the software security touchpoints), some of which require the execution of tools, to help identify technical risks.
Table 2-10 presents technical risks resulting from the application of software security touchpoints. In our example, the analyst discovers technical risks that may threaten KillerAppCo’s time-to-market, availability, and accuracy business goals. Note that a technical risk may yield multiple business impacts (see TR3 and TR5 in Table 2-10).
Table 2-10. KillerAppCo’s Technical Risks
ID # | Technical Risk |
|---|---|
TR1 | Developers do not have access to quality assurance (QA) tools for unit testing. |
TR2 | QA tests do not fully evaluate requirements. |
TR3 | A. Testing does not cover fault tolerance. System failures are likely. |
B. Testing does not cover fault tolerance. Hardware failures can create incorrect transactions. | |
TR4 | System is susceptible to denial-of-service attacks. |
TR5 | A. Poor random number generation (RNG) makes crypto weak. Unauthorized access may cause system crashes or unexplained behavior. |
B. Poor RNG makes crypto weak. Attackers can influence transactions or create illegitimate transactions. | |
TR6 | Poor enforcement of access control rules allows misuse by insiders and outsiders. |
TR7 | Poor password choices make system attacks easier. Unauthorized access can create invalid transactions. |
TR8 | System does not require good passwords. Attackers can get in more easily and cause unpredictable behavior. |
Now it’s time to determine the indicator(s) associated with each identified technical risk and specify the probability that each risk will materialize. In Table 2-11, the analyst specifies two indicators for the TR4 denial-of-service (DoS) susceptibility risk: a post-deployment increase in unauthorized logins and a post-deployment decrease in mean server availability. Based on independent research, professional experience, and expert collaboration, the analyst also determines the likelihood that the DoS susceptibility risk will occur is high (H). Each remaining technical risk’s indicator and likelihood are also defined.
Table 2-11. KillerAppCo’s Categorized Technical Risks and Likelihood of Occurrence
ID # | Technical Risk | Technical Risk Indicators | Likelihood |
|---|---|---|---|
Note: When determining the likelihood that a technical risk will materialize and ascertaining its business impact, analysts should consider controls (e.g., management, operational, and technical) and characteristics (e.g., type of attack, capability of the attacker, intent of the attacker, and resources of the attacker) associated with the risk. Sometimes functionality gets into a product that none of the product managers or higher-level executives know about or think about strategically. You may find these kinds of things by looking into the code and asking questions (which usually get answered like this: “Oh, yeah. Without that, the system doesn’t work for our clients who use Oracle.”). At this point it is worth a pause to think. Perhaps you found a business goal that the stakeholders don’t focus enough attention on. Business goal omissions are problematic because these omissions lead to requirements omissions, and in turn to design decisions that ripple back and forth along the interface with implementation and support of the real production environments. For an example, see NIST Special Publication 800-53, “Recommended Security Controls for Federal Information Systems” [NIST 800-53]. | |||
TR1 | Developers do not have access to QA tools for unit testing. | Number of development-phase bugs reported | H |
TR2 | QA tests do not fully evaluate requirements. | Number of requirements-phase bugs reported post-implementation | H |
TR3 | A. Testing does not cover fault tolerance. System failures are likely. | Number of faults reported | H |
B. Testing does not cover fault tolerance. Hardware failures can create incorrect trans actions. | Number of inaccurate transactions | ||
TR4 | System is susceptible to denial-of-service attacks. | Number of unauthorized logins | H |
Mean server availability | |||
/TR5 | A. Poor RNG makes crypto weak. Unauthorized access may cause system crashes or unexplained behavior. | Number of unauthorized logins | H |
B. Poor RNG makes crypto weak. Attackers can influence transactions or create illegitimate transactions. | Number of unauthorized accesses | ||
Number of inaccurate transactions | |||
TR6 | Poor enforcement of access control rules allows misuse by insiders and outsiders. | Number of unauthorized accesses | H |
Number of IDS anomalies | |||
TR7 | Poor password choices make system attacks easier. Unauthorized access can create invalid transactions. | Number of unauthorized accesses | H |
Number of inaccurate transactions | |||
TR8 | System does not require good passwords. Attackers can get in more easily and cause unpredictable behavior. | Number of unauthorized logins and accesses Number of IDS anomalies | H |
After determining the likelihood that an identified technical risk will occur, the analyst estimates the business impact of each technical risk should it materialize. This link back to business impact is essential.
In the example, the analyst documents that poor RNG implementation may lead to system failures, unexplained behavior, and inaccurate transactions (see Table 2-12). Because of this technical vulnerability, unauthorized users can gain access to the system, cause system crashes or unexplained behavior, influence transactions, or create illegitimate transactions. Business impacts are defined by the analyst for each remaining technical risk. If different subsystems are analyzed separately, a cumulative analysis of risks associated with different subsystems is performed. At this time, inter-subsystem risks should also be identified.
Table 2-12. Impacts of KillerAppCo’s Technical Risks
Technical Risk | Technical Risk Indicators | Likelihood | Impact | |
|---|---|---|---|---|
TR1 | Developers do not have access to QA tools for unit testing. | Number of development-phase bugs reported | H | The inaccessibility of QA tools for developers to use in unit testing may lead to QA problems and acceptance criteria failures. |
TR2 | QA tests do not fully evaluate requirements. | Number of requirements-phase bugs reported post-implementation | H | The partial evaluation of requirements by QA tests may lead to QA problems and acceptance criteria failures. |
TR3 | A. Testing does not cover fault tolerance. System failures are likely. B. Testing does not cover fault tolerance. Hardware failures can create incorrect transactions. | Number of faults reported Number of inaccurate transactions | H | Lack of fault tolerance test coverage may lead to unplanned downtime and inaccurate critical operations. |
TR4 | System is susceptible to denial-of-service attacks. | Number of unauthorized logins Mean server availability | H | DoS susceptibility may lead to unplanned downtime. |
TR5 | A. Poor RNG makes crypto weak. Unauthorized access may cause system crashes or unexplained behavior. B. Poor RNG makes crypto weak. Attackers can influence transactions or create illegitimate transactions. | Number of unauthorized logins Number of unauthorized accesses Number of inaccurate transactions | H | Poor RNG implementation may lead to system failures, unexplained behavior, and inaccurate transactions. |
TR6 | Poor enforcement of access control rules allows misuse by insiders andoutsiders. | Number of unauthorized accesses Number of IDS anomalies | H | Poor access rule enforcement may lead to unexplained behavior and system failures. |
TR7 | Poor password choices make system attacks easier. Unauthorized access can create invalid transactions. | Number of unauthorized accesses Number of inaccurate transactions | H | Poor password choices may lead to unauthorized logons and inaccurate transactions. |
TR8 | System does not require good passwords. Attackers can get in more easily and cause failures. unpredictable behavior. | Number of unauthorized logins and accesses Number of IDS anomalies | H | The system’s failure to require good passwords may lead to unexplained behavior and system |
Only after the RMF project team is fully satisfied with the initial set of collected business and technical risk data can the analyst proceed to the risk synthesis and prioritization stage. Peer review is an excellent idea.
To better understand and manage risk, analysts establish relationships between the business goals, business risks, and technical risks and subsequently prioritize them in meaningful business terms. The initial objective may be achieved from the bottom up by first determining the technical risks that lead to each business risk(s) and then determining the business risks associated with each business goal. Analysts can also work from the top down, starting with business goals. In either case, to visualize the problem, analysts create the goal-to-risk relationship table, which displays the relationships between:
Business goals
Business risks
Technical risks (by identification number)
Note that no attempt is made at this point to set priorities in the goal-to-risk relationship table because this action is performed during the following synthesis activity.
As an example, in Table 2-13 the analyst concludes, based on research, professional experience, and expertise, that KillerAppCo’s unplanned downtime and system failure business risks directly correspond with the availability goal. The analyst also notes how inadequate fault tolerance testing and DoS susceptibility feed the business risk of unplanned downtime. A similar linkage is created between poor password requirements, inadequate RNG implementation, and limited enforcement of access rules and their collective contribution to the business risk of system failure. Similar relationships are drawn by the analyst for the project’s time-to-market and accuracy business goals.
Table 2-13. KillerAppCo’s Goal-to-Risk Relationship Table
Business Goal | Business Risk | ID # | Technical Risk |
|---|---|---|---|
TIME TO MARKET iWare 1.0 Server must be released on January 1, 2008. | The software fails to meet the acceptance criteria required for release. | TR1 | Developers do not have access to QA tools for unit testing. |
TR2 | QA tests do not fully evaluate requirements. | ||
AVAILABILITY iWare 1.0 Server must provide 99.999% uptime. | System failures cause unplanned downtime. | TR3 | A. Testing does not cover fault tolerance. System failures are likely. |
TR4 | System is susceptible to denial-of-service attacks. | ||
Security weaknesses cause system failures. | TR8 | System does not require good passwords. Attackers can get in more easily and cause unpredictable behavior. | |
TR5 | A. Poor RNG makes crypto weak. Unauthorized access may cause system crashes or unexplained behavior. | ||
TR6 | Poor enforcement of access control rules allows misuse by insiders and outsiders. | ||
ACCURACY Transactions must be recorded with 100% accuracy, with no invalid, duplicate, or missing transactions. | The software fails to perform critical operational functions correctly. | TR7 | Poor password choices make system attacks easier. Unauthorized access can create invalid transactions. |
TR5 | B. Poor RNG makes crypto weak. Attackers can influence transactions or create illegitimate transactions. | ||
TR3 | B. Testing does not cover fault tolerance. Hardware failures can create incorrect transactions. |
There may be a one-to-many relationship among an identified technical risk and the multiple business risks to which it is related. Note, for example, that the inadequate fault tolerance testing risk (TR3) contributes to both the unplanned downtime and inaccurate operational functions business risks.
After developing the goal-to-risk relationship table, the analyst is ready to create a table showing the technical risk severity by business goals. This table depicts how severely an identified technical risk impacts each of the business goals. To determine the severity level, the analyst assesses the likelihood that the technical risk will materialize and builds an estimate of the realized risk’s business impacts in terms of each identified business goal.
As an example, in Table 2-14 the analyst deduces that inadequate fault tolerance testing (TR1) and DoS susceptibility (TR2) will negatively impact the project’s most important business goal—time to market—since the likelihood of the risks are high and continued acceptance criteria failures (the business risk to which the technical risks are tied) will inevitably prevent the project team from releasing the product on time. No impact (N/A) is discerned between TR1 and TR2 and the other business goals. Note that a single technical risk, such as poor RNG implementation (TR5), may impact multiple business goals—availability and accuracy. A single technical risk may also impact multiple business goals at different severity levels.
Table 2-14. KillerAppCo’s Technical Risk Severity by Business Goals
ID # | Technical Risk | Business Goal | ||
|---|---|---|---|---|
Time to Market (H) | Availability (M) | Accuracy (M) | ||
TR1 | Developers do not have access to QA tools for unit testing. | H | N/A | N/A |
TR2 | QA tests do not fully evaluate requirements. | H | N/A | N/A |
TR3 | A. Testing does not cover fault tolerance. System failures are likely. | N/A | H | H |
B. Testing does not cover fault tolerance. Hardware failures can create incorrect transactions. | ||||
TR4 | System is susceptible to denial-of-service attacks. | N/A | H | N/A |
TR5 | A. Poor RNG makes crypto weak. Unauthorized access may cause system crashes or unexplained behavior. | N/A | H | H |
B. Poor RNG makes crypto weak. Attackers can influence transactions or create illegitimate transactions. | ||||
TR6 | Poor enforcement of access control rules allows misuse by insiders and outsiders | N/A | H | N/A |
TR7 | Poor password choices make system attacks easier. Unauthorized access can create invalid transactions. | N/A | N/A | H |
TR8 | System does not require good passwords. Attackers can get in more easily and cause unpredictable behavior. | N/A | H | N/A |
By completing the table linking technical risk severity with business goals, analysts indicate the most severe technical risks that the project should address in order to meet prioritized business goals. In the end, the chart presents the critical risk management information necessary to make informed decisions, such as those involving release management, production, and process improvement. This marriage of business and technical concerns is a central driver to the RMF. These are the sort of data that can be used to answer the all-important “Who cares?” question.
Next, the analyst schedules a meeting with the RMF project team to brainstorm about the accumulated risk data. During the brainstorming session, the meeting attendees:
Confirm the accuracy and comprehensiveness of the business and technical risks
Confirm the risk likelihood, impact, and severity rankings
Confirm the relationships between business goals, business risks, and technical risks
Create a preliminary outline of the risk analysis report, which includes strategic risk mitigation content
The brainstorming activity typically produces notes as well as updated risk tables. It may also reveal the need for the RMF project team to perform additional analytical activities.
After completing all research, risk identification, and synthesis activities, the analyst creates an interim report or presentation summarizing the risk findings and outlines a preliminary risk mitigation strategy. The completed summary is submitted to the RMF project team for business and technical peer review. Note that peer review can sometimes be a time-consuming process; make sure that time is allocated both for necessary peer reviews and for the incorporation of feedback.
During this stage, the analyst builds and finalizes a risk mitigation strategy. An outline of this strategy will have been created during the risk synthesis activity. To develop a coherent strategy, the RMF project team meets to brainstorm on possible risk mitigation methods, their effectiveness, and control over the project’s software-induced business risks. Results of this work are reported in a comprehensive risk analysis report document.
During the risk mitigation brainstorming session, the RMF project team should answer the question, “How can the software risks that have been identified be managed?” Using this question as a guidepost, the RMF project team members list potential mitigation methods on a whiteboard. Next, they associate the proposed methods with identified technical risks. The group then estimates the effectiveness of the proposed mitigation methods and the level of rigor at which each method must be performed. The resulting approach is a technical strategy motivated by business concerns. Methods must make sense economically, and in the best of all cases they will have a clear ROI that can be demonstrated.
All costs of mitigation must be weighed against each method’s predicted effectiveness and compared against potential downside costs (in case a risk materializes). The RMF project team should ensure that the proposed mitigation methods cover as many of the risks as possible. Those methods that provide large risk coverage at low cost are more valuable. The team also assesses the impact of legislation, regulation, and organizational policy on the ability to perform specific mitigation methods, as well as the impact of method implementation on operations.
After strategizing activities are complete, the team creates a mapping between specific methods and the mitigation of identified business risks. The mapping is given a level of confidence (high, medium, or low). The fully populated table of recommended risk mitigation methods presents the information needed to help make risk mitigation decisions crucial to the success of the business. Using these data, stakeholders can clearly think through costs, benefits, and return for various technical activities. This table provides the basis for a description of the risk mitigation strategy.
As an example, in Table 2-15 the analyst highly recommends that the project impose additional QA activities in early SDLC phases to improve the company’s chances of meeting its number one business goal—timely release of the product to the market. Although the coverage of this mitigation method is limited to only two of the four business risks, it is estimated that the practice of the method will result in the highest possible ROI in terms of (1) avoided loss of revenue and market share and (2) bypassed brand and reputation damage (see Table 2-9). Specific QA mitigation activities may include having developers use best-of-breed QA tools for early lifecycle unit testing and evaluating requirements during QA test-planning activities.
Table 2-15. KillerAppCo’s Recommended Risk Mitigation Methods
Business Risk | Supporting Technical Risk | Risk Mitigation Mathod | ||
|---|---|---|---|---|
Improve QA in Early SDLC Phases | Add Fault Tolerance to QA Tests | Add Security Requirements and Secutiry Requirements Testing to SDLC... | ||
The software fails to meet the acceptance criteria required for release. (H) | TR1 TR2 | H H |
M | |
System failures cause unplanned downtime (M) | TR3 TR4 | M
| H M | |
Security weaknesses cause system failures. (M) | TR5 TR6 TR7 | H H H | ||
The software fails to perform critical operational functions correctly. (M) | TR3 TR5 TR7 | M
| H
|
H H |
After completing the table of recommended risk mitigation methods, the analyst authors a risk analysis report.[6] Much of the RMF project’s analytical plan content and summary risk data can be used to build the final document. The report contains the following information in this order:
An executive summary that establishes purpose, poses a clear problem statement, and motivates future action
A summary of the analytical results, which includes the following tables:
Goal-to-risk relationship
Technical risk severity by business goals
Recommended risk mitigation methods
A list of the actual risks discovered. Each risk is described in detail with:
Context
Impact description
Mitigation recommendation
Validation steps
A complete validation plan that includes the following:
A monitoring and measurement strategy
A measurement plan that lists and describes the measurements and metrics necessary to quantify the status of each risk undergoing mitigation
Procedures for collecting risk mitigation data
A list of the risk indicators to be employed during mitigation
Risk exit criteria
Conclusions that directly discuss next steps and overall themes in the risks
Appendices that include information such as:
A list of participants
A list and description of the analyzed artifacts
A list and description of the materials used
A list and description of the key metrics employed
A list and description of the analytical methods employed
By addressing the preceding information, the risk analysis report:
Identifies and prioritizes software-induced business risks
Ensures risk management becomes an integral part of the ongoing SDLC
Lists and describes the methods and technologies used to mitigate software risks
Sets up the monitors and measures that can be used to demonstrate risk mitigation progress
Defines acceptable levels of quality to attain through the practice of custom software risk management strategies and software security touchpoints
Establishes critical exit criteria linked to business goals
After completing the draft risk analysis report, the analyst presents the document to the RMF project team for peer review and subsequent editing. The analyst then uses the document as the basis for creating a draft risk mitigation project plan. The interim risk analysis report is also used to develop a risk analysis presentation to be delivered by the team. The presentation should contain a cost-based summary of the critical content included in the risk analysis report and focus on post-risk mitigation ROI. The analyst should incorporate feedback resulting from the risk analysis presentation into the final draft of the risk analysis report as well as the accompanying project plan.
This stage involves execution of the risk mitigation strategy. Each strategic approach to risk mitigation will differ according to what sorts of risks were identified, what the business context is, and what methods were chosen to manage risk.
Progress at this stage should be measured against the risk mitigation strategy. Good metrics include but are not limited to progress against risks, open risks remaining, and any artifact quality metrics previously identified.
This stage involves application of those validation techniques identified earlier in order to give some confidence that risks have been properly mitigated through artifact improvement. In many respects, the validation plan is a test plan for risk mitigation assurance. Each project will have a unique validation plan that directly depends on the risks identified and the methods chosen to address them.
Testing can be used to demonstrate and measure the effectiveness of various software assurance activities. The central concern at this stage is to validate that the artifacts and processes no longer carry unacceptable risks. This stage should define and leave in place a repeatable, measurable, verifiable validation process that the project can run from time to time to continually verify artifact quality.
One foundational approach that is critical to any science is measurement. As Lord Kelvin put it:
When you can measure what you are speaking about, and express it in numbers, you know something about it; but when you cannot measure it, when you cannot express it in numbers, your knowledge is of a meager and unsatisfactory kind: it may be the beginning of knowledge, but you have scarcely, in your thoughts, advanced to the stage of science.
Measurement is critical to the future of software security. Only by quantizing our approach and its impact can we answer questions such as: How secure is my software? Am I better off now than I was before? Am I making an impact on the problem? How can I estimate and transfer risk?
We can begin to approach the measurement problem by recycling numbers from the software literature. For example, we know that fixing software problems at the design stage is much cheaper than fixing them later in the lifecycle.[7] An IBM study reports relative cost weightings as: design, 1; implementation, 6.5; testing, 15; maintenance, 100. We also know relative cost expenditures for lifecycle stages: design, 15%; implementation, 60%; testing, 25%. These and similar numbers can provide a foundation for measuring the impact of software security.
A preliminary study reported by @stake (now part of Symantec) demonstrates the importance of concentrating security analysis efforts at the design stage relative to the implementation and testing phases (see Figure 2-2). Microsoft reports that more than 50% of the software security problems it finds are design flaws.
Risk management calls for quantitative decision support. Work remains to be done on measuring software security and software security risk, but some metrics are obvious. The most effective metrics involve tracking risk over time.
The most natural and easiest form of measurement in the RMF involves measuring and tracking information about risks and risk status at various times throughout application of the RMF. The Cigital Workbench (explained in the next section) helps to automate this activity. The fact that software development unfolds over time is a boon for measurement because a relative quantity (such as number of risks) measured at two different times can be used to indicate progress.
Risk measurements include but are not limited to:
Outstanding risks by priority
Identified risks by priority
Outstanding risks by type
Identified risks by type
Outstanding risks by subtype
Identified risks by subtype
Overall risk mitigation status percentage
Risk mitigation by priority: percentage resolved and percentage outstanding
Risk mitigation by priority: number resolved and number outstanding
Number of outstanding risks by financial impact
Number of identified risks by financial impact
Number of risks identified without defined mitigation by priority
Number of risks identified without defined mitigation by type
Risk discovery rate by priority
Risk discovery rate by type
Risk mitigation rate by priority
Risk mitigation rate by type
Number of outstanding risks by schedule impact
These kinds of measurements should be made as early as possible and as continuously as possible during the SDLC.
A key requirement for putting the RMF into practice is automating aspects of the process. Without automation, the elaborate steps of the RMF can become tedious. Those aspects best suited for automation include tracking, storing, and manipulating data about risks; displaying and measuring data about risks; and providing critical information and automation regarding processes. Note that automation like this supports the notion of ongoing, continual updating and refinement of risk data over time.
Cigital provides professional services based on applying the RMF philosophy. We created and use a toolset called the Workbench to make our jobs as consultants more efficient, effective, and consistent. The Workbench, in some sense, is an automated RMF. It is a combination of simple tools and automated processes used to help consultants assess software quality.
The Workbench has three major components:
Quality workflows and knowledge
Automated RMF[9]
Process models and detailed descriptions of software assurance methods (called “the Matrix” internally)
Deliverable templates, reporting, and metrics
Project communication and collaboration tools
A risk management dashboard, used to communicate risk mitigation status and progress (Figure 2-3)
A complete knowledge management and document management system (which in version 1 leverages the Livelink knowledge management software)
Decision criteria and guidance
Process evolution and knowledge capture
Process models built to be instantiated and adjusted in particular projects
History and knowledge catalogs
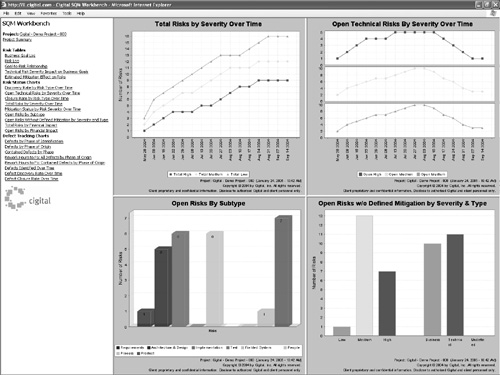
Figure 2-3. The Cigital Workbench risk management dashboard displays information about software risk and business impact over time.
These components capture fundamental aspects of the RMF.
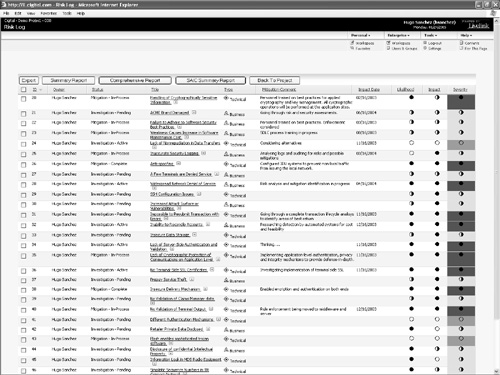
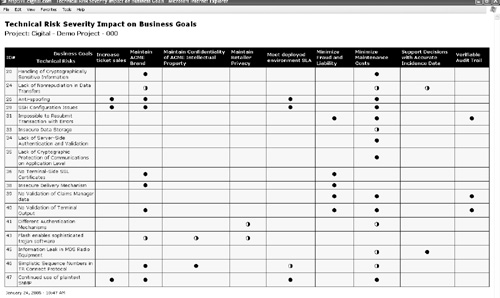
Central to the idea of the Workbench is the notion of tracking information about risks. The Workbench allows for the automatic creation of technical risk ↔ business risk associations, impact analysis, and ranking. Basic risk information is available in a risk log (Figure 2-4). Information about the relationship between business goals and technical risks is displayed in one of many available tables (Figure 2-5).
Whether you apply the RMF with the help of an automated tool, such as the Workbench, or simply track risks in an Excel spreadsheet, there is no question that identifying, synthesizing, ranking, and keeping track of risks throughout the SDLC is a central software security practice. The touchpoints described in Part II of this book are best applied in concert with this kind of RMF. That way, risks are properly handled once they are highlighted by particular software security best practices.
There is no such thing as 100% security. Only by practicing risk management and factoring in critical business information about impacts will software security escape the realm of the geeks and have an impact on business.
[1] Parts of this chapter appeared in original (more detailed) form as an internal Cigital document authored by Andrew Lefko, Stan Wisseman, Gil Matta, Paco Hope, and myself. The RMF was the brainchild of Karl Lewis and Hugo Sanchez.
[2] Or “Danger, Will Robinson, tortuous reading ahead.”
[3] This inability to determine how to fix the problems holds true for a majority of security consultants. It is always easier to break something than to design something that can’t be broken. (See Dan Geer’s Foreword.)
[4] Note that the process-agnostic view described in Chapter 1 still holds here. I am not suggesting the utility of any one software process over any other. Just like the touchpoints, the RMF is process agnostic as well.
[5] See Chapter 11 for a discussion of the kinds of knowledge useful to software security.
[6] This is not meant to imply that looping through the RMF process is complete. In this case, I am sticking with my “serial order” presentation for reasons of clarity. Also, a report is oriented toward consulting, but you get the idea.
[7] See Chapter 3, Figure 3-2.
[8] See the trade magazine article by Kevin Soo Hoo, Andrew Sudbury, and Andrew Jaquith, ““Tangible ROI through Secure Software Engineering,”” Secure Business Quarterly, Q4 2001 <http://www.sbq.com/sbq/rosi/sbq_rosi_software_engineering.pdf>.
[9] The Workbench automates a more detailed RMF than the one presented in this chapter.