
“No bug can be fixed correctly after 4:30 p.m. on Friday. The correct solution will become self-evident at 9:15 a.m. on Monday.” | ||
| --Murphy's Technology Laws | ||
IN THIS CHAPTER
The term profiling is traditionally used to describe the process of measuring the method execution times to find and fix performance bottlenecks. However, in the Java world this term has been expanded to include collecting various metrics and allowing runtime thread and object debugging. The following are some of the reasons to use a profiler for a Java application:
To investigate heap usage and garbage collection frequency to improve performance
To browse object allocation and references to find and fix memory leaks
To investigate thread allocation and synchronization to find locking and data race problems, and to improve performance
To identify expensive methods to improve performance
To investigate an application at runtime to gain a better understanding of its internal structure
Profiling is generally done after the development phase, and if you haven't used a profiler yet, it can be an eye opener. The three main high-level goals in using a profiler are to improve application performance, fix bugs that are hard to find in the code, and understand what is going on in the application at runtime as it performs the business logic.
To be effective, you need the right tools. The three best-known profilers for Java are JProbe Suite by Quest Software (originally developed by KLGroup), OptimizeIt Suite by Borland, and JProfiler by ej-technologies. All three are good and can do the job almost equally well. I like that JProfiler integrates all the functionality into one application, as opposed to having separate tools for profiling, memory debugging, and thread debugging. JProbe was probably the first tool of this kind and is still the best. Besides providing the functionality available in other tools, it provides a neat heap graph window that shows objects as rectangular nodes and allows navigating the object graphs in a variety of ways. The other tools show the object graph only as a tree, which simplifies the display but is not as visual. This, as well as the other extra features of JProbe, make it my tool of choice for memory debugging. We are going to primarily use it throughout the rest of this chapter, but you are free to select the tool you prefer or have a license for.
Garbage collection is a great feature of Java that frees developers from having to explicitly release the allocated objects. The price paid for this simplicity is the performance overhead that is incurred when the garbage collection runs. The latest versions of JVM use generational garbage collection, which can run asynchronously; even after these improvements, though, the overhead is still significant. It is easy to underestimate the effect of garbage collection on application performance.
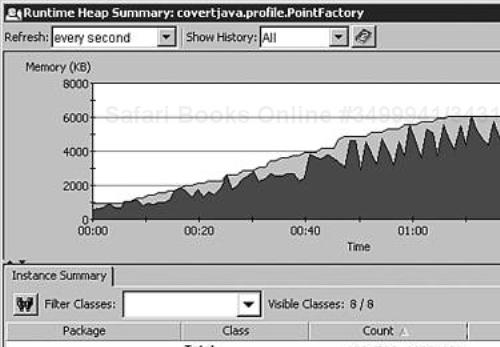
JProbe, as well as the other profilers, shows the runtime heap summary graph for a running application. It enables the monitoring of the total size of the allocated memory and the available free memory, as shown in Figure 10.1.
When there is not enough free memory to satisfy the allocation request, the JVM runs the first-generation garbage collection to free up the memory taken up by the unused objects. The first generation looks only at objects that were allocated recently to avoid time-consuming iteration of the entire object graph. If enough memory was not freed, the full garbage collection is run. The full garbage collection starts from the roots of the object tree, which are generally the objects referenced by active threads and static variables, and it identifies all the objects that can be reached from the root. The objects that are not reachable from the root (that is, the objects that are not part of a reference graph that starts from the root object) are marked for garbage collection. If the full garbage collection fails to free up enough memory, JVM checks whether it is allowed to allocate more memory from the operating system. If it has reached the maximum allowed limit or the operating system fails to supply more memory, an OutOfMemory exception is thrown.
As you can see, creating many new objects can result in complex and time-consuming operations. Instead of performing the business logic, the JVM might spend processor time on memory management. The graph in Figure 10.1 shows the memory usage of an application that does not have the maximum heap size optimized. Each drop in the amount of used heap is a result of a garbage collection. You can see that the JVM has to run garbage collection frequently because little free memory exists. The maximum value of the heap size is set using the -Xmx parameter to the java command line. Increasing the maximum heap size from 5MB to 16MB produces the heap summary graph shown in Figure 10.2.
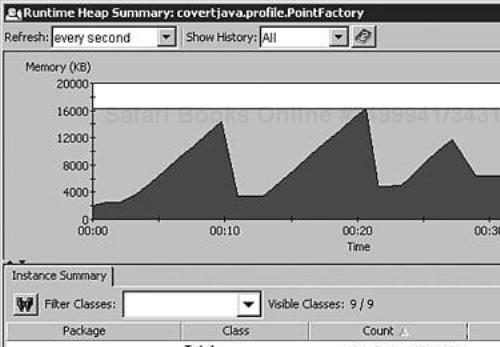
The performance of the application has significantly improved because the garbage collection was run only 3 times, compared to almost 30 times before. There is no fixed rule that can be used to determine the optimal size of the heap. Sometimes running several garbage collection cycles can be almost as fast as running one cycle that has to iterate more objects. Experimenting with the values for the initial and maximum heap sizes for a particular application is the only reliable way to find the best setting for it.
It is no longer a novelty that Java applications have memory leaks. They are not the same type of leaks that riddle lower-level languages such as C++, but they are leaks nonetheless because the memory allocated is not released back into the free pool. As you learned earlier, Java garbage collection releases the memory held by unreachable objects. If an object has a reference to it, it is not eligible for garbage collection, even if it is never used again. For example, if an object is placed into an array and never removed from it, it always stays in memory. These objects, sometimes referred to as lingering objects, over time can eat away all available free memory and result in an OutOfMemory exception. The problem is magnified when the object refers to a large tree of other objects, which is often the case in applications.
Another hazard is lingering objects that represent resources, such as database connections or temporary files. The longer an object sits in memory, the more expensive the garbage collection becomes because it has more objects to traverse. Profilers offer the best means of locating lingering objects and identifying what prevents them from being garbage collected.
Let's look at a simple example that produces lingering objects and use JProbe to find it. Suppose we are building a graphical editor and need a factory that provides an abstraction layer for the creation of Point objects. The factory implementation fragment is shown in Listing 10.1.
Example 10.1. Implementation of PointFactory
public class PointFactory {
    protected ArrayList points = new ArrayList();

    public Point createPoint(int x, int y) {
        Point point = new Point(x, y);
        this.points.add(point);
        return point;
    }

    public void removePoint(Point point) {
        this.points.remove(point);
    }
}
The createPoint method creates instances of Point and places them into an array. removePoint removes the point from the array, and PointFactory comes with a test method that creates several points through the factory. The code for the test method is shown in Listing 10.2.
Example 10.2. A Method That Tests Point Creation
public void printTestPoints() {
    for (int i = 0; i < 5; i++) {
        Point point = createPoint(i, i);
        System.out.println("Point = " + point);
    }
}
The main method of PointFactory displays a dialog box with a Print Test Points button. Clicking a button results in a call to the printTestPoints() method of PointFactory. The implementation of printTestPoints seems like perfectly valid Java code, but running it results in memory leaks. If we increase the size of the object we allocated and the number of iterations in the loop, we can quickly exhaust all the available memory. You have undoubtedly understood what is causing the leak in our example. It is easy to see because we have one class with less than 50 lines of code, but if we had hundreds of classes with complex logic, the problem would not be so evident. This is where profilers become indispensable.
To investigate the memory management of the sample code, we should configure covertjava.profile.PointFactory as a standalone application in the JProbe Memory Debugger. After running it in JProbe, the initial view shows a runtime heap summary and a class view. Because the application is small, we see only a few classes in the class view, but in a large application a filter can be applied based on the class or package name. When the application dialog box appears, looking at the classes and the instance count reveals that no java.awt.Point objects have been created yet. We click the Print Test Points button in the application and go back to the class view. We now see that five instances of Point and five instances of StringBuffer have been created. This is the obvious result of calling the printTestPoints method, which is no surprise. JProbe enables the enforcing of the garbage collection, so we do that next. After the garbage collection finishes, you should notice that the StringBuffer instances are gone but that the points are still in the memory. Repeating the test starting from the Print Test Points button increases the number of Point instances to 10. This confirms our claim that memory leaks exist, and we are now going to find out why the points are lingering in memory.
After you have identified the instance that is not being released, you have several options for finding what prevents it from being garbage collected: examining the source code manually, browsing the reference tree in a profiler, and finding all the paths to the root in a profiler.
Going through the source code and finding all the places where the instance is created can help you figure out whether some of the references to it do not go out of scope and are not nullified. Profilers can usually show the allocation point for an instance, which can help with the task. This is a brute-force approach that can be time-consuming. A more sophisticated way, and sometimes the only feasible way, is to take a runtime heap snapshot and then browse through it looking at the object in question. Instead of manually tracking the possible references to an instance in the source code, browsing the heap snapshot enables you to navigate the runtime references that are actually holding the object in memory. Most profilers show the referrers (the objects pointing to the object in question) and references (the objects pointed to by the object in question). A very powerful feature is the capability of the profiler to show all the paths from the object to the root. Object graphs on the snapshot can be complex and hard to navigate. If you are interested in only a particular object, you do not need to see the entire graph; rather, you just need to see which objects are preventing it from being garbage collected. Recall that the garbage collector reclaims an object only if it is not reachable from the roots. Thus, if you can identify and eliminate all the paths to the root from a given object, it is eligible for garbage collection.
Before taking a heap snapshot, it is always a good idea to request a garbage collection. This removes objects that are not referenced anymore and makes the job of tracking down memory leaks easier. In JProbe you can do this by selecting Request Garbage Collection from the Program menu. After that, take a heap snapshot by selecting Take Heap Snapshot from the Program menu. After JProbe has captured the snapshot, select Class View from the Snapshot menu. You now can look at the state of the heap and the object graphs. In our case, we are interested in java.awt.Point objects, so we right-click it in the Class View and select Instance Detail View from the pop-up menu. The new screen displays all the instances of Point in memory and enables us to browse the referrer and reference trees. The referrer tree is composed of a hierarchy of ancestors that have the instance as a child directly or indirectly—that is, all its immediate parents, parents of its parents, parents of the parents of its parents, and so on. Navigating the tree gives us a good idea of which references are held. In the case of our Point instance, we can see that it is referred to by an ArrayList that is referred to by PointFactory.
JProbe has another view that I actually prefer to use. It is called Reference Graph and is a better visualization of the object graph. To view the Reference Graph for a Point, you right-click a Point instance and select Instance Referrers and References from the pop-up menu. This displays a new window showing all the objects as named rectangles with the selected object in the center. Because we are trying to find out why the points are lingering in memory, click the Paths to Root icon in the graph toolbar. The resulting window is shown in Figure 10.3.
Once again, we can see that the Point object is referred by the ArrayList of PointFactory. We can conclude that the reason the points stay in memory is because they are never removed from the array. Looking at the implementation of printTestPoint(), we can see that it calls createPoint, which stores the instantiated Point object in the points array. To fix the problem, we need to add a call to removePoint to printTestPoint so that it looks as shown in Listing 10.3.
Writing multithreaded applications has the inherent risks of synchronization problems. On a single thread the code is executed in the same order as it is written in the source file. With multiple threads of execution, several concurrent operations can be performed at the same time, and each thread can be interrupted to allow the processor executing operations of the next thread. The order and the points of interruption are virtually random and therefore can't be predicted. Most of the Java applications are multithreaded, and although the built-in concept of threads hides the complexities of thread allocation, it does not safeguard against the common threading problems, such as data races, deadlocks, and thread stalls.
A data race condition occurs when two threads are simultaneously trying to access and modify a shared resource. A typical example of a potential data race is changing a balance of a bank account without synchronization. Say you have a BankAccount class with getBalance() and setBalance() methods to get and set the current balance, respectively. You also have a deposit() method to add or withdraw funds from the account. The implementation of deposit() first obtains the current balance, then adds the deposit amount, and finally sets the new balance. If two threads—thread1 and thread2—are making a deposit at the same time, thread1 can read the current balance and increment the amount, but before it has a chance to set the new balance it can get interrupted by thread2. thread2 reads the old balance and increments it before being interrupted in favor of thread1. thread1 updates the balance with the amount it has calculated, but after that, thread2 resumes execution and overrides the balance set by thread1 with its own value. In this example, the amount deposited by thread1 would be lost. Customers might well enjoy having this kind of anomaly for withdrawals, but they will not tolerate it for deposits to their accounts. Profilers such as JProbe Threadalizer can catch and report various types of data races. A typical solution to a data race is to add synchronization that protects access to the data. To fix the implementation of bank account deposits, the method that makes a deposit must be declared with a keyword: synchronized. Synchronization ensures that only one thread can obtain the lock, and any other thread attempting to obtain the same lock is blocked until the lock is released by its owner. An alternative to making methods synchronized is to declare a “lock” object and use it as a parameter to a synchronized block, as shown in Listing 10.4.
Example 10.4. Safeguarding Data Access with a Synchronized Block
protected Object balanceLock = new Object();
protected double balance;
...

public void deposit(double amount) {
    synchronized (balanceLock) {
        double balance = getBalance();
        balance += amount;
        setBalance(balance);
    }
}
Using synchronization adds overhead, so it must be applied only when necessary. Also note that not every data race reported by a profiler is a problem that needs to be fixed. For example, even if multiple threads read the balance at the same time, there is no harm in that; therefore, the getBalance() method does not necessarily have to be synchronized. In a multitiered application, synchronization can be deferred to other layers. For example, the database transaction isolation level can be used to prevent concurrent reads and writes of the same data.
Deadlock occurs when a thread is waiting for a lock that is acquired by another thread but is never released. It is a common problem in multithreaded applications that can cause the application to stop functioning completely. For example, if thread1 obtains lock1 and then waits for lock2 that is currently held by thread2, a deadlock occurs if thread2 attempts to obtain lock1 without releasing lock2 first. To illustrate the problem, let's look at the sample class with two locks and two methods that use the locks to synchronize the work they perform. In Listing 10.5, the actual work performed is not important because the focus is on the synchronization logic.
Example 10.5. Code That Has the Potential for a Deadlock
public Object lock1 = new Object();
public Object lock2 = new Object();

public void method1() {
    synchronized (lock1) {
        synchronized (lock2) {
            doSomething();
        }
    }
}

public void method2() {
    synchronized (lock2) {
        synchronized (lock1) {
            doSomething();
        }
    }
}
As you can see, both methods use locks lock1 and lock2, but they obtain them in a different order. If run on separate threads, method1 could enter the first synchronized block and get a lock on lock1. However, if it is interrupted by method2, method2 can enter its own outer synchronized block and get a lock on lock2. At this point the deadlock occurs as the threads continue execution because they are both waiting for locks indefinitely. The ThreadTest class from the covertjava.profile package provides an example of this scenario. Running it produces a deadlock that prevents graceful JVM shutdown because the two threads spawned by the main() method never return.
In our example, spotting the problem is easy if you closely examine the code of ThreadTest, but in a real-life application with hundreds of classes it would not be so simple. Good profilers detect deadlocks and provide information on what lead to it. JProbe Threadalizer from Quest and OptimizeIt Thread Debugger from Borland can both detect the deadlocks, but OptimizeIt also provides a visual timeline of thread execution, so we are going to use it for our work. Run OptimizeIt and configure ThreadTest as an application with covertjava.profile.ThreadTest as the main class. Be sure to check the Auto-start Analyzer option in the application settings dialog box to automatically start analyzing the running program for problems. Start ThreadTest using a menu or a toolbar button; after it runs for a few seconds, OptimizeIt should display the threads, as shown in Figure 10.4.
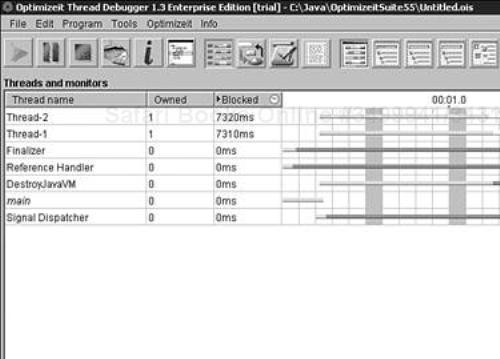
The view displays all the threads and the timeline of their execution status. Green indicates that the thread is running; yellow indicates that the thread is blocked while waiting for a lock that is owned by another thread; red indicates that the thread is waiting to be notified; and purple indicates that the thread is blocked in native code. ThreadTest spawns two threads that get the default names of Thread-1 and Thread-2. By examining the execution timeline of these two threads, you can see that after running for a short period of time, they became blocked indefinitely. All other threads are started internally by JVM to perform system tasks, so we will keep the focus on the threads created by the application. OptimizeIt allows the viewing of the locks held by each thread and the locks for which the thread is waiting. Because we opted to use the analyzer, we can take advantage of it to get a hint about the problem. We switch to the Analyzer view using the File menu. Then we click the Stop Recording button; we should see one deadlock detected by the tool with the description Locking order mismatch. Selecting the deadlock item displays the detailed information about the threads involved and the locks held. In our case the detailed description text is Thread Thread-2 enters monitor java.lang.Object 0xabf9280 first and then java.lang.Object 0xabf72f0 while thread Thread-1 enters the same monitors in the opposite order. OptimizeIt even shows the lines of code where the locks were acquired. This makes the job of fixing the problem easy.
To avoid deadlock, the order in which the locks are acquired should be the same. In our case, we should change method2 to first get lock1 and then lock2. The last thing to remember is that, even though the analyzer can detect many common errors that can lead to a deadlock, it can't detect every possible situation. Good design and solid coding practices go a long way in preventing problems in the future.
Thread stall is a term used to describe threads that are waiting to be notified when the notification never comes. This happens when a thread calls the wait() method on an object but no other threads call the notify() method on the same object. Thread stall is another example of a multithreading problem that can be detected by a profiler.
Performance optimization is a complex subject that goes well beyond the scope of this chapter. Java performance has come a long way, and modern JITs deliver excellent speed and code optimizations. The most important factor affecting the ultimate execution speed is the quality of application design and implementation. Some well-known pitfalls and common workarounds can increase performance by hundreds of percentage points. Often, rewriting a few key methods can result in applications responding 10 times faster than before. Performance optimizations begin with identifying the bottlenecks. Naturally, the performance should be considered even during the design phase, although it is not recommended to sacrifice clean design for anticipated minor performance gains. As the code is developed and the unit tested, it should be profiled to see which methods are taking the most time. The integration testing is where most of the profiling is typically done.
Profiling collects various execution statistics that gives an idea about where the time is actually spent. These are the most useful metrics produced by the JProbe profiler:
Method time—. Shows the time spent executing a given method, excluding the time spent in methods it called.
Method number of calls—. Shows the number of times the method was called. It can be used to identify the methods where optimization will produce the most dramatic effect on overall performance.
Average method time—. Shows the average time it took to execute the method. This is equivalent to method time divided by the number of calls and can be used to identify the slowest methods.
Cumulative time—. Shows the total time spent executing a given method, including the methods it called. It can be used to identify which methods of an application use most of the processing time.
Average objects per method—. Shows the average number of objects created inside a method. Because garbage collection in Java greatly affects application performance, reducing the object creation can increase the execution speed.
After the statistics are collected and analyzed, steps can be taken to optimize the poorly performing portions of the application.
Because running an application in a profiler requires the JVM to be started in a debug mode, it is not feasible for production applications. It would be nice to be able to get a snapshot of threads and what they are doing for any application, even if it was started in a normal execution mode. Luckily, a JVM can be told to produce a full thread dump that displays all the threads with the states and the call stack. To obtain a thread dump on Unix, you must execute a kill -3 <pid> command, where <pid> is the process ID of the JVM (kill -QUIT <pid> works on Solaris). On Windows it can be done by pressing Ctrl+Break in the console window. A thread dump for Chat is shown in Listing 10.6.
Example 10.6. A Partial Runtime Thread Dump for Chat
Full thread dump:
"RMI ConnectionExpiration-[10.241.11.244:14512]" daemon prio=7
tid=0x8ad0b68 nid=0x748 waiting on monitor [0x119df000..0x119dfdbc]
        at java.lang.Thread.sleep(Native Method)
        at sun.rmi.transport.tcp.TCPChannel$Reaper.run(TCPChannel.java:522)
        at java.lang.Thread.run(Thread.java:479)

"TimerQueue" daemon prio=5 tid=0x8ac15d8 nid=0x8a0
waiting on monitor [0x1177f000..0x1177fdbc]
        at java.lang.Object.wait(Native Method)
        at javax.swing.TimerQueue.run(TimerQueue.java:228)
        at java.lang.Thread.run(Thread.java:479)

"AWT-EventQueue-0" prio=7 tid=0x8a1ac28 nid=0x148
waiting on monitor [0x10f3f000..0x10f3fdbc]
        at java.lang.Object.wait(Native Method)
        at java.lang.Object.wait(Object.java:415)
        at java.awt.EventQueue.getNextEvent(EventQueue.java:255)
        at java.awt.EventDispatchThread.pumpOneEventForHierarchy(EventDispatchThread...)
        at java.awt.EventDispatchThread.pumpEventsForHierarchy(EventDispatchThread...)
        at java.awt.EventDispatchThread.pumpEvents(EventDispatchThread.java:88)
        at java.awt.EventDispatchThread.run(EventDispatchThread.java:80)

"Signal Dispatcher" daemon prio=10 tid=0x802388 nid=0x2b0
waiting on monitor [0..0]

"Finalizer" daemon prio=9 tid=0x7fe368 nid=0x640
waiting on monitor [0x8c4f000..0x8c4fdbc]
        at java.lang.Object.wait(Native Method)
        at java.lang.ref.ReferenceQueue.remove(ReferenceQueue.java:103)
        at java.lang.ref.ReferenceQueue.remove(ReferenceQueue.java:118)
        at java.lang.ref.Finalizer$FinalizerThread.run(Finalizer.java:157)

...
Listing 10.6 shows some of the threads running inside the Chat JVM. For instance, we can see that an RMI connection thread is sleeping inside the run method of the sun.rmi.transport.tcp.TCPChannel$Reaper class. The AWT-EventQueue thread is waiting for the next event, and the finalizer thread is waiting on a monitor using the wait() method.
Thread dumps can be very handy if a deadlock has occurred in a running application and it is not obvious what has caused it. Knowing which threads are waiting for which monitors is the best clue one can get. On Unix the dump also includes the environment variables, OS information, monitors dump, and a lot of other useful information.
profilers provide a sophisticated means of solving problems such as memory leaks, data races, deadlocks, and performance issues.
Investigating heap usage and garbage collection frequency offers knowledge on how to improve performance.
Browsing object allocation and references at runtime helps you find and fix memory leaks.
Investigating thread allocation and synchronization helps in finding thread locking and data race problems and improves performance.
Identifying expensive methods during profiling improves application performance.
Investigating an application in a profiler provides an insight into its internal structure.
A thread dump produced by the JVM in response to a
SIGQUITprovides useful infor-mation on threads and monitors for an application that is not running in debug mode.