CHAPTER 7
Selecting and Collecting Your Metrics
IF SALES MANAGEMENT WERE A SNAP
If you have formal sales processes in your sales force, then you’re off to a good start as a sales manager. Unlike your peers with no sales processes, you have something to actually manage. But even with the building blocks of control in place, you must determine what you want to accomplish with this potent managerial power. The question for you becomes:
![]() Given the ability to influence sales performance, which metrics on the war room wall do you want to change?
Given the ability to influence sales performance, which metrics on the war room wall do you want to change? ![]()
An underlying theme of this book is that sales management needs focus. With so many metrics and tools at their disposal, managers can find themselves attending to so many diverse things that their attention is spread fearfully thin. Furthermore, the current sales management environment doesn’t encourage laser-like focus, because pervasive reporting enables managers to look at their sales forces from every possible angle. If the report is there, chances are they’re going to read it.
But what if sales managers had to focus? What if they were forced to prioritize among their metrics? What would they do? Which ones would they choose as the critical few? Let us pose an unlikely scenario to see just what might happen.
Pretend for a moment that a team of genies suddenly appeared in sales forces around the world and granted all sales managers the ability to change the metrics on their war room walls by simply snapping their fingers. You would no doubt hear managers snapping so fast and furiously that their fingers would begin to bleed. No metric would be left to chance. This metric … that metric … and those metrics, too. A frenzy of snapping would surely ensue.
But what if the savvy genies only granted each manager the ability to snap her fingers once? Which single metric on the war room wall would the managers want to change? Ah, that’s an easy one. Most would choose Revenue. At least they could be assured that their quotas would be met. Whether Revenue, Profit, or some other measure of corporate health, we’d expect that all wise managers would cut straight to the endgame and snap into effect a plump Business Result. You’ve gotta love those genies.
But what if those devious genies unexpectedly changed the rules so that the snap could not be used to change any Business Result? Revenue, Profit, and all the obvious numbers are now off limits. Which metric would the managers now want to snap into shape? Most would probably shift their attention to a Sales Objective. That would get them as close as possible to the Business Results they selected before the game’s rules were suddenly changed. But which Objective? Should they target certain customers or sell certain products? Should they expand their Market Coverage or increase their Sales Force Capability? Regardless of which metric they chose to change, the managers would be forced to give some serious consideration to which Sales Objective was their best path to their previously chosen Business Result.
But wait! What if those dastardly genies now announced that the single snap could only be used to change a Sales Activity metric? No Business Result or Sales Objective could any longer be the finger-snap freebie. Many managers would begin to wonder if that single snap was worth much after all. Though they really want that Business Result at the top of the metrics hierarchy, could they trust that altering a metric at the Sales Activity level would surely move their Sales Objective and nudge a number at the top of the war room wall?
Well, this is actually where sales managers find themselves in the real world—you can control your Sales Activity metrics by managing your sales processes. And your reality is even a little better than the nasty genies’ final offer, because you can have as many snaps as you like. But how to use those snaps? Which numbers would you want to change at the bottom of the measurement framework to influence your Sales Objectives and achieve your Business Results? How can you be sure that the chain of events will be unbroken? Uncertainty can be crippling.
CHOOSING ACTIVITY, OBJECTIVE, AND RESULT METRICS
This vignette illustrates why it’s so important to know how the numbers on your war room wall work. You need to choose a set of interrelated metrics that credibly link your field-level Sales Activities to the Sales Objectives and Business Results you want. Just like the managers in this fictitious scenario, you should reverse-engineer a set of metrics level by level that will allow you to manage your Activities and then watch the Objective and Result numbers move obediently. You need to have your own causal chain of metrics, which we abbreviate as your A-O-R metrics (Activities, Objectives, and Results). See Figure 7.1.
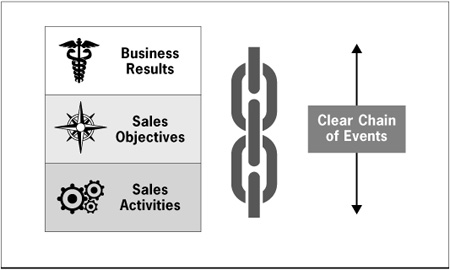
FIGURE 7.1 Architecting a System of Causal Metrics
Of course, selecting your A-O-R metrics is an important task unto itself. If your set of numbers is improperly devised, then the causal chain of events will be broken, and you won’t be able to Manage Your Sales Force with confidence. Without dependable linkages from the bottom to the top of the sales management framework, you can’t be certain that your effort will lead to your expected outcomes. Your Activities must drive your Objectives, and your Objectives must lead to your Results. It’s the only way that the newly cracked sales management code can be used to Manage Your Sales Force’s performance.
We refer to this set of selected metrics as A-O-R rather than R-O-A because it emphasizes Activities as the drivers of the Objectives and Results. In the field, the Activities are what you can directly affect, and there can’t be enough attention put on those things that you can actually manage. However, identifying these metrics is a top-down affair, so you actually select your metrics beginning with Business Results. You should always begin with the end in mind, and in this case, the end is your Results. Conveniently, these happen to be the easiest numbers to identify. The Rs are typically selected at very high levels in the organization and then handed down to the sales force as targets. Whatever your company chooses as its highest-level measurements, the Rs are rarely a mystery. Just look in your annual report.
Isolating the Os in your metrics can require a little more deliberation. If your ultimate Business Result happens to be increasing your Revenue, there are lots of potential Objectives that could lead you to that outcome. You could target any of several Customer Focus Objectives, like expanding your Share of Wallet, acquiring new customers, or even entering new markets. Or you could target Product Focus Objectives, like launching a new product line or cross-selling your existing products. And either of those changes in strategy might require you to adjust other Objectives, like your Market Coverage or Sales Force Capability.
In any event, the real challenge here is not to merely uncover ways to increase your Revenue. There are countless ways to accomplish that. The challenge is to find the easiest way to achieve your Result by choosing the Objectives that have greatest odds for success. For example, if you already have a high Share of Wallet, then it’s possible that deeper customer penetration could get you where you want to go. But it might be a much smarter strategy to target new prospects where dramatic growth is a more reasonable expectation. On the other hand, if you currently have a high market penetration, then increasing Share of Wallet with your current customers might be a more likely path. Whatever your choice, identifying the right Objectives is an exercise that demands careful consideration of each alternative because not all alternatives are created equal.
Of course, once you’ve nailed down your highest-impact Sales Objectives, you need to back into the Sales Activities that you’ll manage toward those intermediate goals. We mentioned several examples earlier in the book, such as increasing your account planning activities to drive higher Share of Wallet or boosting your Number of Prospects Called to drive new customer acquisition. The breadth of the specific activities you could undertake to achieve an Objective is endless. Here, like when selecting your Os, careful deliberation is encouraged.
At this point in the book, you understand that you must reverse-engineer your path through the management framework, but there’s a very important and often overlooked task remaining: to assign quantitative values to your A-O-Rs. For example, if you decide to grow your revenue by acquiring new customers as the result of increased prospecting activity, then you’ve solved for the qualitative half of the formula. However, you also need to determine how much revenue from how many new customers from how many prospecting calls. Without clear targets for your Results, Objectives, and Activities, it’s hard to predict whether you’ll end up where you want to be. You can do all the right things and still not attain your desired outcomes if you’re not doing those things in the right measure. Remember the old adage: what gets measured gets done.
BRINGING BACK THE SMILES
To illustrate this in a familiar setting, let’s refer back to our old friends Avery and Griffin. During their amazing three-year run that doubled the size of their workplace productivity company, they stated very explicitly the Results, Objectives, and Activities that they expected from their sales force. Recall that their desired Business Result remained the same during that period—to grow Revenue by 25% each year. However, their key Sales Objectives shifted repeatedly, depending on the situation they faced at the time. Every year, they reverse-engineered their A-O-R metrics to keep their sales force focused on the behaviors they wanted in the field.
During the first year of their growth phase, they found that their flagship product, the Smile-a-While, had already penetrated 80% of its target market. Therefore, it was unlikely that they could depend on growth in Smile-a-While sales to double the size of their company. They decided to turn their Product Focus toward their new product line, the Grin-Again, which showed great promise. Not being someone to leave anything to chance, Avery cleverly assigned a value to this new Sales Objective so her management team would keep their eyes on the prize. Their year-one target was to get 30% of the company’s revenue from the sale of Grin-Agains.
To shift their Product Focus, they also needed to shift their Market Coverage toward the owners of smaller office buildings, which were the ideal prospects for the Grin-Again. They therefore set a second Objective to contact 25% of all Grin-Again prospects at least once each quarter. And to achieve that level of coverage, they provided guidance at the Activity level as well, requiring each rep to make 10 Grin-Again prospecting calls per week. Their year-one A-O-Rs would have therefore looked like the chart in Figure 7.2.
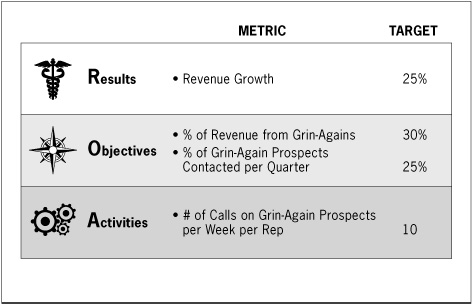
FIGURE 7.2 Year-One A-O-R Metrics
In year two, their desired Business Result of 25% Revenue Growth remained constant, but their Sales Objectives needed to change. They had achieved their Market Coverage objective, so they needed a new lever to continue their top-line growth. Through analysis, they discovered that their Grin-Again Close Rate was substantially lower than that of the Smile-a-While because a high percentage of their proposals were being rejected. This led them to conclude that their most likely path to higher Grin-Again Revenue in year two was to increase their Sales Force Capability with that product.
They again shifted their focus and set two new Objectives: to close 40% of their Grin-Again opportunities by winning 60% of their Grin-Again proposals. In order to achieve those Objectives, they made a critical change at the Activity level, requiring that all outgoing proposals be reviewed with a sales manager. In year two, then, their new A-O-Rs (in Figure 7.3) would have looked somewhat different.
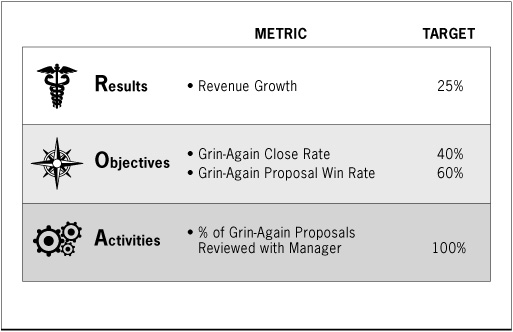
FIGURE 7.3 Year-Two A-O-R Metrics
By year three, Avery had developed a quite capable sales force that was fully deployed against her target markets. How could she continue to achieve her desired Result of 25% Revenue Growth? Since she had played out her most obvious Sales Objectives in years one and two, she needed to find a new path to the top line. Fortunately, one of her sales reps discovered that there was another fertile market for the Grin-Again: school systems.
They quickly changed their Customer Focus and set an Objective to get 30% of year-three Revenue from the education segment. A new year, a new Objective. Avery also made many adjustments to the Activities of the sales force, such as requiring that each rep make a dozen prospecting calls per week. In the final year of the three-year period, their A-O-Rs would have changed once more, as shown in Figure 7.4.
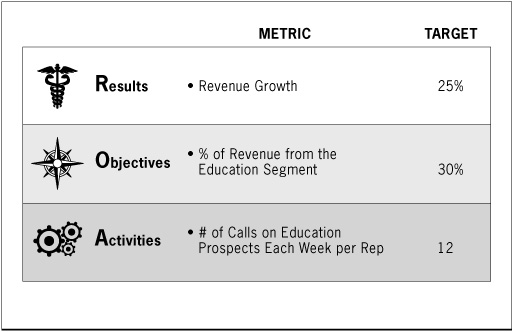
FIGURE 7.4 Year-Three A-O-R Metrics
In each case, these numbers were perfectly aligned from top to bottom. Each Activity emphasized was chosen because it would directly influence an Objective that would directly influence a Result. And each Objective and Activity was paired with a quantified target that was calculated by working backward from the ultimate goal of 25% Revenue Growth. If the assumptions that went into these decisions were sound and the managers were persistent, it would take a great external force to keep this company from achieving its goals. Nothing in life is certain, but engineering a set of metrics like these will bring you as close as you’re going to get to predictable sales force performance.
THE SHAPE OF THINGS TO COME
In these examples, we demonstrated a characteristic of the A-O-R metrics architecture that is worthy of mention. Previously, we have only used sets of Activities, Objectives, and Results that were linear in nature—a single Activity drove a single Objective toward a single Result. For instance, increased Account Management leads to increased Share of Wallet leads to greater Market Share. However, things are not so tidy in the real world. When you begin to create your own set of metrics, you’ll discover that the linkages are typically more complex than a straight path from the bottom to the top.
In reality, Activities, Objectives, and Results can zig and zag through the framework, with linkages pointing across the same level or even bouncing between them. In the original narrative of the Avery-Griffin tale, the targeted Result for year one was a 25% increase in Revenue. To accomplish that goal, they chose the Objective of launching a new product line, the Grin-Again. At that point, there was a vertical, one-to-one linkage between the Result and Objective levels.
However, launching the new product necessitated that other Sales Objectives be brought into the fray. First, they needed to target a new type of customer, so they set an Objective for covering a new customer segment. This new Objective demanded that they increase their sales force’s head count, so they formed yet another Sales Objective, to fill all of their vacant positions. A single Business Result spawned three Sales Objectives, each one supporting the next (see Figure 7.5).
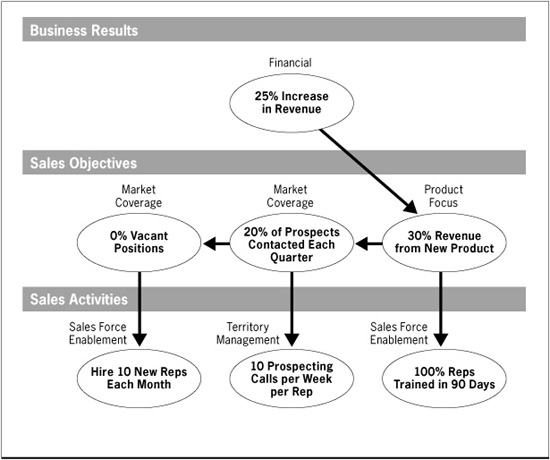
FIGURE 7.5 A Nonlinear Example of A-O-R Metrics
With these three Objectives on the wall, Avery then needed to identify the Sales Activities that she could manage toward them. To launch the new Grin-Again successfully, she needed to train her sales reps on the new product line. To cover the market adequately, she needed each rep to make a certain number of prospecting calls. To fill the vacant positions, she needed to hire new salespeople at a certain rate. Three Objectives, three Activities.
Each Objective demanded its own Activity in this example, but that’s not always the case. The particular path that your A-O-Rs take through the framework will depend on the type of change you are attempting to enact and the particulars of your organization. It will rarely be as simple as 1-2-3, but sales management is not a snap. When you do set about the task of defining your A-O-Rs, be mindful that the “shape” of the linkages will more likely resemble a tree than a stick. As always, simplicity is preferred. Just make sure you have the confidence that if you manage your chosen Activities, you will drive all of the desirable outcomes that lie above.
LEARNING TO LET GO
These examples also illustrate a wonderful lesson in shifting a sales force’s focus. You’ll note that each year sales management reevaluated its strategic intent and redirected its sales force accordingly. In fact, in two of the three years, the company altered its go-to-market strategy significantly, launching a totally new product in year one and targeting a completely new market in year three. The organization exhibited exactly the kind of agility that makes a sales force a strategic asset. When change was needed, it responded quickly and with purpose.
Shifting gears is not necessarily a unique management skill, though. Most companies have the ability to steer in a new direction, and every company must do so from time to time. However, there’s one practice Avery and Griffin demonstrated that is difficult for many to endure—letting go of the past.
When companies try to change, they often hang on to the things that got them to that point in time. And performance metrics are easy to keep. Adding a new metric to the war room wall is no challenge whatsoever. If you run out of space, just use a smaller font. So year after year, as go-to-market strategies change, the collection of numbers on the wall gets bigger and bigger. Always bigger, never smaller. That is because of one irrefutable fact:
![]() Removing metrics from the war room wall is extremely difficult to do.
Removing metrics from the war room wall is extremely difficult to do. ![]()
We opened this book by observing how prevalent reporting has become in the age of sales force automation. Just press a button, and hundreds of metrics will gush onto a report. But a theme that we keep reiterating is focus. When you add new metrics that are meaningful today but don’t remove the metrics that were useful in the past, you send confusing signals to the sales force. You’re once again saying, “Do more,” when what you really mean to say is, “Do different.” “Different” is something salespeople can usually do, but “more” is oftentimes impossible.
Avery was able to steer her sales force so adeptly because she provided her team with very explicit guidance. Each year she communicated what she expected them to deliver and in what measure. With the exception of the static revenue target, each year the metrics on the scorecard changed. There were three or four metrics that were always front and center in the sales force’s mind because she was able to pull old numbers off the war room wall.
If she had taken the more common approach of piling on the metrics, her sales force would have been given a year-three A-O-R agenda like the one in Figure 7.6. When each manager sat down with his reps to review their performance and plan upcoming activities, do you think they’d discuss the new A-O-R metrics for year three? Definitely. Would they discuss the older metrics from year two? Probably. And the outdated metrics from all the way back to year one? Probably those, too. If the metrics are on the report, then management is saying that they’re important numbers to hit. And the sales force will try to hit them. All of them. Or alternatively, none of them. Attempting to focus on too many things can lead to a focus on nothing.
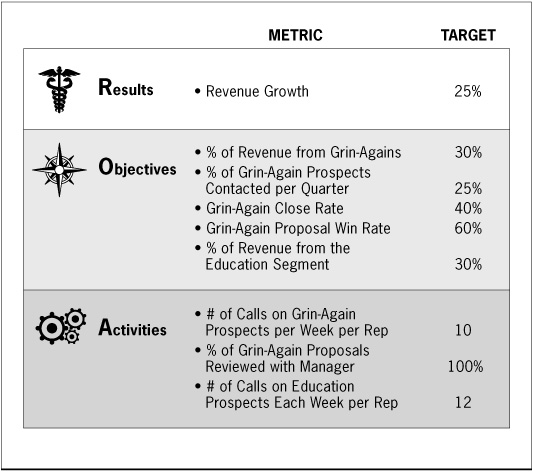
FIGURE 7.6 Year-Three A-O-Rs … Without Letting Go
We once worked with a client that published 28 different reports to its sales force each month. Twenty-eight. At some point in the distant past there was probably only one. And then two. And then three. And then 28. The managers in the field were so overwhelmed with data that many of them became numb to the metrics, even the important ones. As a tool to control the sales force’s performance, the metrics had been diluted to the point of uselessness. Letting go of the past is as much a part of management as providing guidance for the future. If you want your sales force to focus, then peel away the historical layers of measurement and put a few critical metrics in the spotlight. Then sales managers can shine.
SPEAKING OF REPORTS …
Despite our contention that endless reporting capabilities haven’t resulted in much greater control over the numbers on most war room walls, the ability to generate meaningful, timely, and trustworthy data is undeniably critical to effective sales management. Without crisp reporting, it’s impossible to do the analysis that’s required to identify your A-O-R metrics, and it’s equally as impossible to put those numbers in the spotlight. Good reports are good to have.
As you begin to think about bringing your own A-O-R metrics to life, you’ll quickly come to a point at which the reporting of the numbers becomes a concern. You might have already deduced that the deeper into our management framework you go—from Results, to Objectives, to Activities—the more difficult it can be to obtain the metrics that you want. More than likely, the facilities are already in place to collect data on Business Results like Financial, Customer Satisfaction, or Market Share numbers because they are high-visibility measures of corporate health. Metrics like those are usually only one “Run Report” button away.
On the other hand, Sales Objective data can be a little more evasive. Some of the metrics at that level are reasonably easy to obtain because they are culled from sales data that resides in financial or transactional systems. These are measures of Product Focus and Customer Focus that reveal what your sales force sold and to whom they sold it.
When a transaction takes place with a customer, it’s usually captured in a database somewhere. You just need to find that database.
But as you start to consider Market Coverage and Sales Force Capability, you might want to report data that isn’t captured in a transactional database. Many of these metrics involve a human element of some variety, and that presents issues with both collecting and validating the data. For instance, to fully assess your Market Coverage, you might want to examine the percentage of its time your sales force is spending with its customers. For most sales forces, these interactions take place outside of their offices. Therefore, the only way to gather such data is to go out and get it. It’s not just sitting around in a database waiting for you to press “Run Report.” Through sales force surveys or in-person observations, you’ll have to go out of your way to collect such time-and-effort data.
Other “human element” complications arise in certain Sales Force Capability metrics. First, there is information that must be manually entered into a system by the sales force. Examples would be the data that populates sales pipeline reports, such as where an opportunity is in its sales cycle or the projected size of a particular deal. When reps fail to update information or get sloppy with their entries, the reports become suspect. And as we all know, when garbage goes into a system, garbage will come out.
Second, there are Sales Force Capability measures like Increased Skill from Training or Comprehension of Product Information that attempt to quantify salespeople’s skills and knowledge. Clearly metrics like these are less concrete than Revenue Growth or Market Share, but they are important management inputs nonetheless.
One difficulty with such measures of “soft skill” is that they are highly dependent on the quality of the instruments that are used to assess the salespeople. We’ve worked with instruments that we would defend to the death, and we’ve seen others that we’d like to banish from the planet. Unfortunately, we don’t have that power. But however they come to be, these metrics certainly have their place on the war room wall.
As tricky as it can be to report metrics at the Results and Objectives levels, the single most common question we get on reporting is, “How do I measure Sales Activities?” When people pose this question, they are no doubt hoping that we’ll disclose some secret strategy for effortlessly assembling detailed reports on salesperson behaviors. Unfortunately, there’s no secret. It’s exactly as you think, a thorny endeavor.
There are primarily three methods to obtain Sales Activity data, some of which we mentioned earlier. First, you can get the data from the sales force itself, either by surveying it periodically or by having sellers enter information into a system on an ongoing basis. Either technique is exposed to subjectivity and inconsistency, but we have worked with companies whose sales forces were extremely diligent about entering accurate and timely data—extremely diligent.
As you might expect, this diligence didn’t occur because the sales force was simply predisposed to entering data into a system. Management set the expectation and enforced compliance. If you walk the halls of these companies, you hear managers saying things like, “If it’s not in the system, it didn’t happen.” And you see metrics in salespeople’s incentive compensation plans like Accuracy of CRM Data. And you see metrics on the war room wall like Percentage of Reps Logging into CRM. Again, what gets measured gets done.
A second means to obtain data on Sales Activities is by directly observing the salespeople’s behaviors. Literally, we mean watching the sales force perform tasks that are of interest to sales management. If you want to know things like how your reps are executing their sales calls or how they’re otherwise conducting themselves in the field, there’s no substitute for being there. But beware that this type of “data collection” sales call is different from the joint sales calls that managers typically make with their reps. To collect good data, you must play the role of researcher for the day, observing and noting, but not participating. A hard thing for many managers to do.
The final method for obtaining data on Sales Activities is to gather data in the background on interactions the sales force has with software applications or other types of tools it uses to support its everyday doings. For instance, if your call plans are imbedded in your sales force automation tool, then it’s pretty easy to generate a report from the tool on your sales reps’ Call Plan Usage. Or if you use an online proposal generation application, then it would be possible to quickly find the Number of Proposals Generated over a certain period of time. Tracking activity in this way is unobtrusive because it requires little extra effort by the sales force, but the types of information you can garner are limited by the tools your sales force uses (see Figure 7.7).
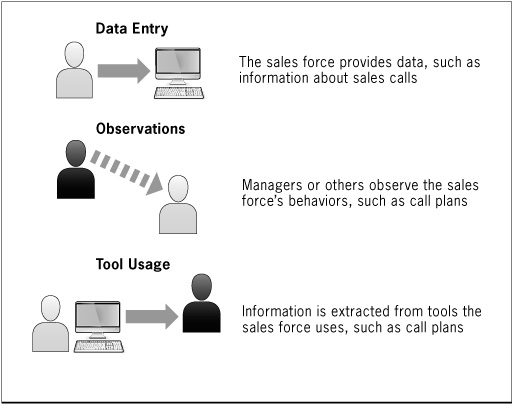
FIGURE 7.7 Collecting Data on Sales Activities
We have two last points to make about reporting. Foremost, not all reports have to be automated. We provided examples of manual data collection, but many companies are wary of exerting too much sales force effort to collect and report information. However, if you need certain data points to effectively measure and Manage Your Sales Force, then brute force reporting should always be an option.
We once worked with a leadership team that decided it would be incredibly powerful for its account managers to know the profitability of their individual customers. Their internal accounting systems were incapable of generating such reports, because it required the integration of data from several incompatible databases. They therefore hired several accountants to do nothing but generate monthly reports on customer profitability, the most brutal of brute-force reporting you could imagine. Many IT directors would cringe at the thought, but it was the most expedient (and perhaps even cost-effective) way to create reports that immediately made a huge impact on the company’s profitability. Don’t fear manual reporting. Good reports are good to have, regardless of whether they come by pressing a “Run Report” button.
Finally, we think sales force metrics should be reported on a need-to-know basis. It’s easy to push reports into the field simply because it’s easy to push reports into the field. But when 28 reports land in your in-box Monday morning, it’s difficult to know where to begin or what’s important. Someone sent the reports, so they’re certainly meaningful to somebody. But are they meaningful to you? Maybe?
Not everyone in a sales force needs all available information to do their jobs. They need the metrics that will focus them on their specific Activities, Objectives, and Results and provide feedback on how they’re performing. Information overload will paralyze a salesperson or manager and confuse her clarity of task. Once you develop your A-O-R metrics, we’d recommend that you report those metrics and any other information that’s required to interpret them—but not much more. Don’t turn your salespeople into analysts, swimming in a sea of data trying to find a lifeboat.
STATUS CHECK
When you have sales processes in place, you’re in a position to influence the numbers on the war room wall. However, you must focus your efforts on the critical few Sales Activities that will directly affect your Sales Objectives and Business Results. Trying to manage too much is effectively managing too little. You can probably move all of the numbers on the wall if you want, just not at the same time. Focus, focus, focus.
Therefore, you need to reverse-engineer a tidy set of Results, Objectives, Activities, and associated metrics that will most easily and directly lead you to your desired outcomes. As we learned early in our research, this is done by identifying the Results you want, selecting the Objectives that will most directly affect those Results, and then choosing the Activities you can manage that will most directly influence those Objectives. We began to call this focused set of directions the A-O-R metrics in order to emphasize the cause-and-effect relationship between Activities, Objectives, and Results.
Through thoughtful analysis, you can fairly dependably develop A-O-R metrics that will lead you from the battle on the field to the numbers on the war room wall. You just have to take it one layer at a time. But there are a couple of issues we often observe, even in the most deliberate and focused sales organizations.
First, you should change your A-O-R metrics as your go-to-market strategy shifts. From year to year, or even quarter to quarter, you may want to guide your sales force in a different direction, and installing new A-O-Rs in a timely fashion will turn your sales force into a nimble strategic asset in the marketplace. But you must let go of the old performance metrics, lest you create confusion in the field. Focus, focus, focus.
Second, it can also be a challenge to collect and report metrics that don’t reside conveniently in transactional databases. The deeper into our sales management framework you go, the more difficult it becomes to gather trustworthy data. This is particularly true of Activity-level measurements, which often must be manually entered into a reporting tool. However, if you need the data to Manage Your Sales Force, you can find a way to collect it. Otherwise, you are forfeiting control of your sales force for the sake of convenience. Not a good trade.
So with the processes, metrics, and reporting in place, there is only one thing left to do in order to influence the numbers on the wall: begin to manage your salespeople. We now turn our attention to just that—the last mile of road to travel between the place where we began our journey and the place where it will end.
