Data-Driven Architecture for Big Data
What information consumes is rather obvious: it consumes the attention of its recipients. Hence a wealth of information creates a poverty of attention, and a need to allocate that attention efficiently among the overabundance of information sources that might consume it.
—Herbert Simon
Introduction
Data is one of the biggest assets of any enterprise, large or small. With the right set of information, you can make business decisions with higher levels of confidence, as you can audit and attribute the data you used for the decision-making process. The complexities of managing data in structured environments have been a challenge that enterprises struggle with, and things will be worse when you look at adding Big Data into this situation. Enterprises that have paid attention to data management as an asset will be winners when building out the next-generation data warehouse.
To goal of this chapter is to provide readers with data governance in the age of Big Data. We will discuss the goals of what managing data means with respect to the next generation of data warehousing and the roles of metadata and master data in integrating Big Data into a data warehouse.
Data management refers to the process of collecting, processing, storing, and distributing data. The data management techniques that we have been using today in the modern database world are based on requirements that were developed for legacy systems dating back from punch cards, to mainframes, to analytical data processing systems.
Figure 11.1 shows the fundamental stages of data management across enterprises. There are several cycles of activities within each stage of processing that create complexities for managing the entire process end to end. Before we look into the details of these processes, let us take a brief look at metadata and master data.
Metadata
Metadata is defined as data about data or, in other words, information about data within any data environment. The origins of metadata can be traced to library systems from many years ago, where the classification, tagging, and cataloging of books provided the fundamental information classification and retrieval. Applied to information technology, metadata provides a natural way to integrate data and interrogate data.
Why is metadata so valuable? The answer to this question can be explained by a simple example. Let us assume you make a trip to the local hardware store to buy some sheets of wood. Without any label describing the wood, its dimensional attributes, and the price, you will be lost for hours waiting for someone to help you. This little label of information is what the value of metadata is all about.
From a database perspective, metadata describes the content of every attribute in every table as defined during the design phase of the database. This provides the developers, data architects, business intelligence architects, analysts, and users a concise roadmap of what data is stored within the database and in which table.
Metadata changes in the lifetime of a database when changes occur within the business, such as mergers and acquisitions, new systems deployment, integration between legacy, and new applications. To maintain the metadata associated with the data, we need to implement business and technology processes and governance policies. Many enterprises today do not track the life cycle of metadata, which will cost them when data is brought back from backups or data is restored from an archive database, and nobody can quite decipher the contents and its relationships, hierarchies, and business processing rules.
The value of having metadata can be easily established in these situations by measuring the cost impact with and without metadata:
• Cost of commissioning new applications
• Learning curve for new employees
• Troubleshooting application problems
• Creating new business intelligence and analytics applications
Traditionally in the world of data management, metadata has been often ignored and implemented as a postimplementation process. When you start looking at Big Data, you need to create a strong metadata library, as you will be having no idea about the content of the data format that you need to process. Remember in the Big Data world, we ingest and process data, then tag it, and after these steps, consume it for processing.
Let us revisit the metadata subject area first and then understand how it integrates into the world of Big Data. Sources of metadata include:
• Metadata generated automatically for data and business rules
There are fundamentally nine types of metadata that are useful for information technology and data management across the enterprise from transaction processing to analytical and reporting platforms.
Technical metadata
Technical metadata consists of metadata that is associated with data transformation rules, data storage structures, semantic layers, and interface layers.
• Metadata for data model and physical database includes length of a field, the shape of a data structure, the name of a table, the physical characteristics of a field, the number of bytes in a table, the indexes on a table, and data definition language (DDL) for a table.
• Business processing metadata includes information about:
• The system of record for a specific piece of data.
• Transformations that were performed on which source data to produce data in the data warehouse/datamart.
• Tables and columns used in the particular process in the data warehouse/datamart and what the transformations mean.
Business metadata
Business metadata refers to the data describing the content available in the data warehouse/datamart, including:
Contextual metadata
Contextual metadata is data that sets the “context” of your data. This is more related to processing large objects like text, images, and videos. Examples of contextual metadata include newsfeeds, tags on images, etc. Contextual metadata is the hardest to collect.
Process design–level metadata
Process design–level metadata consists of the following:
Program-level metadata
Program-level metadata consists of the following:
Infrastructure metadata
Infrastructure metadata includes:
Core business metadata
Core business metadata includes:
Operational metadata
Operational metadata is information about application runs, including:
Business intelligence metadata
BI metadata contains information about how data is queried, filtered, analyzed, and displayed in business intelligence and analytics software tools. This includes:
• Data mining metadata—the descriptions and structures of data sets, algorithms, and queries.
• OLAP metadata—the descriptions and structures of dimensions, cubes, measures (metrics), hierarchies, levels, and drill paths.
• Reporting metadata—the descriptions and structures of reports, charts, queries, data sets, filters, variables, and expressions.
• Business intelligence metadata can be combined with other metadata to create a strong auditing and traceability matrix for data compliance management.
The impact of metadata in the Big Data environment is discussed in later sections. The next section discusses master data management and its impact on the world of data management.
Master data management
Master data management (MDM) is the process of standardization of key business entities and its associated data processing rules across multiple operational applications and data consumption applications like a data warehouse and datamarts within an organization into a central data management platform referred to as an MDM database. MDM primarily focuses on processing “reference or dimensional” data for key business entities (e.g., customer, products, policy, agent, location, employee) that have been agreed on by all stakeholders as a “corporate shared asset” and is shared across an organization.
Why is MDM important? In the traditional world of data and information management, we used to build data and applications in silos across an enterprise. The addition of new systems and applications resulted in not only data volumes and transactions, but also created redundant copies of data, and in many cases the same data structure contained disparate values. The end-state architecture resulted in systems that did not interface and integrate with each other. The complexity of processing disparate data into a common reference architecture required hours of manual effort and did not provide a clean and auditable result set. Each system could give you a fractured insight into what was happening in the enterprise, but you could not create a clear and concise view of data as a centralized system.
This is where the need for a centralized MDM system begins. With a centralized system, the enterprise can create, manage, and share information among systems and applications seamlessly. The efforts to manage and maintain such a system are very simple and flexible compared to a decentralized platform. This approach can save an enterprise time and opportunity costs, while ensuring data quality and consistency. MDM is driven to handle each subject area as its own system within the enterprise. The underlying architecture of the system allows multiple source systems to be integrated and each system can alter the attribute values for the subject area. The final approval of the most accurate value is determined by a data steward and a data governance team, after which the business rules are executed to process the data modifications. The results are then shared back with the source systems, applications, and downstream analytical applications and databases, and called the “gold copy” of the data definition.
MDM is not about technology. The critical success factor of this initiative is the subject matter experts in data within the business teams, who can understand and define the processing rules and complex decision-making process regarding the content and accuracy of the data. MDM is not implementing a technology; as the role of any technology platform in this process, it is that of a facilitator and an enabler.
MDM is about defining business processes and rules for managing common data within disparate systems in an enterprise. In implementing these processes, the data governance and stewardship teams collectively determine the policies, validation, and data-quality rules, as well as service level agreements for creating and managing master data in the enterprise. These include:
• A standardized definition of data common to all the systems and applications.
• A standardized definition of metadata.
• A standardized definition of processes and rules for managing data.
• A standardized process to escalate, prioritize, and resolve data processing issues.
• A standardized process for acquiring, consolidating, quality processing, aggregating, persisting, and distributing data across an enterprise.
• A standardized interface management process for data exchange across the enterprise internally and externally.
• A standardized data security process.
• Ensuring consistency and control in the ongoing maintenance and application use of this information.
Master data sets are used across transactional databases, operational databases, web applications and databases, data warehouses, datamarts, and analytical databases. There are several techniques to implement a master data repository and, depending on the nature of the applications and databases involved, enterprises choose their custom implementation process. MDM transcends all architecture schools of data warehousing and is not exclusively confined to dimensional models alone. The two most popular applications of master data are a single view of the customer, called customer data integration (CDI), and a single view of the product, called product information management (PIM).
Metadata about master data is a key attribute that is implemented in every style of master data implementation. This helps resolve the business rules and processing conflicts that are encountered by teams within organizations and helps the data governance process manage the conflicts and resolve them in an agile approach.
There are several books and best practices documents about master data and the readers are encouraged to peruse them.1–5
Processing data in the data warehouse
The challenge with data has always been the ability to discern the content within the structure. There are two distinct parts of data that every data model shows: the physical attributes and data types, and the relationships between different data elements across an enterprise. What we miss out with is the attribution of content within the data structure, also known as metadata. The lack of metadata creates a confusion when nomenclature of the attribute versus the values stored differ; for example, Customer_Id can mean a unique machine-generated key for the table or the actual loyalty program identification for the customer. Storing a mix of values or one type of value when you meant the other is where a lack of data governance is observed.
With the world of Big Data there is a lot of ambiguity with data that makes it complex to process and navigate. To make this processing simple and agile, a data-driven architecture needs to be designed and implemented. This architecture will be the blueprint of how business will explore the data on the Big Data side and what they can possibly integrate with data within the RDBMS that will evolve to become the analytical data warehouse. Data-driven architecture is not a new concept; it has been used in business decision making for ages, except for a fact that all the touchpoints of data we are talking about in the current state are present in multiple silos of infrastructure and not connected in any visualization, analytic, or reporting activity today.
Figure 11.2 shows the data touchpoints in an enterprise prior to the Big Data wave. For each cycle of product and service from ideation to fulfillment and feedback, data was created in the respective system and processed continuously. The dataflow is more of a factory model of information processing. There are data elements that are common across all the different business processes, which have evolved into the master data for the enterprise, and then there is the rest of the data that needs to be analyzed for usage, where the presence of metadata will be very helpful and accelerates the data investigation and analysis. The downside of the process shown in Figure 11.2 is the isolation of each layer of the system, resulting in duplication of data and incorrect attribution of the data across the different systems.
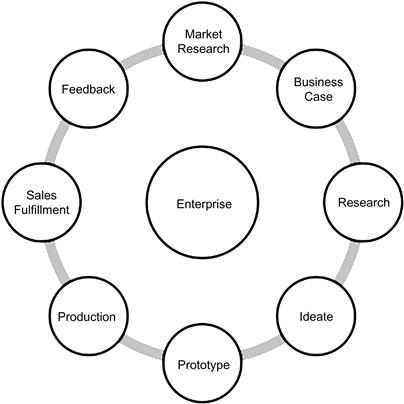
The situation shown in Figure 11.2 continues to happen with the best data governance programs implemented, due to the fact that organizations continue to ignore the importance of corporate metadata and pay the penalty once incorrect information is processed into the systems from source systems all the way to business intelligence platforms.
Figure 11.3 shows the data-driven architecture that can be deployed based on the metadata and master data solutions. This approach streamlines the data assets across the enterprise data warehouse and enables seamless integration with metadata and master data for data management in the data warehouse. While this architecture is more difficult to implement, it is a reusable approach where new data can be easily added into the infrastructure since the system is driven by data-driven architecture. Extending this concept to new systems including Big Data is more feasible as an approach. Let us take a quick look at processing traditional data with metadata and master data before we dive into applying this approach to processing Big Data and enabling the next-generation data warehouse to be more data driven and agile.
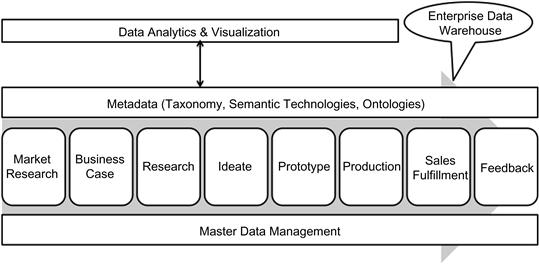
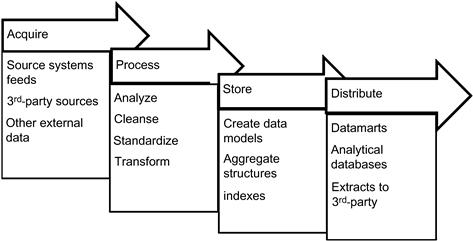
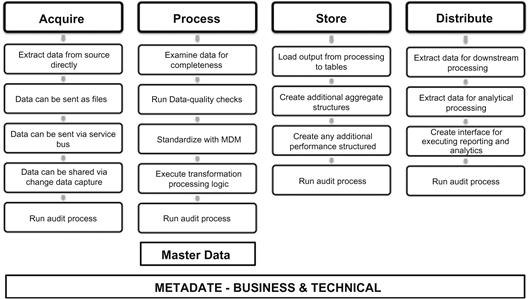
Figure 11.4 shows the detailed processing of data across the different stages from source systems to the data warehouse and downstream systems. When implemented with metadata and master data integration, the stages become self-contained and we can manage the complexities of each stage within that stage’s scope of processing. The stages are as follows:
• Acquire stage. In this stage we simply collect data from multiple sources and this acquisition process can be implemented as a direct extract from a database to data being sent as flat files or simply available as a web service for extraction and processing.
• Metadata at this stage will include the control file (if provided), and the extract file name, size, and source system identification. All of this data can be collected as a part of the audit process.
• Master data at this stage has no role as it relates more to the content of the data extracts in the processing stage.
• Process stage. In this stage the data transformation and standardization including applying data-quality rules is completed and the data is prepared for loading into the data Warehouse, datamart, or analytical database. In this exercise both metadata and master data play very key roles:
• Metadata is used in the data structures, rules, and data-quality processing.
• Master data is used for processing and standardizing the key business entities.
• Metadata is used to process audit data.
In this processing stage of data movement and management, metadata is very essential to ensure auditability and traceability of data and the process.
• Storage stage. In this stage the data is transformed to final storage at rest and is loaded to the data structures. Metadata can be useful in creating agile processes to load and store data in a scalable and flexible architecture. Metadata used in this stage includes loading process, data structures, audit process, and exception processing.
• Distribution stage. In this stage data is extracted or processed for use in downstream systems. Metadata is very useful in determining the different extract programs, the interfaces between the data warehouse or datamart, and the downstream applications and auditing data usage and user activity.
In a very efficiently designed system as described in Figure 11.4 we can create an extremely scalable and powerful data processing architecture based on metadata and master data. The challenge in this situation is the processing complexity and how the architecture and design of the data management platform can be compartmentalized to isolate the complexities to each stage within its own layer of integration. Modern data architecture design will create the need for this approach to process and manage the life cycle of data in any organization.
So far we have discussed the use of metadata and master data in creating an extremely agile and scalable solution for processing data in the modern data warehouse. The next section will focus on processing complexities with Big Data and how we can leverage the same concepts of metadata and mater data, and will additionally discuss the use of taxonomies and semantic interfaces in managing data processing within the Big Data ecosystem and the next-generation data warehouse.
Processing complexity of Big Data
The most complicated step in processing Big Data lies not just with the volume or velocity of the data, but also its:
• Variety of formats—data can be presented for processing as Excel spreadsheets, Word documents, PDF files, OCR data, from emails, from content management platforms, from legacy applications, and from web applications. Sometimes it may be variations of the same data over many time periods where the metadata changed significantly.
• Ambiguity of data—can arise from simple issues like naming conventions to similar column names of different data types to same column storing of different data types. A lack of metadata and taxonomies can create a significant delay in processing this data.
• Abstracted layers of hierarchy—the most complex area in Big Data processing are the hidden layers of hierarchy. Data contained in textual, semi-structured, image and video, and converted documents from audio conversations all have context, and without appropriate contextualization the associated hierarchy cannot be processed. Incorrect hierarchy attribution will result in data sets that may not be relevant.
• Lack of metadata—there is no metadata within the documents or files containing Big Data. While this is not unusual, it poses challenges when attributing the metadata to the data during processing. The use of taxonomies and semantic libraries will be useful in flagging the data and subsequently processing it.
Processing limitations
There are a couple of processing limitations for processing Big Data:
• Write-once model—with Big Data there is no update processing logic due to the intrinsic nature of the data that is being processed. Data with changes will be processed as new data.
• Data fracturing—due to the intrinsic storage design, data can be fractured across the Big Data infrastructure. Processing logic needs to understand the appropriate metadata schema used in loading the data. If this match is missed, then errors could creep into processing the data.
Big Data processing can have combinations of these limitations and complexities, which will need to be accommodated in the processing of the data. The next section discusses the steps in processing Big Data.
Processing Big Data
Big Data processing involves steps very similar to processing data in the transactional or data warehouse environments. Figure 11.5 shows the different stages involved in the processing of Big Data; the approach to processing Big Data is:
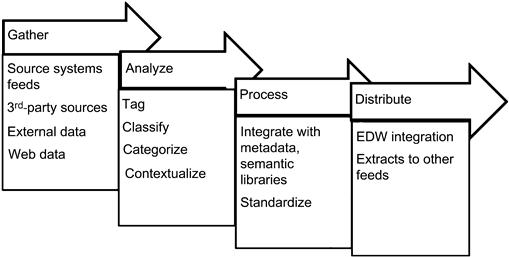
While the stages are similar to traditional data processing the key differences are:
• Data is first analyzed and then processed.
• Data standardization occurs in the analyze stage, which forms the foundation for the distribute stage where the data warehouse integration happens.
• There is not special emphasis on data quality except the use of metadata, master data, and semantic libraries to enhance and enrich the data.
• Data is prepared in the analyze stage for further processing and integration.
The stages and their activities are described in the following sections in detail, including the use of metadata, master data, and governance processes.
Gather stage
Data is acquired from multiple sources including real-time systems, near-real-time systems, and batch-oriented applications. The data is collected and loaded to a storage environment like Hadoop or NoSQL. Another option is to process the data through a knowledge discovery platform and store the output rather than the whole data set.
Analysis stage
The analysis stage is the data discovery stage for processing Big Data and preparing it for integration to the structured analytical platforms or the data warehouse. The analysis stage consists of tagging, classification, and categorization of data, which closely resembles the subject area creation data model definition stage in the data warehouse.
• Tagging—a common practice that has been prevalent since 2003 on the Internet for data sharing. Tagging is the process of applying a term to an unstructured piece of information that will provide a metadata-like attribution to the data. Tagging creates a rich nonhierarchical data set that can be used to process the data downstream in the process stage.
• Classify—unstructured data comes from multiple sources and is stored in the gathering process. Classification helps to group data into subject-oriented data sets for ease of processing. For example, classifying all customer data in one group helps optimize the processing of unstructured customer data.
• Categorize—the process of categorization is the external organization of data from a storage perspective where the data is physically grouped by both the classification and then the data type. Categorization will be useful in managing the life cycle of the data since the data is stored as a write-once model in the storage layer.
Process stage
Processing Big Data has several substages, and the data transformation at each substage is significant to produce the correct or incorrect output.
Context processing
Context processing relates to exploring the context of occurrence of data within the unstructured or Big Data environment. The relevancy of the context will help the processing of the appropriate metadata and master data set with the Big Data. The biggest advantage of this kind of processing is the ability to process the same data for multiple contexts, and then looking for patterns within each result set for further data mining and data exploration.
Care should be taken to process the right context for the occurrence. For example, consider the abbreviation “ha” used by all doctors. Without applying the context of where the pattern occurred, it is easily possible to produce noise or garbage as output. If the word occurred in the notes of a heart specialist, it will mean “heart attack” as opposed to a neurosurgeon who will have meant “headache.”
You can apply several rules for processing on the same data set based on the contextualization and the patterns you will look for. The next step after contextualization of data is to cleanse and standardize data with metadata, master data, and semantic libraries as the preparation for integrating with the data warehouse and other applications. This is discussed in the next section.
Metadata, master data, and semantic linkage
The most important step in creating the integration of Big Data into a data warehouse is the ability to use metadata, semantic libraries, and master data as the integration links. This step is initiated once the data is tagged and additional processing such as geocoding and contextualization are completed. The next step of processing is to link the data to the enterprise data set. There are many techniques to link the data between structured and unstructured data sets with metadata and master data. This process is the first important step in converting and integrating the unstructured and raw data into a structured format.
Linkage of different units of data from multiple data sets is not a new concept by itself. Figure 11.6 shows a common kind of linkage that is foundational in the world of relational data—referential integrity.

Referential integrity provides the primary key and foreign key relationships in a traditional database and also enforces a strong linking concept that is binary in nature, where the relationship exists or does not exist.
Figure 11.6 shows the example of departments and employees in any company. If John Doe is an employee of the company, then there will be a relationship between the employee and the department to which he belongs. If John Doe is actively employed, then there is a strong relationship between the employee and department. If he has left or retired from the company, there will be historical data for him but no current record between the employee and department data. The model shows the relationship that John Doe has with the company, whether he is either an employee or not, where the probability of a relationship is either 1 or 0, respectively.
When we examine the data from the unstructured world, there are many probabilistic links that can be found within the data and its connection to the data in the structured world. This is the primary difference between the data linkage in Big Data and the RDBMS data.
Figure 11.7 shows an example of integrating Big Data and the data warehouse to create the next-generation data warehouse. This is an example of linking a customer’s electric bill with the data in the ERP system. The linkage here is both binary and probabilistic in nature. This is due to the customer data being present across both the systems.
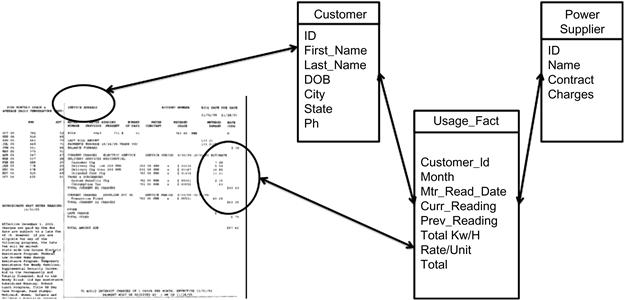
A probabilistic link is based on the theory of probability where a relationship can potentially exist, however, there is no binary confirmation of whether the probability is 100% or 10% (Figure 11.8). According to the theory of probability, the higher the score of probability, the relationship between the different data sets is likely possible, and the lower the score, the confidence is lower too. Additionally, there is a factor of randomness that we need to consider when applying the theory of probability. In a nutshell, we will either discover extremely strong relationships or no relationships. Adding metadata, master data, and semantic technologies will enable more positive trends in the discovery of strong relationships.

Types of probabilistic links
There are multiple types of probabilistic links and depending on the data type and the relevance of the relationships, we can implement one or a combination of linkage approaches with metadata and master data.
Consider two texts: “long John is a better donut to eat” and “John Smith lives in Arizona.” If we run a metadata-based linkage between them, the common word that is found is “John,” and the two texts will be related where there is no probability of any linkage or relationship. This represents a poor link, also called a weak link.
On the other hand, consider two other texts: “Blink University has released the latest winners list for Dean’s list, at deanslist.blinku.edu” and “Contact the Dean’s staff via deanslist.blinku.edu.” The email address becomes the linkage and can be used to join these two texts and additionally connect the record to a student or dean’s subject areas in the higher-education ERP platform. This represents a strong link. The presence of a strong linkage between Big Data and the data warehouse does not mean that a clearly defined business relationship exists between the environments; rather, it is indicative of a type of join within some context being present.
Consider a text or an email:
From: [email protected]
Subject: bill payment
Dear sir, we are very sorry to inform you that due to your poor customer service we are moving our business elsewhere.
Regards, John Doe
With the customer email address we can always link and process the data with the structured data in the data warehouse. This link is static in nature, as the customer will always update his or her email address. This link is also called a static link. Static links can become a maintenance nightmare if a customer changes his or her information multiple times in a period of time. This is worse if the change is made from an application that is not connected to the current platform. It is easy to process and create static linkages using master data sets.
Another type of linkage that is more common in processing Big Data is called a dynamic link. A dynamic relationship is created on-the-fly in the Big Data environment by a query. When any query executes, it iterates through for one part of the linkage in the unstructured data and next looks for the other part in the structured data. The linkage is complete when the relationship is not a weak probability. In probabilistic linking we will use metadata and semantic data libraries to discover the links in Big Data and implement the master data set when we process the data in the staging area.
Though linkage processing is the best technique known today for processing textual and semi-structured data, its reliance upon quality metadata and master data along with external semantic libraries proves to be a challenge. This can be overcome over a period of time as the data is processed effectively through the system multiple times, increasing the quality and volume of content available for reference processing.
To effectively create the metadata-based integration, a checklist will help create the roadmap:
• Data element abbreviations/acronyms
• Data element types and sizes
2. Outline the objectives of the metadata strategy:
• Data scalability of processing
3. Define the scope of the metadata strategy:
• Who is the steward of the metadata?
• Who will sign off on the documents and tests?
• Who own the metadata processes and standards?
• What are the constraints today to process metadata?
• A best-practice strategy is to adopt the concept of a master repository of metadata.
• This approach should be documented, as well as the location and tool used to store the metadata. If the repository is to be replicated, then the extent of this should also be noted.
7. Metadata maintenance process:
• Explain how the maintenance of metadata is achieved.
• The extent to which the maintenance of metadata is integrated in the warehouse development life cycle and versioning of metadata.
• Who maintains the metadata (e.g., Can users maintain it? Can users record comments or data-quality observations?).
Once the data is processed though the metadata stage, a second pass is normally required with the master data set and semantic library to cleanse the data that was just processed along with its applicable contexts and rules.
Standardize
Preparing and processing Big Data for integration with the data warehouse requires standardizing of data, which will improve the quality of the data. Standardization of data requires the processing of the data with master data components. In the processing of master data, if there are any keys found in the data set, they are replaced with the master data definitions. For example, if you take the data from a social media platform, the chances of finding keys or data attributes that can link to the master data is rare, and will most likely work with geography and calendar data. But if you are processing data that is owned by the enterprise such as contracts, customer data, or product data, the chances of finding matches with the master data are extremely high and the data output from the standardization process can be easily integrated into the data warehouse.
This process can be repeated multiple times for a given data set, as the business rule for each component is different.
Distribute stage
Big Data is distributed to downstream systems by processing it within analytical applications and reporting systems. Using the data processing outputs from the processing stage where the metadata, master data, and metatags are available, the data is loaded into these systems for further processing. Another distribution technique involves exporting the data as flat files for use in other applications like web reporting and content management platforms.
The focus of this section was to provide readers with insights into how by using a data-driven approach and incorporating master data and metadata, you can create a strong, scalable, and flexible data processing architecture needed for processing and integration of Big Data and the data warehouse. There are additional layers of hidden complexity that are addressed as each system is implemented since the complexities differ widely between different systems and applications. In the next section we will discuss the use of machine learning techniques to process Big Data.
Machine learning
From the prior discussions we see that processing Big Data in a data-driven architecture with semantic libraries and metadata provides knowledge discovery and pattern-based processing techniques where the user has the ability to reprocess the data multiple times using different patterns or, in other words, process the same data set for multiple contexts. The limitation of this technique is that beyond textual data its applicability is not possible. At this stage is where we bring in machine learning techniques to process data, such as images, videos, graphical information, sensor data, and any other type of data where patterns are easily discernable.
Machine learning can be defined as a knowledge discovery and enrichment process where the machine represented by algorithms mimic human or animal learning techniques and behaviors from a thinking and response perspective. The biggest advantage of incorporating machine learning techniques is the automation aspect of enriching the knowledge base with self-learning techniques with minimal human intervention in the process.
Machine learning is based on a set of algorithms that can process a wide variety of data that normally is difficult to process by hand. These algorithms include:
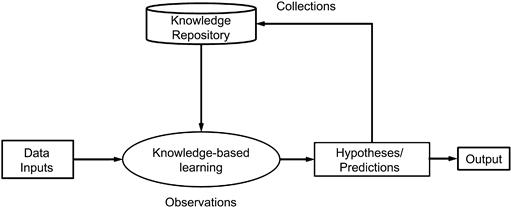
The implementation of the algorithms is shown in Figure 11.9. The overall steps in implementing any machine learning process are as follows:
1. Gather the data from the inputs.
2. Process the data through the knowledge-based learning algorithms, which observe the data patterns and flags them for processing. The knowledge learning uses data from prior processing stored in a knowledge repository (an NoSQL- or DBMS-like database) along with the algorithms for machine learning.
3. The data is then processed through the hypothesis workflows.
4. The outputs from a hypothesis and predictive mining exercise are sent to the knowledge repository as a collection with metatags for search criteria and associated user geographic and demographic data.
5. Process the outputs of the hypothesis to outputs for further analysis or presentation to users.
Examples of real-life implementations of machine learning include:
Using semantic libraries, metadata, and master data, along with the data collected from each iterative processing, enriches the capabilities of the algorithms to detect better patterns and predict better outcomes.
Let us see how a recommendation engine uses all the data types to create powerful and personalized recommendations. We will use the Amazon website to discuss this process:
1. John Doe searches for movies on Amazon.
2. John Doe receives all the movies relevant to the title he searched for.
3. John Doe also receives recommendations and personalized offers along with the result sets.

Figure 11.10 (a) User searches for movie, (b) user gets result sets, and (c) recommendations and personalization.
How does the system know what else John Doe will be interested in purchasing, and how sure is the confidence score for such a recommendation? This is exactly where we can apply the framework for machine learning shown in Figure 11.9; the process is shown in Figure 11.11.
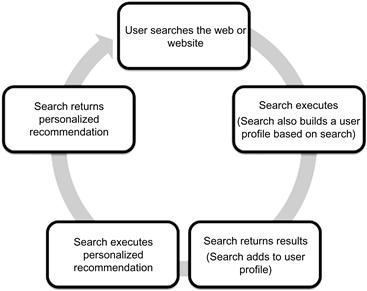
The first step of the process is a user login or just anonymously executing a search on a website. The search process executes and also simultaneously builds a profile for the user. The search engine produces results that are shared to the user if needed as first-pass output, and adds them to the user profile. As a second step, the search engine executes the personalized recommendation that provides an optimized search result along with recommendations.
In this entire process after the first step, the rest of the search and recommendation workflow follows the machine learning technique and is implemented with the collaborative filtering and clustering algorithms. The user search criteria and the basic user coordinates, including the website, clickstream activity, and geographical data, are all gathered as user profile data, and are integrated with data from the knowledge repository of similar prior user searches. All of this data is processed with machine learning algorithms, and multiple hypothesis results are iterated with confidence scores and the highest score is returned as the closest match to the search. A second pass of the result set and data from the knowledge repository is processed to optimize the search and this data is returned as personalized offers to the user. Often sponsors of specific products and services provide such offers with incentives that are presented to the user by the recommender algorithm output.
How does machine learning use metadata and master data? In the preceding search example, the metadata is derived for the search elements and tagged with additional data as available. This data is compared and processed with the data from the knowledge repository, which includes semantic libraries, and master data catalogs when the machine learning algorithm is executed. The combination of metadata and master data along with the use of semantic libraries provides a better quality of data to the machine learning algorithm, which in turn produces better quality of output for use by hypothesis and prediction workflows.
Processing data that is very numeric like sensor data, financial data, or credit card data will be based on patterns of numbers that execute as data inputs. These patterns are processed through several mathematical models and their outputs are stored in the knowledge repository, which then shares the stored results back into the processing loop in the machine learning implementation.
Processing data such as images and videos uses conversion techniques to create mathematical data sets for all the nontextual elements. These mathematical data sets are processed through several combinations of data mining and machine learning algorithms, including statistical analysis, linear regression, and polynomial curve-fitting techniques, to create outputs. These outputs are processed further to create a noise-free set of outputs, which can be used for recreating the digital models of images or video data (image only and not audio). Audio is processed as separate feeds and associated with video processing data sets as needed.
Machine learning techniques reduce the complexity of processing Big Data. The most common and popular algorithms for machine learning with web-sale data processing are available in the open-source foundation known as the Apache Mahout project. Mahout is designed to be deployed on Hadoop with minimal configuration efforts and can scale very effectively. While not all machine learning algorithms mandate the need for an enterprise data scientist, this is definitely the most complex area in the processing of large data sets, and having a team of data scientists will definitely be useful for any enterprise.
Summary
As we see from the discussions in this chapter, processing Big Data is indeed a complex and challenging process. Since the room for error in this type of processing is very minimal if allowed, the quality of the data used for processing needs to be very pristine. This can be accomplished by implementing a data-driven architecture that uses all the enterprise data assets available to create a powerful foundation for analysis and integration of data across the Big Data and the DBMS. This foundational architecture is what defines the next generation of data warehousing where all data types are stored and processed to empower an enterprise toward making and executing profitable decisions.
The data in the next-generation data warehouse cannot be growing forever, as the initial size of the new data warehouse starts in the hundreds of terabytes range and normally touches a petabyte very easily. The next chapter will focus on the relevance of information life-cycle management in the age of Big Data, where we need to ensure that the right data sets are always available for processing and consumption by the user at the right time, along with the right metadata. Additionally, the discussion will also focus on when we archive data from Hadoop or NoSQL and how to store that data set if needed for reprocessing.
1Loshin, D. (2009). Master Data Management. Oxford, UK: Elsevier Limited. ISBN: 0123742250.
2Berson, A., & Dubov, L. (2010). Master Data Management and Data Governance, 2nd Edition. McGraw-Hill Education. ISBN: 0071744584.
3Dreibelbis, A., Hechler, E., Milman, I., Oberhofer, M., Van Run, P. (2008). Enterprise Master Data Management: An SOA Approach to Managing Core Information. IBM Press.
4Hillmann, D. I., & Westbrooks, E. L. (2004). Metadata in Practice. American Library Association.
5Tannenbaum, A. (2002). Metadata Solutions: Using Metamodels, Repositories, XML, and Enterprise Portals to Generate Information on Demand. Addison-Wesley.