4
Active Retailing: Putting Products into the Path of Shoppers
“Give the lady what she wants.”
Early in our traffic studies, we noted an aisle that we thought was receiving very little traffic, considering the number of shoppers passing either end of the aisle. In an effort to rectify this situation and drive traffic to this aisle, we decided to give shoppers a $1.00 coupon for a store-brand purchase of $3.00 or more, just for visiting the aisle. We installed a special coupon and dispenser about halfway down it. Above the dispenser was a flashing red “police light” to attract attention to the free dollars. We also installed a moving LED sign at the entrance to direct shoppers to the coupon dispenser, and on weekends, a greeter at the door called shoppers’ attention to the presence of the coupon. In other words, we did everything in our power to attract attention to this aisle.
The net result was an increase from 28 percent of shoppers visiting the aisle to 30 percent in the month of couponing, a 2 percent increase in overall visitation to the aisle, primarily due to more traffic near the back of the aisle. We gave away a dollar off any $3.00 store-brand purchase (limit one per customer per day). This was as if we had dropped dollar bills in the aisle! And still, we only bumped overall visitation to the aisle by 2 percent.
As this example shows, it is very hard to get the crowd to move, even if you pay them. So you probably can’t get many more shoppers down your aisle. Does this mean that you cannot influence shopper behavior? Far from it. Take the product to the shopper. That’s the approach of the active retailer.
Organization of the products in a store (segmentation) seems so obvious and simple until you actually try to do it. Take juice as an example of a potential category. It is not uncommon for juice to actually fall into five different departments in a supermarket. There will be shelf-stable juices in the dry grocery area, typically in both canned and bottled versions. And then there will be frozen juices in the frozen food department. Chilled juices are in the dairy section, and freshly-squeezed in produce. The organic juices may be in produce, or in a special natural foods section.1
Publix, a Miami retailer, put a thin slice of fruit nectar into the middle of an end display of Ocean Spray juices, as shown in Figure 4.1. The fruit nectar bisects the overall display of juices. And, like nectar to a bee, this slice of nectar is designed to attract the attention of shoppers. Nectar is a major draw for the Caribbean customer, which makes up a high concentration of the shoppers in Miami. Once they are drawn to the nectar, they find themselves looking at the broadly popular juices. A minor item is embedded in a major display in a way that stops shoppers and encourages them to buy.
Figure 4.1 Nectar in the middle of the display, a major draw for shoppers in Miami, helps attract shoppers to this juice display.
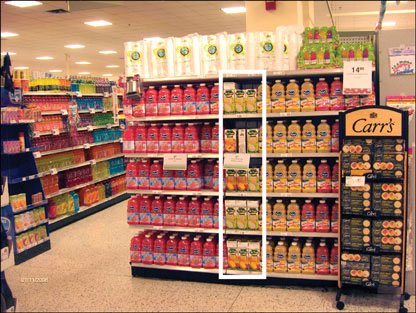
Placing nectar in the middle of the Ocean Spray juice display not only offers margin opportunities but also directional navigation opportunities. Displays like this can make helpful suggestions to the shopper. For example, “For a more complete selection of juices and nectars, visit aisle 8.” Technology such as tools to provide map guidance to shoppers for related purchases elsewhere in the store can enhance this ability. (I have, however, never been one to wait for future technological development to do what I can do right now, right here, with existing resources.) For Miami shoppers, with an attraction to nectar, this might be enough to take shoppers to these aisles. The problem in many stores, however, is that product segmentation is often carried out on an operational or other basis that may have little or nothing to do with the purchase process—the ultimate “coin on the counter.”
Active Retailing
In the days of the country store, retailers typically interacted directly with their customers, actively assisting them with their selection and purchases. About 100 years ago, the modern supermarket was born, and self-service became the rule rather than the exception. With the advent of the modern supermarket, interaction was no longer necessary, and turning over the process to the shopper reaped tremendous productivity gains.
Supermarkets were enthusiastically welcomed by shoppers, because of their convenient self-service, low prices, and wide selection. Nonetheless, the net result was a large measure of passivity on the part of the retailer. In fact, the supermarket became a neighborhood mini-warehouse, where the retailer stocked the wares, typically neatly on their warehouse shelves, and waited near the exit to collect their payment as shoppers departed with the merchandise. The first such establishment is often credited to King Kullen in New York, in 1930, but was certainly preceded by Ralph’s in California.
The wholesale movement to passive retailing created some problems while it solved others. A major and continuing problem is how to organize the merchandise in the store. One early effort to solve this problem actually involved organizing the categories in the store alphabetically. The Alpha Beta stores began doing this as early as 1915, with the chain surviving—without the category organizing principle—until 1988.
Put the Right Products in the Path of Customers
But with increasing competition and higher customer expectations, this passive role is no longer enough. The old store clerk and cracker barrel won’t be coming back, but retailers can take a more active role in the way they place products in front of shoppers. As we noted, the traditional view of shoppers is that they will travel great distances, walk through the dark valley of imposing shelving, and undergo unspeakable hardships to find their desired products. In reality, as we have seen in Chapter 3, “In-Store Migration Patterns: Where Shoppers Go and What They Do,” there are patterns of movement in the supermarket that are not driven by products as much as by open spaces and natural flows. Some shoppers may come down the frozen food aisle for ice cream, but others just happen to be there because it is a wide and inviting aisle that leads them to the checkout. The question is: Given the natural flows of shoppers, how do you put the right products in front of shoppers? In contrast to the more passive approach of warehousing products for customers, this more active approach might be called “anticipatory retailing.” The retailers anticipate the needs of shoppers and meet them.
By understanding shopper segments, moments of truth, and migration patterns through stores, retailers and manufacturers can do a better job of converting visitors to shoppers and shoppers to buyers. This chapter explores how.
Double Conversion™: Converting Visitors to Shoppers to Buyers
For a retailer to make a sale, customers have to undergo two conversions. These conversions occur during the process of reaching, stopping, and holding discussed in Chapter 2, “Three Moments of Truth and Three Currencies.” First, customers move from being visitors—tourists moving through the retail landscape—to active shoppers. Second, they move from shopping to buying. Good merchandising will yield high Double-Conversion™—stopping power to arrest shoppers and closing power to convert the shoppers to buyers (see Figure 4.2).
Figure 4.2 Double conversion: Converting visitors to shoppers, then shoppers to buyers
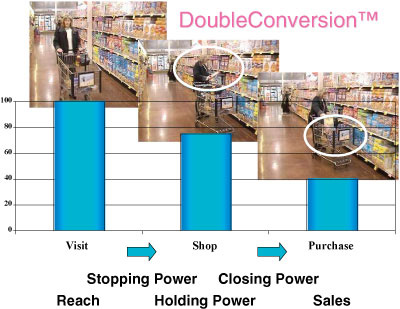
This distinction is important because those two conversions independently measure two different types of issues for the product. In the first instance, it is far more important to know the share of total visitors to the store who come within the orbit of the product than the total number of visitors, since the impact of the product occurs only when the visitor is close by and may become a shopper. Once they have been engaged, the next question is whether the product can make the sale, by convincing the shopper to pick it off the shelf and put it into the shopping cart—conversion into a purchaser.
We now have a framework for analyzing the shopping process. The three stages of the shopping process are reach, stopping power, and closing power, where the critical elements are the conversion from visitors to shoppers, and from shoppers to purchasers. How these three elements are managed in practice defines the difference between active and passive retailing.
Packaging Must Play the Starring Role
Only 45 percent of shoppers use a shopping list. Shoppers are not automatons following out the commands of a preordained list. They are making decisions on-the-fly as they walk through supermarket aisles. This means that packages have an opportunity—a very brief opportunity—to grab the shopper’s attention and make a sale.
Many consumer goods companies no longer see packages merely as containers for shipping products, according to a report in the The New York Times. “The shift is mostly because of the rise of the Internet and hundreds of television channels, which mean marketers can no longer count on people seeing their commercials. So they are using their bottles, cans, boxes, and plastic packs to improve sales by attracting the eyes of consumers, who often make most of their shopping decisions at the last minute while standing in front of the store shelves.”2 For example, Evian created a swanlike neck and silver tray for its “palace” bottled water, conveying a sense of luxury. Coors added thermochromatic ink to its label that changes the color of the mountains when the bottle is cold.
The package has to do two things: First, it has to engage the shopper by standing up and waving its arms and saying: Pay attention to me! I’m over here! Second, the package must be compelling enough so that the shopper feels the urge to complete the sales process.
Although everything that goes on outside the store plays a role in shopper choice, the crucial element in the store is the package. In terms of communication, it has the most impact. Far too many marketers view packaging as a labeled container, necessary to deliver the product to the shopper. Such complacency is dangerous, because this is the one factor over which the manufacturer has nearly total control. With more than 5,000 new SKUs on the grocer’s shelf every year, existing brands and new products find it more and more difficult to get on the shelf and gain trial. Today, the package is often the pivotal factor in a product’s success or failure.
There are a number of reasons packaging is so critical to shopping, as follows:
• For most new products, the store shelf is the first and only opportunity to sell to the consumer. Because of the decline in effectiveness of traditional advertising methods, many consumers are first made aware of a new product after seeing it on a shelf.
• Strong packaging can drive trial and awareness of a brand.
• The package is the last chance to have an impact on purchasing decisions—100 percent of all these are ultimately made at the shelf.
• A typical package generates 570 million impressions each year, just by being on store shelves.
• Packaging generates impulse purchases. Research from point-of-purchase trade association POPAI shows that a consumer may enter a grocery store planning to buy 10 items and leave having purchased 20.
• The package is the best way to break through the clutter/noise at retail.
Creating shelf impact helps maximize a brand’s chance of success. But more than being noticed is required. A bottle of salad dressing with a hot pink label may have impact, but will consumers buy it? Generally, to improve shelf impact, a package needs to look different than the other items in the category, but attractiveness remains a requirement for closing the sale. The package has to take the customer through both conversions—not merely attract attention, but also close the sale.
Context matters, of course. Brand owners should study the shelf impact of competitors before trying to improve their own. The brand may already be the market leader, but a close eye needs to be kept on private labels and smaller brands seeking to emulate the leaders’ appearances. Also, shelf impact is more important in a fragmented category with low brand loyalty, such as barbecue sauce, than in a category with few major players and loyal customers, such as canned soup. Additionally, although the front panel may make the sale at the store, the side or back panel may be more important in the freezer, refrigerator, or pantry.
Packaging is the workhorse of today’s marketing mix. Not only does it need to be attractive and stand out, but it also needs to do the following:
• Generate awareness through optimizing brand identity, shelf impact, and “findability” on the shelf.
• Generate trial by communicating the product’s most persuasive points or “reason for being.”
• Support the brand’s image by communicating the desired brand-equity elements (such as gourmet, fun, sophisticated, and so on).
• Ensure repeat purchase by delivering value through package functionality.
Having said all this, we emphasize that the first and most important marketing function is to stop the shopper. Unless this happens, nothing more will happen. So, first the product must reach the shoppers, and then stop them. But then it must “hold” them—the intermediate stage between stopping and closing power.
Holding Power—How Long Is Long Enough?
Holding power is about time: How much time is involved in turning a visitor into a shopper? This is a delicate balancing act for the brand owner when it comes to product placement and packaging. Where the product is—both on the shelf and in a particular aisle—and its packaging can have an enormous impact on closing power. Think of a package’s stopping power as its capability to initiate a conversation with passing shoppers. Holding power is its capability to continue the conversation as long as necessary to make the sale. The question then is: What is the right amount of time for this conversation to last? The answer is: Just long enough to complete the sale.
So, the package is the key to stopping, holding, and closing power. It is the interaction of these measures for categories and products, along with the reach that is provided at retail, that not only forms the foundation of a systematic approach to product management, but also segues into promotional planning. Location and merchandising in the store are driven by flow and adjacency analysis, linked to the metrics for measuring the conversion of visitors to shoppers, and shoppers to buyers. This is discussed in Chapter 8, “Multicultural Retailing,” with promotion planning incorporating elements of the purchase cycle and other consumer behavioral traits.
Before getting into the details of these “final mile” issues, we will look at some intermediate category analysis steps, called VitalQuadrant™ analysis, which will assist in evaluating the inherent properties of various categories, as well as spotlighting potential problems.
Stopping and Closing Power: VitalQuadrant™ Analysis
Because a product’s stopping and closing power are the key to making the sale, we can plot both of them in a VitalQuadrant™ analysis, as illustrated in Figure 4.3. It is helpful to group categories in terms of their stopping and closing powers, since entire categories exhibit characteristics that are, more or less, the sum of all the packages in them. So, we look graphically at categories dispersed according to those two measures, stopping and closing power.3
Figure 4.3 VitalQuadrant™ analysis
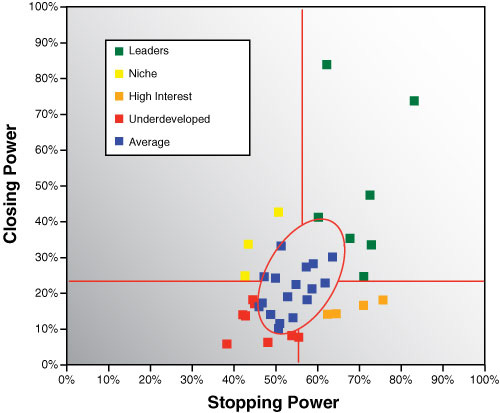
Beyond the broad average category in the middle, the categories in order of sales performance are as follows:
• Leaders: These categories have extraordinary stopping and closing power. If shoppers see these products, they stop and buy them.
• Niche: Few stop to shop, but those who do, buy.
• High interest: These are window-shopping categories. Shoppers stop to shop, but don’t buy.
• Underdeveloped: Few stop to shop, and the few who shop don’t buy. These categories have little stopping power and even less closing power.
This helps move our focus away from the average group in the middle to what quality guru Joseph Juran called the “vital few.” Juran was talking about the 20 percent of defects that lead to 80 percent of quality problems. Focusing on correcting these “vital few” defects leads to tremendous improvements in quality. Similarly, it is clear from our analysis that focusing on the set of “leader” products in the supermarket—as well as the other categories—could have a tremendous impact on overall sales.
Figure 4.4 shows the average reach, stopping power, and closing power numbers for 40 major categories, based on the shopping trips of a million shoppers in stores across the U.S. Note that whereas the closing power overall is 22 percent, the closing power for leader categories such as bread, dairy, soft drinks, and produce is 54 percent. Categories are not always in the same VitalQuadrant™ in each store, but bread, dairy, produce, and soft drinks are often in the leader group. This is a reflection of the fact that they have the highest stopping and closing power of any categories in the store—70% and 45%, respectively.
Figure 4.4 Leader categories close more sales.
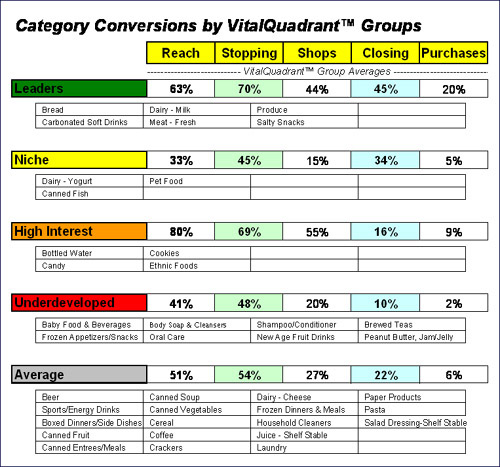
This doesn’t mean that every item in the category exhibits this kind of behavior, but the category as a whole does. However, the type of thinking that goes into this category-level analysis can be applied to subcategories, individual brands, and even specific items. Any category, subcategory, brand, or item that exhibits strong stopping and closing power is truly a leader.
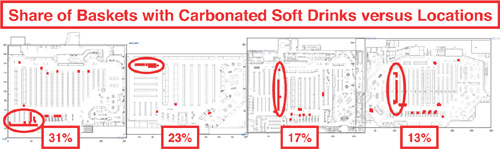
Studies across a set of stores can show how different positioning of leader categories in the store can dramatically influence sales. Figure 4.5 shows the position of soft drinks and resulting sales for four different stores. Stores that locate these products on the perimeter “racetrack” of the store, whether front or back (as shown in the right-hand side of the figure), achieve significantly higher share of baskets with soft drinks in them, as compared to stores with this category principally located on center-of-store aisles (as shown in the left side). The better placement in the first store led to nearly a third of shoppers picking up soft drinks, as opposed to just 13 percent in the last store. Even attractive “leader” items such as soft drinks will not necessarily lure shoppers into the center aisles, but if they are placed in the path of shoppers, they will lead to sales. This indicates the tremendous opportunities retailers and manufacturers have for increasing sales by better placement of products in the store.
Figure 4.5 Shares of baskets with carbonated soft drinks across four stores
Most categories, however, would not have such a wide swing as carbonated soft drinks, since purchases per category, on a basket share basis, tend to be relatively constant across stores. Carbonated soft drinks, on the other hand, are unusually sensitive to regions, the weather, and so on. For instance, you can expect to sell more soft drinks on a per capita basis in July and August in the Carolinas than in the Dakotas in January and February.
Playing the Niche
The niche group of products offers another prime hunting ground for potential sales improvements. These are products that are very good at closing the sale, but poor at stopping the traffic. Notice, though, that they reach the lowest percentage of traffic in the store. On the other hand, high-interest products often are placed in front of more traffic than any other category in the store, including the leaders! Why is this, when they are doing such a poor job of closing the sale? Like a lot of “salesmen,” they talk a good game, but just don’t get the job done. But retailers are fooled by the high interest in these products and fail to see that with the highest level of exposure and reach, they don’t deliver sales to match. But the niche products can deliver respectable sales with minimal exposure. The key is to give them visibility from high-traffic areas, but not necessarily locate them within these areas.
What is the potential of niche products? We analyzed this question for a single superstore and found that the store was potentially leaving $2 million on the table because of its strategy for a single category of niche products. We compared the sales in the niche categories (baby food) to an opportunity index (market demand index) based on actual total store traffic, neighborhood demographics, and sales at other stores across the country. For baby food, this store was selling nearly $2 million less per year than could be expected. Simply exposing that category to more in-store traffic—moving it to a higher traffic area—could deliver $2 million of additional sales. (Notice that in this supercenter, baby food falls into the niche group, illustrating how a category’s performance varies depending on specific store conditions. Across a national sampling of supermarkets, the average performance of baby food puts it in the underdeveloped group—poor stopping and poor closing.)
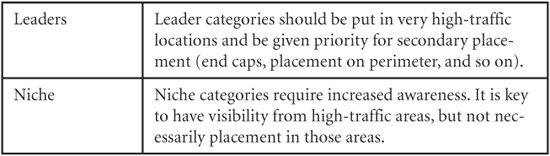
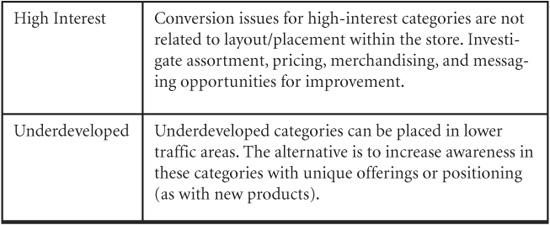
General guidelines for each of these categories are shown in Table 4.1. By more carefully managing each of these groups, retailers can put products in front of shoppers that they will stop and buy. And that will increase overall sales.
Table 4.1 Category Guidelines for Placing Products
Good Is the Enemy of the Great
Understanding these distinctions can help put the right products in the right place in the store. The right placement can help meet shoppers where they are and close a sale. It can allow the retailer to play a more active role in the process, without standing in the aisles and taking down items from the shelves. This understanding of shoppers and stores can help retailers make the creative leap of putting a line of nectar in the middle of a juice display. There are many other opportunities for rethinking approaches in the store that can boost sales.
This concept of distinctions overcomes the instinctive reaction to settle for what is merely “good.” As Jim Collins wrote in Good to Great: Why Some Companies Make the Leap…and Others Don’t,”the good is the enemy of the great.”4 In other words, if you settle for good performance of products and don’t investigate what makes the leaders great, you won’t outperform your competitors. In this case, we are considering retail strategy as well as the products themselves.
Endnotes
1. This might not matter, except that how categories are defined will alter significantly, not only the statistical performance measures, but also how they are conceived ever after. And the statistics that begin to be a baseline for our understanding tend to be set in concrete, based on what we include or don’t include in any category. So, defining “dairy” to include chilled juices and refrigerated dough may make a lot of operational sense, including incentive pay for the dairy manager. But it can result in serious distortions of the “juice” market if juice is not identified separately in the dairy department. In other words, move one product to a different section, and the whole statistical picture changes.
2. “Product Packages Now Shout to Get Your Attention,” The New York Times, August 10, 2007.
3. A quadrant analysis of this type has the usual advantage of dispersing the individual members (categories) so that their relative performance on two measures can be readily visualized. A disadvantage of the usual approach is always a central tendency, or clumping. We alleviate this problem by statistically identifying the central “clump” as average, and taking our cue from Joseph Juran, focus on those categories at the perimeter, the “vital few” most easily characterized, and most susceptible to specific creative management practices. In naming VitalQuadrants™, we follow the language of Paco Underhill and others, although our definitions differ to an extent.
4. Collins, Jim. Good to Great: Why Some Companies Make the Leap…and Others Don’t, New York: Collins Business, 2001.