
Objective group 4
Insert tables, charts, SmartArt, 3D models, and media
The skills tested in this section of the Microsoft Office Specialist exam for Microsoft PowerPoint 2019 relate to inserting and formatting as tables, charts, and SmartArt graphics; inserting and modifying three-dimensional models, which are a new offering in Office 2019; and inserting and managing media clips. Specifically, the following objectives are associated with this set of skills:
4.3 Insert and format SmartArt graphics
4.4 Insert and modify 3D models
PowerPoint offers many ways to take slide content “beyond bullet points” and express information visually. You can display numeric data in tables or summarize it in charts. SmartArt business graphics visually express the flow of a process or structure of an organization. Three-dimensional images allow for the display of greater detail. You can embed supplementary videos and audio recordings on slides to provide information, a soundtrack, or special effects. All these methods help to keep a presentation engaging and informative.
This chapter guides you in studying ways of inserting and modifying tables, charts, SmartArt graphics, 3D models, audio clips, and video clips.
Objective 4.1: Insert and format tables
Many people think of PowerPoint presentations as a series of slides containing bulleted text. PowerPoint experts present content in ways that clearly communicate necessary information without distractions. Tables are one way of presenting textual or numeric data within a structure that helps audience members to quickly understand the message.
Create and insert tables
When you want to present a lot of data in an organized and easy-to-read format, a table is often your best choice. You can create a table in one of the following ways:
Have PowerPoint insert a table with the number of columns and rows you specify.
Draw the table by dragging on the slide to create cells that are the size and shape you need.
If the table already exists in a Microsoft Word document, Excel workbook, Outlook email message, or another PowerPoint slide, you can copy the original table and paste it onto a slide rather than re-create it.
If you want to use data from an Excel worksheet in a PowerPoint table, you can do any of the following:
Copy and paste the data as a table.
Embed the worksheet on a slide as an object.
Link the slide to the worksheet so that the slide reflects any changes you make to the worksheet data.
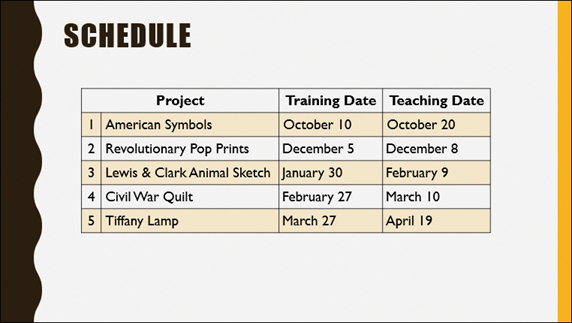
Tables display information in rows and columns
To enter information in a table, you simply click a cell and then enter text. You can also move the cursor from cell to cell by pressing the Tab key.
To create a new table
In a content placeholder, click the Insert Table button.
In the Insert Table dialog box, specify the number of columns and rows, and then click OK.
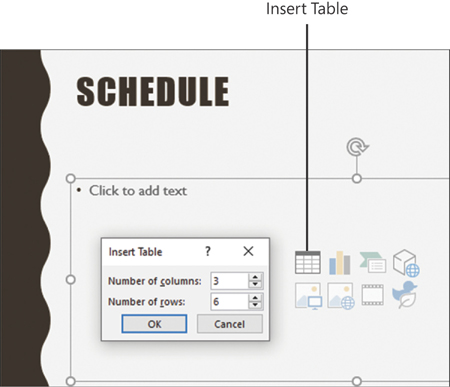
Some content placeholders include table options
Enter or copy and paste the information into the table structure.
Or
On the Insert tab, in the Tables group, click the Table button.
Move the pointer across and down the grid to select the number of columns and rows you want, and then click the lower-right cell in the selection.
Enter or copy and paste the information into the table structure.
To insert a table from Word
In the source document, click the table border to select it.
Copy the table to the Microsoft Office clipboard.
Switch to PowerPoint, display the destination slide, and then paste the table from the clipboard.
To paste Excel data as a table
In the Excel worksheet, select and copy the data you want to display in the PowerPoint table.
Switch to PowerPoint, display the destination slide, and then paste the data.
To change the default paste option (Use Destination Styles), click the Paste Options button, and then click the option you want.
To embed an editable worksheet
In the Excel worksheet, select and copy the data you want to display on the PowerPoint slide.
Switch to PowerPoint, display the destination slide, click the Paste Options button, and then click Embed.
Or
In the workbook that contains the worksheet, ensure that the worksheet you want to embed is the active worksheet, and then save and close the workbook.
On the Insert tab, in the Text group, click the Object button.
In the Insert Object dialog box, click Create from file, and then click Browse.
In the Browse dialog box, locate and double-click the workbook, and then click OK.
To modify an embedded worksheet
Double-click the worksheet object.
Use Excel techniques to edit and format the embedded object.
To link to a worksheet
 Follow the instructions for embedding a worksheet, but in the Insert Object dialog box, select the Link check box before clicking OK.
To update a linked worksheet
- Double-click the table on the slide to open the linked worksheet in Excel, make the changes, and then save them.
- If you update the linked worksheet in Excel and want to synchronize the table on the slide, right-click the table on the slide, and then click Update Link.
To resize a linked worksheet
- Point to any handle (the sets of dots) around the worksheet object, and then drag to enlarge or shrink it.
To update table data
- Use normal editing techniques to change the data in a cell.
To delete a table
- On the Layout tool tab, in the Rows & Columns group, click the Delete button, and then click Delete Table.
Change table structure
When a table is selected, the Design and Layout tool tabs are available on the ribbon.
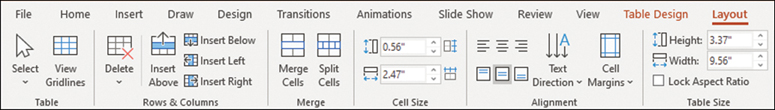
PowerPoint has most of the same table layout tools as Word
After you insert a table, you can change its structure in the following ways:
Add columns or rows.
Delete columns or rows.
Combine (merge) selected cells into one cell that spans two or more columns or rows.
Split a single cell into two or more cells.
Resize individual columns or rows, or the whole table.
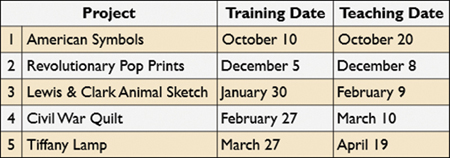
The Project heading is in a merged cell at the top of the first two columns
To select table elements
- To select a cell, point just inside its left border, and then click when the pointer changes to a black arrow pointing up and to the right.
- To select a column, do any of the following:
Point above its top border, and then click when the pointer changes to a black, downward-pointing arrow.
Drag to select all the cells in the column.
Click a cell in the column, and on the Layout tool tab, in the Table group, click the Select button, and then click Select Column.
- To select a row, do any of the following:
Point outside the table to the left of the row, and then click when the pointer changes to a black, right-pointing arrow.
Drag to select all the cells in the row.
Click a cell in the row, and on the Layout tool tab, in the Table group, click the Select button, and then click Select Row.
- To select multiple cells, columns, or rows, do either of the following:
Select the first element, and then hold down the Shift key as you select subsequent elements.
Drag through adjacent cells, columns, or rows.
- To select an entire table, click any cell, and on the Layout tool tab, in the Table group, click the Select button, and then click Select Table.
To insert a row
- In the last cell of the last row, press Tab to insert a row at the end of the table.
- On the Layout tool tab, in the Rows & Columns group, click the Insert Above or Insert Below button to insert a row above or below the row containing the cursor.
To insert a column
- On the Layout tool tab, in the Rows & Columns group, click the Insert Left or Insert Right button to insert a column to the left or right of the column containing the cursor.
To delete a row or column
- On the Layout tool tab, in the Rows & Columns group, click the Delete button, and then click Delete Columns or Delete Rows to delete the row or column containing the cursor.
To split one or more cells
Select the cell or contiguous cells that you want to split.
Do either of the following to open the Split Cells dialog box:
On the Layout tool tab, in the Merge group, click the Split Cells button.
Right-click the selection, and then click Split Cells.
In the Split Cells dialog box, specify the number of columns and rows you want the cell to be split into, and then click OK.

You can reform rows and columns at the same time
To merge two or more selected cells in a row or column
- On the Layout tool tab, in the Merge group, click the Merge Cells button.
- Right-click the selection, and then click Merge Cells.
To change the size of a selected element
- To change the width of a column, do either of the following:
Point to the right border of one of its cells, and when the opposing arrows appear, drag the border to the left or right.
On the Layout tool tab, in the Cell Size group, adjust the Table Column Width setting.
- To fit the column to the width of its entries, point to the right border of one of its cells, and when the opposing arrows appear, double-click.
- To change the height of a row, do either of the following:
Point to the bottom border of one of its cells, and when the opposing arrows appear, drag the border up or down.
On the Layout tool tab, in the Cell Size group, adjust the Table Row Height setting.
- To evenly distribute the widths of selected columns or the heights of selected rows, on the Layout tool tab, in the Cell Size group, click the Distribute Columns or Distribute Rows button.
- To change the size of a selected table, do either of the following:
Point to any handle (the sets of dots) around its frame, and then drag in the direction you want the table to grow or shrink.
On the Layout tool tab, in the Table Size group, adjust the Height or Width setting.
Format tables
You can format the text in a table in the same ways you would format regular text. You can also easily do the following:
Align text horizontally or vertically within a cell.
Set the text direction.
Set the cell margins.
Apply Quick Styles, fills, outlines, and text effects.
In addition to formatting the text in a table, you can format the table itself in the following ways:
Apply a ready-made table style.
Customize the style by setting various options.
Add shading, borders, and effects such as shadows and reflections to individual cells.

The predefined table styles reflect the theme colors and currently selected table style options
To align text
- On the Layout tool tab, in the Alignment group, click one of the Align buttons.
To set text direction
- In the Alignment group, click the Text Direction button, and then click one of the rotation options.
To set cell margins
- In the Alignment group, click the Cell Margins button, and then click one of the preset options.
- In the Cell Margins list, click Custom Margins, and then in the Cell Text Layout dialog box, set specific margins.
To apply a table style
- On the Design tool tab, in the Table Styles gallery, click the style you want.
To format selected cells
- In the Table Styles group, click the Shading, Border, or Effects button, and then click the options you want.
To apply Quick Styles and other fancy formatting
- On the Design tool tab, in the WordArt Styles group, click the Quick Styles button, and then click the style you want.
- In the WordArt Styles group, click the Text Fill, Text Outline, or Text Effects button, and then click the options you want in the corresponding galleries.
Objective 4.2: Insert and modify charts
Charts are an excellent tool for presenting a simple message that is supported by numeric data in a way that audience members can easily grasp. You can add a chart to a slide to help identify trends that might not be obvious from looking at numbers.
Create and insert charts
When you create a chart in PowerPoint, you specify the chart type and then use a linked Excel worksheet to enter the information you want to plot. As you replace the sample data in the worksheet with your own data, you immediately see the results in the chart in the adjacent PowerPoint window.

PowerPoint provides a starting point for your chart
You can enter the data directly into the linked worksheet, or you can copy and paste it from an existing Microsoft Access table, Word table, or Excel worksheet. You identify the chart data range in the linked worksheet to ensure that only the data you want appears in the chart, and then close the worksheet to plot the data.
By default, a chart is plotted based on the series of data points in the columns of the attached worksheet, and these series are identified in the legend. You can tell PowerPoint to plot the chart based on the series in the rows instead.
When a chart is active on a slide, the Design, Layout, and Format tool tabs are available on the ribbon.
At any time after you plot data in the chart, you can reopen the attached worksheet and edit the data; PowerPoint updates the chart to reflect your changes.
To create a chart
Do either of the following to open the Insert Chart dialog box:
In a content placeholder, click the Insert Chart button.
On the Insert tab, in the Illustrations group, click the Chart button.
In the Insert Chart dialog box, click a chart category in the left pane, click a chart type in the right pane, and then click OK.
In the linked Excel worksheet, enter the values to be plotted, following the pattern of the sample data.
Ensure that the blue border delineating the chart data range encompasses only the data you want included in the chart by dragging the blue handle in the lower-right corner of the range.
Close the Excel window.
To insert a chart from Excel
In the source workbook, click the chart border to select it.
Copy the chart to the clipboard.
Switch to PowerPoint, display the slide, and then paste the chart from the clipboard.
To open the attached worksheet so that you can edit the chart data
- Right-click the chart, and then click Edit Data.
- Click the chart, and then on the Design tool tab, in the Data group, click the Edit Data button.
Tip
The chart must be active (surrounded by a frame) when you make changes to the data in the worksheet; otherwise, the chart won’t automatically update.
To plot a selected chart by rows instead of columns
Open the chart’s attached worksheet.
On the Design tool tab, in the Data group, click the Switch Row/Column button.
Tip
The Switch Row/Column button is active only when the worksheet is open.
To select worksheet data for editing
- To select a cell, click it.
- To select a column, click the column header (the letter at the top of the column).
- To select a row, click the row header (the number at the left end of the row).
- To select multiple cells, columns, or rows, do either of the following:
Select the first element, and then hold down the Shift key as you select subsequent elements.
Drag through adjacent cells, columns, or rows.
- To select an entire worksheet, click the Select All button (the triangle in the upper-left corner of the worksheet, at the intersection of the row and column headers).
Modify charts
If you decide that the type of chart you initially selected doesn’t adequately depict your data, you can change the type at any time. There are 16 chart categories, each with two-dimensional and three-dimensional variations.
Each chart type has corresponding chart layouts that you can use to refine the look of the chart.

Pointing to any Quick Layout displays a preview of that layout on the current chart
The Quick Layouts are preset combinations of the available chart elements, which include the following:
Chart area This is the entire area within the chart frame.
Plot area This is the rectangle between the horizontal and vertical axes.
Data markers These are the graphical representations of the values, or data points, you enter in the Excel worksheet. Sometimes the data markers are identified with data labels.
Legend This provides a key for identifying the data series (a set of data points).
Axes The data is plotted against an x-axis—also called the category axis—and a y-axis—also called the value axis. (Three-dimensional charts also have a z-axis—also called the series axis.) Sometimes the axes are identified with axis labels.
Axis labels These identify the categories, values, or series along each axis.
Gridlines These help to visually quantify the data points.
Data table This table provides details of the plotted data points in table format.
Titles The chart might have a title and subtitle.
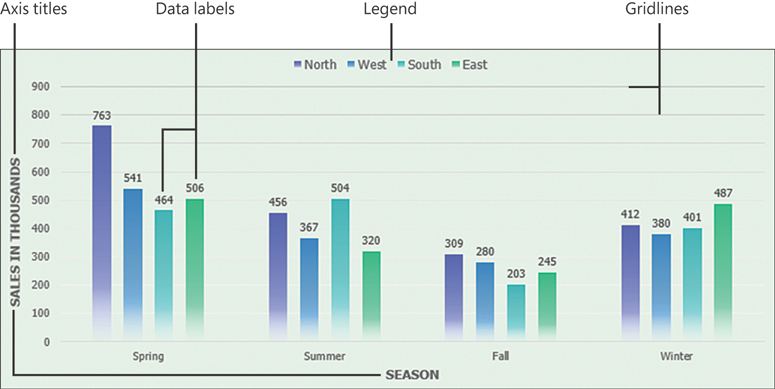
Some of the optional chart elements
When the preset layouts don’t produce the chart you want, you can create a custom layout by mixing and matching different chart elements.
You can adjust a chart layout by adding, deleting, moving, and sizing chart elements. To perform any of those tasks, you must first select the element.
If you want more control over the layout of a chart, you can do the following:
Control the overall size of the chart.
Adjust the size of chart elements.
Arrange chart elements precisely.
To change the type of a selected chart
On the Design tool tab, in the Type group, click the Change Chart Type button.
In the Change Chart Type dialog box, click a category on the left, click a chart type at the top, and then click OK.
Tip
Click a chart type in the top row to preview that chart type as applied to the current data. Point to the preview to display a larger version.
To apply a preset layout to a selected chart
- On the Design tool tab, in the Chart Layouts gallery, click the Quick Layout button, and then click the layout you want.
To add or remove an axis
- On the Design tool tab, in the Chart Layouts group, click the Add Chart Element button, click Axes, and then click to select Primary Horizontal, Primary Vertical, or both.
- Click a selected axis to remove it from the chart.
To add or remove an axis title
- In the Chart Layouts group, click the Add Chart Element button, click Axis Titles, and then click to select Primary Horizontal Axis Title, Primary Vertical Axis Title, or both.
- Click a selected axis title to remove it from the chart.
To add or remove a chart title
- In the Chart Layouts group, click the Add Chart Element button, click Chart Title, and then click None, Above Chart, or Centered Overlay.
To add or remove data labels
- In the Chart Layouts group, click the Add Chart Element button, click Data Labels, and then click None, Center, Inside End, Inside Base, Outside End, or Data Callout.
To add or remove a data table
- In the Chart Layouts group, click the Add Chart Element button, click Data Table, and then click None, With Legend Keys, or No Legend Keys.
To add or remove error bars
- In the Chart Layouts group, click the Add Chart Element button, click Legend, and then click None, Standard Error, Percentage, or Deviation.
To add or remove gridlines
- In the Chart Layouts group, click the Add Chart Element button, click Gridlines, and then click to select Primary Major Horizontal, Primary Major Vertical, Primary Minor Horizontal, Primary Minor Vertical, or any combination of the four options.
- Click a selected gridline option to remove it from the chart.
To add or remove a legend
- In the Chart Layouts group, click the Add Chart Element button, click Legend, and then click None, Right, Top, Left, or Bottom.
To add or remove lines (line charts only)
- In the Chart Layouts group, click the Add Chart Element button, click Lines, and then click None, Drop Lines, or High-Low Lines.
To add or remove a trendline (line charts only)
- In the Chart Layouts group, click the Add Chart Element button, click Trendline, and then click None, Linear, Exponential, Linear Forecast, or Moving Average.
Tip
You can use standard techniques to add pictures, shapes, and independent text boxes to slides to enhance charts.
To change the size of a selected chart
- Point to any handle (the sets of dots around the chart frame), and when the hollow double-headed arrow appears, drag in the direction you want the chart to grow or shrink.
To select a chart element
- Click the element once.
- If the element is difficult to identify or click, on the Format tool tab, in the Current Selection group, display the Chart Elements list, and then click the element you want.
Tip
If you want to activate the chart (that is, select the chart area), be sure to click a blank area inside the chart frame. Clicking any of the chart’s elements will activate that element, not the chart as a whole.
To change the size of a selected chart element
- Point to any handle, and when the hollow double-headed arrow appears, drag in the direction you want the element to grow or shrink.
Tip
If an element cannot be sized, the hollow double-headed arrow does not appear.
To change the position of a selected chart element
- Point to the border around the element, away from any handles, and when the four-headed arrow appears, drag to the desired position.
Tip
Some elements cannot be moved, even if the four-headed arrow appears.
To rotate a three-dimensional chart layout
Right-click the chart, and then click 3-D Rotation.
In the 3-D Rotation area of the Effects page of the Format Chart Area pane, set the angle of rotation for each axis.
Format charts
You can modify and format a chart to get the effect you want. If you don’t want to spend a lot of time on individual chart elements, you can apply styles (predefined combinations of formatting) to the chart area (the entire chart) to create sophisticated charts with a minimum of effort.
Quick Styles include the following:
Chart styles Combinations of data marker, wall, and floor fill colors, background color, and bevel effects
Shape styles Combinations of shape fills, shape outlines, and shape effects
WordArt styles Combinations of text fills, text outlines, and text effects
You can also apply shape style and WordArt style components individually, both to the chart area and to a selected chart element.
In addition to using styles and style components, you can fine-tune the formatting of a selected chart element in its Format pane. Each type of element has a specific Format pane. Most Format panes have multiple pages presenting options such as:
Chart area You can specify the background fill, the border color and style, effects such as shadows and edges, the 3D format and rotation, and the size and position. You can also attach text to be displayed when someone points to the chart.
Plot area You can specify the background fill, the border color and style, effects such as shadows and edges, and the 3D format and rotation.
Data markers You can specify the background fill, the border color and style, effects such as shadows and edges, and the 3D format. You can also precisely determine the gap between data points.
Legend You can specify the background fill, the border color and style, and effects such as shadows and edges. You can also specify the legend’s position and whether it can overlap the chart.
Axes You can specify the background fill, the line color and style, effects such as shadows and edges, and the 3D format and rotation. For the category axis, you can also specify the scale, add or remove tick marks, adjust the label position, and determine the starting and maximum values. You can set the number format (such as currency or percentage), and set the axis label alignment.
Gridlines You can set the line color, line style, and effects such as shadows and edges.
Data table You can specify the background fill, the border color and style, effects such as shadows and edges, and the 3D format. You can also set table borders.
Titles You can specify the background fill, the border color and style, effects such as shadows and edges, and the 3D format. You can also set the title’s alignment, direction, and angle of rotation.
To apply a chart style to a selected chart
- On the Design tool tab, in the Chart Styles gallery, click the style you want.
To apply a shape style to a selected chart component
- On the Format tool tab, in the Shape Styles gallery, click the style you want.
To apply shape style components to a selected chart component
- In the Shape Styles group, click the Shape Fill, Shape Outline, or Shape Effects button, and then click the option you want.
To apply a WordArt style to the text in a selected chart
- On the Format tool tab, in the WordArt Styles gallery, click the style you want.
To apply WordArt style components to a selected chart component
- In the WordArt Styles group, click the Text Fill, Text Outline, or Text Effects button, and then click the option you want.
To display the Format pane for a chart element
- If the element is easy to identify, simply double-click it.
- Right-click the element, and then click Format Element.
- At the top of an open Format pane, click the arrow (the v) to the right of the Options label, and then click the element for which you want to display the Format pane.

Clicking the Options arrow displays a menu of option panes you can switch among
Or
If you have trouble double-clicking a smaller chart element, on the Format tool tab, in the Current Selection group, display the Chart Elements list, and then click the element you want.
In the Current Selection group, click the Format Selection button.
Tip
To display the Format Major Gridlines pane, right-click any gridline, and then click Format Gridlines. To display the Format Data Table pane, right-click the selected data table, and then click Format Data Table.
Objective 4.3: Insert and format SmartArt graphics
When you want to clearly illustrate a concept such as a process, cycle, hierarchy, or relationship, the powerful SmartArt Graphics tool makes it easy to create dynamic, visually appealing diagrams.

SmartArt text is stored as a bulleted list
The content of the diagram is controlled by a single-level or multiple-level list. The appearance is controlled by the SmartArt template. By using the available templates, you can easily construct any of the following types of diagrams:
List These diagrams visually represent lists of related or independent information—for example, a list of items needed to complete a task, including pictures of the items.
Process These diagrams visually describe the ordered set of steps required to complete a task—for example, the steps for getting a project approved.
Cycle These diagrams represent a circular sequence of steps, tasks, or events, or the relationship of a set of steps, tasks, or events to a central, core element—for example, the looping process for continually improving a product based on customer feedback.
Hierarchy These diagrams illustrate the structure of an organization or entity—for example, the top-level management structure of a company.
Relationship These diagrams show convergent, divergent, overlapping, merging, or containment elements—for example, how using similar methods to organize your email, calendar, and contacts can improve your productivity.
Matrix These diagrams show the relationship of components to a whole—for example, the product teams in a department.
Pyramid These diagrams illustrate proportional or interconnected relationships—for example, the amount of time that should ideally be spent on different phases of a project.
Picture These diagrams rely on pictures in addition to text to create one of the other types of diagrams—for example, a process picture diagram with photographs showing changes in a natural formation over time. Picture diagrams are a subset of the other categories but are also available from their own category so that you can easily locate diagram layouts that support images.
Create SmartArt graphics
In PowerPoint (but not in other Office programs), you can easily convert an ordinary bulleted list to a SmartArt graphic that retains the relationship of the bullet levels. Or you can create the diagram and then add text, either directly to its shapes or as a bulleted list in the Text pane, which opens to the left of the diagram. In the Text pane, you can add shapes, delete shapes, and rearrange them by dragging the associated list items.
SmartArt graphic layouts are available from the Choose A SmartArt Graphic dialog box. The categories are not mutually exclusive, meaning that some layouts appear in more than one category.
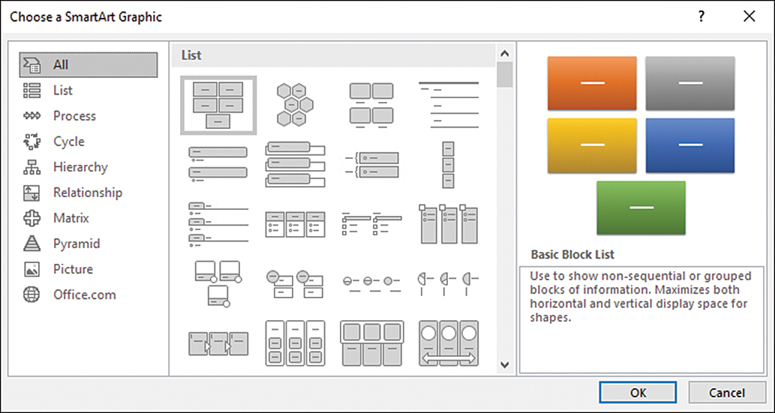
Choose a category based on the type of information you want to present
After you choose a layout, PowerPoint inserts the basic diagram into the slide and displays the associated list format in the Text pane, into which you can enter information. (If the Text pane doesn’t open automatically, you can display it by clicking the button on the left edge of the diagram.) You can enter more or less information than is depicted by the original diagram; most diagrams support a range of entries (although a few are formatted to support only a specific number of entries). You can insert and modify text either directly in the diagram shapes or in the associated Text pane. The SmartArt layout determines whether the text appears in or adjacent to its shapes.
Tip
You change the size, shape, and location of a SmartArt graphic by using the same techniques you use with other graphic elements.
To create an empty SmartArt graphic
On the Insert tab, in the Illustrations group, click the SmartArt button.
In the left pane of the Choose a SmartArt Graphic dialog box, click the type of diagram you want.
In the center pane, click the layout you want, and then click OK.
To create a SmartArt graphic from a bulleted list
- Right-click any item in the list, click Convert to SmartArt, and then click the layout you want.
- Right-click any item in the list, click More SmartArt Graphics, click a layout in the Choose SmartArt Graphic dialog box, and then click OK.
Add and modify SmartArt graphic content
After you create a diagram and add the text you want to display in it, you might find that the diagram layout you originally selected doesn’t precisely meet your needs. You can easily change to a different diagram layout without losing any of the information you entered in the diagram. If a particular layout doesn’t support the amount or level of information that is associated with the diagram, the extra text will be hidden but not deleted, and it will be available when you choose another layout that supports it.
Tip
If a gallery has a sizing handle (three dots) in its lower-right corner, you can resize it. By reducing the height of the gallery, you can display more of the slide and the gallery at the same time.
When you decide on the layout you want to use, you can add and remove shapes and edit the text of the diagram either by making changes in the Text pane or by using the options on the SmartArt tool tabs.
You can make changes such as the following by using the commands on the Design tool tab:
Add shading and 3D effects to all the shapes in a diagram.
Change the color scheme.
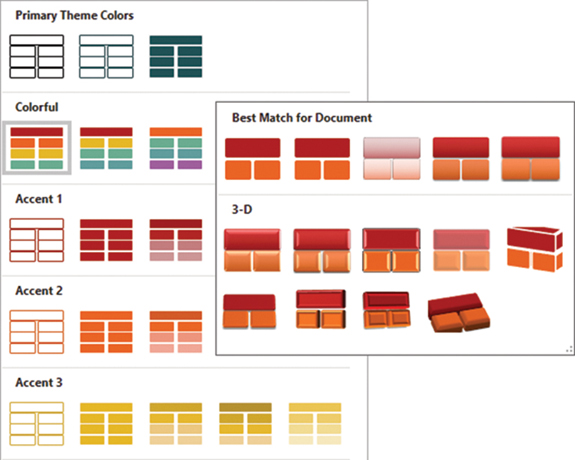
The available colors are based on the presentation theme color scheme
Add shapes and change their hierarchy.
Reverse the order of shapes.
You can customize individual shapes in the following ways:
Change an individual shape—for example, change a square into a star.
Apply a built-in shape style.
Change the color, outline, or effect of a shape.
Change the style of the shape’s text.
The Live Preview feature displays the effects of these changes before you apply them. If you apply changes and then decide you prefer the original version, you can easily return to the unaltered diagram layout.
To add text to a SmartArt graphic
- Click a shape, and then enter the text.
Or
Open the Text pane by doing one of the following:
Click the button (labeled with a left angle bracket) on the left side of the diagram’s frame.
On the Design tool tab, in the Create Graphic group, click the Text Pane button.
Replace the placeholder list items with your own text.
To add a shape to a SmartArt graphic
- In the Text pane, at the right end of the bullet after which you want to add the shape, press Enter, and then enter the text for the new shape.
- Click the shape before or after which you want to add the new shape. On the Design tool tab, in the Create Graphic group, do either of the following:
To add a shape after the selected shape, click the Add Shape button.
To add a shape before the selected shape, click the Add Shape arrow and then click Add Shape Before.
To promote or demote a first-level diagram shape to a subordinate entry
- On the Design tool tab, in the Create Graphic group, click the Promote or Demote button.
- In the Text pane, click at the left end of an entry, and then press Tab to demote it or Shift+Tab to promote it.
Tip
Some SmartArt diagrams are not formatted to accept subordinate entries.
To move an existing shape
- Drag the shape to the new location.
- On the Design tool tab, in the Create Graphic group, click the Move Up or Move Down button.
To reverse the order of shapes in a SmartArt graphic
- On the Design tool tab, in the Create Graphic group, click the Right To Left button.
To delete a shape from a SmartArt graphic
- In the diagram, click the shape, and then press the Delete key.
- In the Text pane, select the list item, and then press the Delete key.
To change the color scheme of a selected diagram
- On the Design tool tab, in the SmartArt Styles group, click the Change Colors button, and then click the color scheme you want.
To apply a style to a selected diagram
- On the Design tool tab, in the SmartArt Styles gallery, click the style you want to apply.
To apply a style to a selected diagram shape
- On the Format tool tab, in the Shape Styles gallery, click the style you want to apply.
Or
On the Format tool tab, click the Shape Styles dialog box launcher.
In the Format Shape pane, on the Fill & Line, Effects, and Layout & Properties pages, choose the effects that you want to apply.
To reset diagram modifications
- On the Design tool tab, in the Reset group, click the Reset Graphic button.
Exam Strategy
Many formatting options are available from the Design and Format tool tabs. Be familiar with the options available on the tool tabs and in the associated dialog boxes.
Objective 4.4: Insert and modify 3D models
Support for inserting, modifying the display of, and animating three-dimensional models was added to Office around the time that Office 2019 was first released. The online 3D model library has been continually enhanced. As of this writing, it includes hundreds of still and animated options in more than 60 categories, including anatomy, animals, celebrations, emojis, geography, industrial components, people, shapes, and more.
You can also create your own 3D models in Microsoft Paint 3D, or work with 3D models that other people supply to you. PowerPoint looks for 3D models in the 3D Objects folder of your user profile.
Supported 3D model file types include:
3D Manufacturing Format (*.3mf)
Binary GL Transmission Format (*.glb)
Filmbox Format (*.fbx)
Object Format (*.obj)
Polygon Format (*.ply)
StereoLithography Format (*.stl)
Insert 3D models
Most 3D models are individual objects; you can display them on their own or combine them into dioramas to illustrate your subject matter.

A slide displaying a 3D image composed from three individual objects
Exam Strategy
The MOS exam environment doesn’t allow candidates to access the internet. MOS exam tasks that require you to demonstrate the ability to insert a 3D model will have you do so from the local computer instead of the online library.
To insert a 3D model on a slide
Do either of the following:
On the Insert tab, in the Illustrations group, click 3D Models (or click the 3D Models arrow, and then click From Online Sources).
If the slide layout includes a content placeholder, click the 3D Models icon in the placeholder.
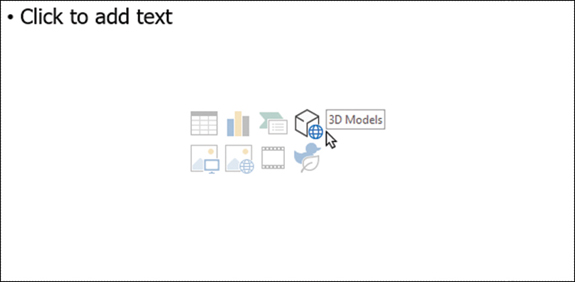
Content placeholders now include options for inserting 3D models and icons
In the Online 3D Models window, do either of the following:
Enter a search term in the search box, and then press Enter to display related models.
Click a category tile to display models in that category.
Locate the model or models you want to insert.
Click the tile for each model you want to insert to display a check mark in the upper-right corner of the tile to indicate that it is selected.
Click Insert to insert the selected model or models onto the slide.
To insert a 3D model from a local folder
On the Insert tab, in the Illustrations group, click the 3D Models arrow (not the button), and then click From a File.
The Insert 3D Model dialog box opens, displaying the contents of your 3D Objects folder.
Browse to the file you want to insert, select the file, and then click Insert.
Tip
You can insert a 3D model file from any connected file storage location.
Modify the display of 3D models
Each 3D model has 18 preset views that you can think of as the perspectives from the outer blocks of a Rubik’s cube into the center. The simplest perspectives are Front, Left, Top, Back, Right, and Bottom. The others are combinations of these basic views: Above Front, Below Front, Above Back, Below Back, Above Front Right, Above Front Left, Above Back Right, Above Back Left, Above Left, Above Right, Below Left, and Below Right.

The 3D Model Views gallery displaying the 18 built-in view options
If none of the standard views displays the 3D model at the perspective you want, you can rotate it freehand. You can also magnify the model (using the Zoom function) and move it within its canvas (using the Pan function) to display only a portion of it or to put additional space around it.

Handles for rotating, panning, and zooming, and the results of doing so
Tip
You can modify the color, texture, design, file type and size, and other properties of 3D models from the online library, or create your own 3D models, by using Microsoft Paint 3D or a third-party application. Modifications such as these are outside the scope of this exam.
To apply a standard view to a selected 3D model
- On the 3D Model tool tab, in the 3D Model Views gallery, click one of the available perspectives.
To manually rotate a 3D model
Select the model. A rotation handle appears in the center of the drawing object.
Drag the rotation handle in the direction you want to rotate the model.
To zoom a selected 3D model within the canvas area
On the 3D Model tool tab, in the Size gallery, click Pan & Zoom. A magnifying glass handle appears to the right of the model.
Point to the magnifying glass. When the pointer changes to a double-headed vertical arrow (the Pan & Zoom handle), drag up to increase down to decrease the size of the model.
After you release the handle, only the portion of the model within the original drawing space is visible.
To move a 3D model within the canvas area
On the 3D Model tool tab, in the Size gallery, click Pan & Zoom. A magnifying glass handle appears to the right of the model.
Drag the model within the drawing space to reveal the portion you want to display.
See Also
For information about applying animations and 3D animations to 3D models, see “Objective 5.2: Animate slide content.”
Objective 4.5: Insert and manage media
There are many ways of communicating information to audiences. PowerPoint is primarily a visual medium through which a presenter displays static information. However, PowerPoint presentations can also include sound and video.
Insert audio and video clips
In addition to the sound effects that are available for slide transitions, you can play audio clips for a specific length of time or throughout an entire slideshow. For example, you might include light background music during a slideshow that plays repeatedly while an audience is entering the room, emphasize a point by playing a sound clip, or prerecord the audio presentation for each slide. You can insert audio clips from a local source or record them directly in PowerPoint.
When you insert an audio clip on a slide, a translucent speaker icon appears in the center of the slide. You can move or resize the icon, and hide it during a slideshow. When the speaker icon is selected, PowerPoint displays a Play/Pause button, a progress bar, an elapsed time counter, and a volume control.
If part of the information that you want to convey to your audience is in video form, you can embed that video on a slide instead of having to play it from a different device. This helps to keep your audience focused on your presentation, and simplifies the setup necessary to present the video. You can insert video clips from an online or local source, or capture screen recordings from within PowerPoint.
After you insert a video clip, you can resize the window it appears in, or even crop the area of the video that is displayed.
It isn’t necessary to edit audio or video prior to inserting it in a presentation. You can trim audio and video clips in much the same way that you can format the appearance of a picture; although the audience hears or sees only what you select, the original media is unaltered.
To embed an existing audio clip on a slide
Save the audio clip on your computer, a connected drive, or a network-connected location.
On the Insert tab, in the Media group, click the Audio button, and then click Audio on My PC.
In the Insert Audio dialog box, browse to the audio file location, click the audio file or thumbnail, and then click Insert.
To record and embed an audio clip
On the Insert tab, in the Media group, click the Audio button, and then click Record Audio.
In the Record Sound dialog box, enter a name for the audio clip, and then click the Record button (the red dot).
Deliver the audio content that you want to record, and when you finish, click the Stop button (the blue square).

You can rename the clip before or after recording it
Do any of the following:
Click the Play button to play back the audio clip.
Click the Record button to re-record the audio clip.
Click Cancel to close the dialog box without saving the audio clip.
Click OK to embed the recorded audio on the slide.

When not selected, the audio icon can be difficult to see against a busy slide background
To insert a local video clip
Do either of the following:
In a content placeholder, click the Insert Video button. Then in the Insert Video window, click From a file.
On the Insert tab, in the Media group, click Video, and then click Video on My PC.
In the Insert Video window, browse to the video location, click the video file or thumbnail, and click Insert.
To insert an online video clip
- Do any of the following:
In a content placeholder, click the Insert Video button.
On the Insert tab, in the Media group, click the Video button, and then click Online Video.
In the Insert Video window, click the video source. Then browse to the video location, click the video file or thumbnail, and click Insert.
To create and insert a screen recording
On the Insert tab, in the Media group, click Screen Recording.
On the control bar that appears, click Select Area, and then drag to select the portion of the screen you want to record.
On the control bar, click Record to begin recording.
Perform the tasks you want to record. When you finish, press Windows key+Shift+Q to stop recording. PowerPoint automatically inserts the screen recording on the slide.
To modify the appearance of a selected audio icon or video window
- On the Format tool tab, in the Adjust, Picture Styles, or Video Styles group, configure the formatting options you want.
To resize a video window
- Drag the window sizing handles.
- On the Format tool tab, in the Size group, set the Video Height or Video Width, and then press Enter.
- On the Format tool tab, click the Size dialog box launcher. In the Format Video pane, configure the height, width, rotation, scale, and aspect ratio settings.
To crop a video window
On the Format tool tab, in the Size group, click the Crop button.
Drag the crop handles to frame the portion of the video window that you want to display.
Tip
Drag the crop frame to move it to a different part of the video window.
Click the Crop button again to apply the changes.
Configure media playback options
You can configure audio to play automatically, to play for a specific amount of time, or to loop continuously during a specific slide or the entire presentation. You can fade gradually into and out of an audio clip. You can also trim the audio clip to play only a specific portion of it.

Specify the points in an audio or video clip that you want to start and finish playback
By default, a video clip plays within its window, but you can configure it to play at full-screen size. You can also configure most of the same playback options for video clips that you can for audio clips, and you can apply the standard picture styles to the video window.
To trim an audio or video clip
On the Playback tool tab, click the Trim Audio or Trim Video button.
In the Trim Audio or Trim Video dialog box, drag the Start and End sliders, or set the Start Time and End Time.
Preview the results and adjust the trim settings if necessary. Then click OK to apply the trim.
To transition into or out of an audio or video clip
- On the Playback tool tab, in the Editing group, set the Fade In and Fade Out times.
To configure the playback options for an audio clip
- On the Playback tool tab, in the Audio Options group, do any of the following:
Click Volume, and then click Low, Medium, High, or Mute.
In the Start list, click On Click or Automatically.
Select the Play Across Slides check box to continue playing the clip when the next slide is displayed.
Select the Loop until Stopped check box to automatically restart the clip when it ends.
Select the Hide During Show check box to hide the audio icon when the slide is shown.
Select the Rewind after Playing check box to automatically return to the beginning of the clip when it finishes.
- On the Playback tool tab, in the Audio Styles group, click the Play in Background button to set the audio options necessary to play the clip continuously from the slide on which it starts until the presentation ends or the clip is stopped.
To configure the playback options for a video clip
- On the Playback tool tab, in the Video Options group, do any of the following:
Click Volume, and then click Low, Medium, High, or Mute.
In the Start list, click On Click or Automatically.
Select the Play Full Screen check box to expand the video to full-screen size while it is playing.
Select the Hide While Not Playing check box to hide the video window after the video ends.
Select the Loop until Stopped check box to automatically restart the clip when it ends.
Select the Rewind after Playing check box to automatically return to the beginning of the clip when it finishes.