
Chapter 18. Entities and Relationships
“The pure and simple truth is rarely pure and never simple.”
Oscar Wilde
This chapter presents a more complex system and introduces a model diagram and its representation in tables.
Relationships
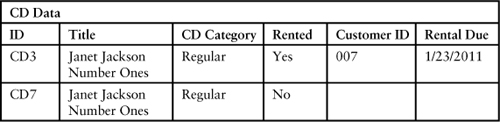
Sam’s system started off with a simple setup—a Customer table and a CD table. The CD table had an entry for each physical CD. This corresponded to Sam’s paper system, in which each CD had a separate index card that recorded its being rented. The table looked like this.
Entities and Relationships
A system is often more complex than Sam’s example. There are more entities than just a CD, and there are relationships between these entities. The business is the source of the information. Any diagrams, models, and tables are based on the business’s understanding of the entities, not an underlying implementation.
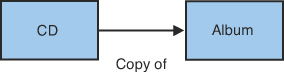
For Sam’s application, there are CDs that are physical copies of an album. If Cathy describes the system with these two concepts, the triad should use these terms. The relationship between CDs and albums can be shown in a diagram. A common diagramming method is Unified Modeling Language [UML].1 The entities are shown in boxes in Figure 18.1. A simple way to represent the relationship that a CD “is a copy of” an album is to have an arrow with a label drawn between the two boxes.
Figure 18.1. Diagram of CD/Album Relationship
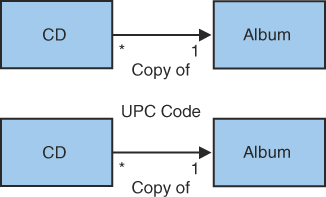
In addition, the ends of the arrow can be labeled with an indication of how many entities are on each side of the relationship, as in Figure 18.2. The * states that there can be many CD copies of an album, and the 1 says that each CD is a copy of only one album. If there is a value, such as the UPC code, that relates the CD to the album, you can add that to the diagram.
Figure 18.2. Diagram of CD/Album Relationship with Specific Relationship
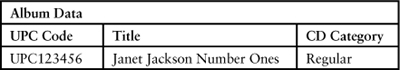
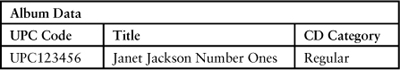
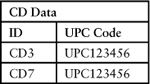
Because the UPC code is what relates this CD to an album, the data for both CD and album would include that value. The CD table now refers to the Album table, as follows.
Multiple Relationships
There could be another entity that Cathy talks about. Instead of a CD containing the state of being rented, there could be a separate concept of a rental. The rental is related to and to the CD by the CD ID and to the customer by the customer ID. Figure 18.3 shows this relationship.
Figure 18.3. Diagram of CD Customer Rental
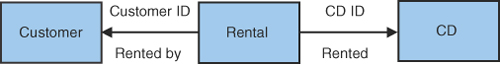
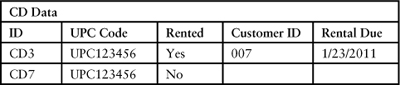
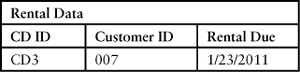
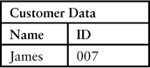
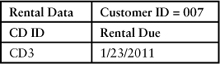
With this new organization, the CD does not contain the concept of whether it is rented or not. That information is now kept in another entity: Rental. This separation of concerns makes a better design and easier testing. Here’s what the tables look like.
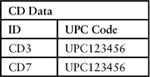

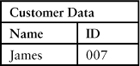
You can further simplify these tables if the triad approves. For example, the Customer ID and Rental Due fields are blank if the CD is not rented. There could be a convention that if the CD is not rented, an entry does not appear in the Rental Data table. So if only CD3 was rented and not CD7, the table would look like this.
With the additional entities, redundant information is eliminated. The number of columns in each table is reduced, so there is less information to process. Using these additional tables, the test for check-in2 can be as follows. The setup part could be in common with a number of other tests.
Check-In CD
Setup:
Given a customer with a rental:
When the clerk checks in the CD:
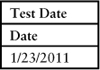
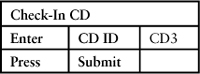
Then the CD is recorded as not rented and the rental fee is computed. (The fee includes one late day.)
![]()
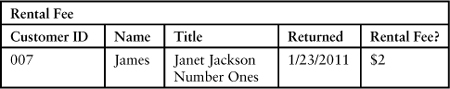
You could discover this more complex relationship after creating the initial tests (in Chapter 10, “User Story Breakup”) that used a single table, such as the first table in this chapter. You may not need to alter the original tests. You could use them with what is called a view. The data in these three tables is combined to appear as a single table.3 The view decouples the way data is represented in the database from the way the business deals with the data.
Alternative Representations
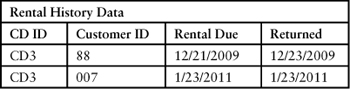
The Rental data could be kept after the CD is checked in as a history of rentals. This history could be represented as a separate table for use in tests (such as in Chapter 13, “Simplification by Separation”). For example, as shown here:
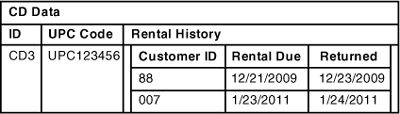
If the business requirements stated that the rental history was only needed in relationship to a CD, the history could be shown as a table embedded in another table.4 This cuts down on the number of tables, but it also increases the table’s size. For example, as shown here:
Summary
• Relationships between entities can be diagramed for ease of understanding.
• Entity relationships can be shown in multiple ways in tables.
• The customer unit determines the preferred form of showing relationships.
• Tests should reflect the entities and relationships.