Retrieving and displaying specific records with a select query is indeed a fundamental task in analyzing data. However, it's just a small portion of what makes up data analysis. The scope of data analysis is broad and includes grouping and comparing data; updating and deleting data; performing calculations on data; and shaping and reporting data. Access has built in tools and functionality designed specifically to handle each one of these tasks.
In this chapter, you take an in-depth look at the various tools available to you in Access and how they can help you go beyond Select queries.
An aggregate query, sometimes referred to as a group-by query, is a type of query you can build to help you quickly group and summarize your data. With a select query, you can only retrieve records as they appear in your data source. However, with an aggregate query, you can retrieve a summary snapshot of your data that will show you totals, averages, counts, and more.
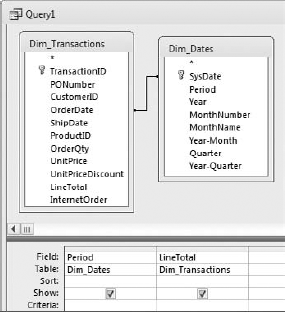
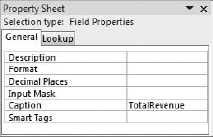
To get a firm understanding of what an aggregate query does, take the following scenario as an example. You have just been asked to provide the sum of total revenue by period. In response to this request, start a query in Design view and bring in the Period and LineTotal fields, as shown in Figure 3-1. If you run this query as is, you will get every record in your dataset instead of the summary you need.
Tip
Here's a quick reminder on how to start a query in Design view. Go to the application ribbon and select Create
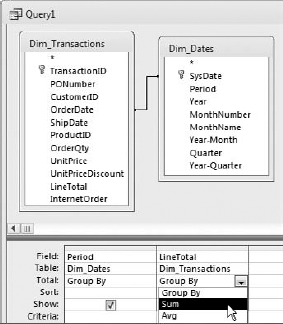
To get a summary of revenue by period, you need to activate Totals in your design grid. To do this, go up to the ribbon and select the Design tab and then click the Totals button. As you can see in Figure 3-2, after you have activated Totals in your design grid, you will see a new row in your grid called "Totals." The Totals row tells Access which aggregate function to use when performing aggregation on the specified fields.
Notice that the Totals row contains the words "group by" under each field in your grid. This means that all similar records in a field will be grouped to provide you with a unique data item. You will cover the different aggregate functions later in this chapter.
The idea here is to adjust the aggregate functions in the Totals row to correspond with the analysis you are trying perform. In this scenario, you need to group all the periods in your dataset and then sum the revenue in each period. Therefore, you will need to use the Group By aggregate function for the Period field and the Sum aggregate function for the LineTotal field.
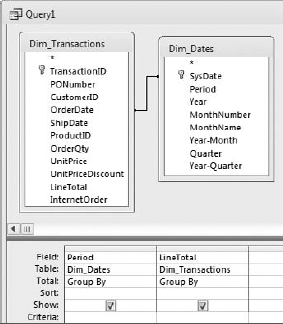
Figure 3.2. Activating Totals in your design grid adds a Totals row to your query grid that defaults to "Group By."
Since the default selection for Totals is the Group By function, no change is needed for the Period field. However, you need to change the aggregate function for the LineTotal field from Group By to Sum. This tells Access that you want to sum the revenue figures in the LineTotal field, not group them. To change the aggregate function, simply click the Totals dropdown and the LineTotal field, shown in Figure 3-3, and select Sum. At this point, you can run your query.
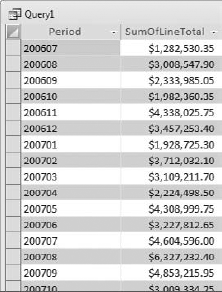
As you can see in Figure 3-4, the resulting table gives a summary of your dataset, showing total revenue by period.
In the example shown in Figure 3-3, you select the Sum aggregate function from the Totals dropdown list. Obviously, you could select any of the 12 functions available. Indeed, you will undoubtedly come across analyses where you will have to use a few of the other functions available to you. In this light, it is important to know what each one of these aggregate functions implicates for your data analysis.
The Group By aggregate function aggregates all the records in the specified field into unique groups. Here are a few things to keep in mind when using the Group By aggregate function.
Access performs the
Group Byfunction in your aggregate query before any other aggregation. If you are performing aGroup Byalong with another aggregate function, the group by function will be performed first. The example shown in Figure 3-4 illustrates this concept. Access groups the Period field before summing the LineTotal field.Access sorts each group by field in ascending order. Unless otherwise specified, any field tagged as a group by field will be sorted in ascending order. If your query has multiple Group By fields, each field will be sorted in ascending order starting with the left-most field.
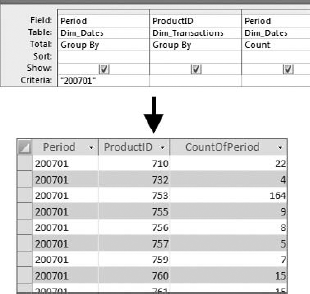
Access treats multiple Group By fields as one unique item.
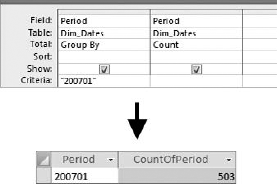
To illustrate the last bullet point, create a query that looks similar to the one shown in Figure 3-7. This query will count all the transactions logged in the "200701" Period.
Now return to the Query Design view and add ProductID, as shown here in Figure 3-8. This time, Access treats each combination of Period and Product Number as a unique item. Each combination is grouped before the records in each group are counted. The benefit here is that you have added a dimension to your analysis. Not only do you know how many transactions per ProductID were logged in 200701, but if you add all the transactions, you will get an accurate count of the total number of transactions logged in 200701.
These aggregate functions all perform mathematical calculations against the records in your selected field. It is important to note that these functions exclude any records set to null. In other words, these aggregate functions ignore empty cells.
Sum: Calculates the total value of all the records in the designated field or grouping. This function will only work with the following data types: AutoNumber, Currency, Date/Time, Yes/No, and Number.Avg: Calculates the Average of all the records in the designated field or grouping. This function will only work with the following data types: AutoNumber, Currency, Date/Time, Yes/No, and Number.Count: Simply counts the number of entries within the designated field or grouping. This function works with all data types.StDev: Calculates the standard deviation across all records within the designated field or grouping. This function will only work with the following data types: AutoNumber, Currency, Date/Time, and Number.Var: Calculates the amount by which all the values within the designated field or grouping vary from the average value of the group. This function will only work with the following data types: AutoNumber, Currency, Date/Time, and Number.
Unlike other aggregate functions, these functions evaluate all the records in the designated field or grouping and return a single value from the group.
Min: Returns the value of the record with the lowest value in the designated field or grouping. This function will only work with the following data types: AutoNumber, Currency, Date/Time, Number, and Text.Max: Returns the value of the record with the highest value in the designated field or grouping. This function will only work with the following data types: AutoNumber, Currency, Date/Time, Number, and Text.First: Returns the value of the first record in the designated field or grouping. This function works with all data types.Last: Returns the value of the last record in the designated field or grouping. This function works with all data types
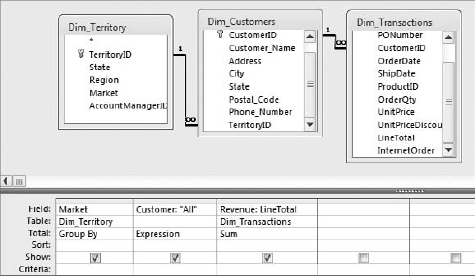
One of the steadfast rules of aggregate queries is that every field must have an aggregation performed against it. However, there will be situations where you will have to use a field as a utility. That is, use a field to simply perform a calculation or apply a filter. These fields are a means to get to the final analysis you are looking for, rather than part of the final analysis. In these situations, you will use the Expression function or the Where clause. The Expression function and the Where clause are unique in that they don't perform any grouping action per se.
This function is generally applied when you are utilizing custom calculations or other functions in an aggregate query. Expression tells Access to perform the designated custom calculation on each individual record or group separately.
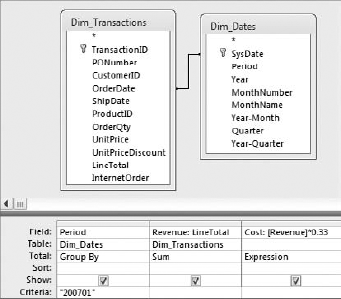
To use this function, you create a query in Design view that looks like the one shown in Figure 3-9.
Note
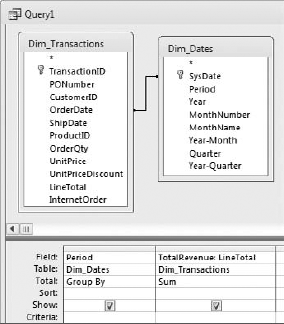
Note that you are using two aliases in this query: "Revenue" for the LineTotal field and "Cost" for the custom calculation defined here. Using an alias of "Revenue" gives the sum of LineTotal a user-friendly name.
Now you can use [Revenue] to represent the sum of LineTotal in your custom calculation. The Expression aggregate function ties it all together by telling Access that [Revenue]*.33 will be performed against the resulting sum of LineTotal for each individual Period group. Running this query will return the total Revenue and Cost for each Period group.
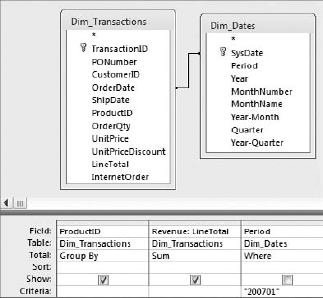
The Where clause allows you to apply a criterion to a field that is not included in your aggregate query, effectively applying a filter to your analysis. To see the Where clause in action, create a query in Design view that looks like the one shown in Figure 3-10.
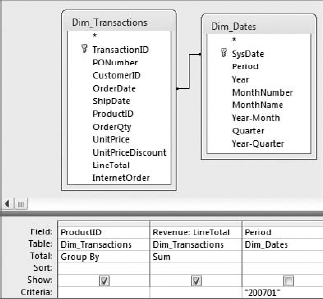
Figure 3.10. Running this query causes an error message because you have no aggregation defined for Period.
As you can see in the Total row, you are grouping ProductID and summing LineTotal. However, Period has no aggregation selected, because you only want to use it to filter out one specific period. You have entered "200701" in the criteria for Period. If you run this query as is, you will get the following error message: "You tried to execute a query that does not include the specified expression Dim.Dates.Period="200701" as part of an aggregate function."
To run this query successfully, click the Totals dropdown for the Period field and select "Where" from the selection list. At this point, your query should look similar to the one shown here in Figure 3-11. With the Where clause specified, you can successfully run this query.
Note
Here is one final note about the Where clause. Notice in Figure 3-9 that the check box in the "Show" row has no check in it for the Period. This is because fields tagged with the Where clause cannot be shown in an aggregate query. Therefore, this checkbox must remain empty. If you place a check in the "Show" checkbox of a field with a Where clause, you will get an error message stating that you cannot display the field for which you entered Where in the Total row.
You can think of an action query the same way you think of a select query. Like a select query, an action query extracts a dataset from a data source based on the definitions and criteria you pass to the query. The difference is that when an action query returns results, it does not display a dataset; instead, it performs some action on those results. The action it performs depends on its type.
Note
Unlike select queries, you cannot use action queries as a datasource for a form or a report, as they do not return a dataset that can be read.
There are four types of action queries: Make-Table queries, delete queries, append queries, and updated queries. Each query type performs a unique action that you will cover in this section.
As mentioned before, along with querying data, the scope of data analysis includes shaping data, changing data, deleting data and updating data. Access provides action queries as data analysis tools to help you with these tasks. Unfortunately, too many people do not make use of these tools; instead, opting to export small chunks of data to Excel in order to perform these tasks.
This may be fine if you are performing these tasks as a one-time analysis with a small dataset. However, what do you do when you have to carry out the same analysis on a weekly basis, or if the dataset you need to manipulate exceeds Excel's limits? In these situations, it would be impractical to routinely export data into Excel, manipulate the data, and then re-import the data back into Access. Using action queries, you can increase your productivity and reduce the chance of errors by carrying out all your analytical process within Access.
A Make-Table query creates a new table consisting of data from an existing table. The table created consists of records that have met the definitions and criteria of the Make-Table query.
In simple terms, if you create a query and would like to capture the results of your query in its own table, you can use a Make-Table query to create a hard table with your query results. You can then use your new table in some other analytical process.
When you build a Make-Table query, you must specify the name of the table that will be created when the Make-Table query is run. If you give the new table the same name as an existing table, the existing table will be overwritten. If you accidentally write over another table with a Make-Table query, you will not be able to recover the old table. Be sure that you name the tables created by your Make-Table queries carefully to avoid overwriting existing information.
The data in a table made by a Make-Table query is not linked to its source data. This means that the data in your new table is not updated when data in the original table is changed.
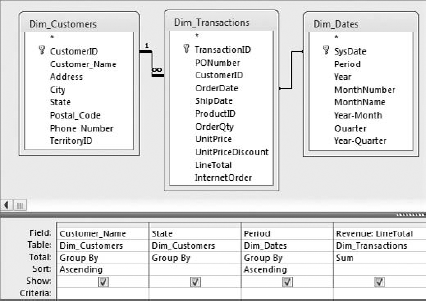
You have been asked to provide the marketing department with a list of customers along with information about each customer's sales history. To meet this task, follow these steps:
Create a query in the Query Design view that looks similar to the one shown here in Figure 3-12.
Go up to the ribbon, select Design

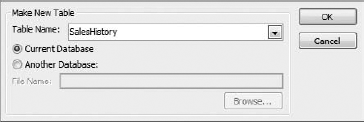
Enter the name you would like to give to your new table in the Table Name input box. For this example, type SalesHistory.
Warning
Be sure not to enter the name of a table that already exists in your database, as it will be overwritten.
Once you have entered the name, click the OK button to close the dialog box, and then run your query. At this point, Access will throw up the warning message shown in Figure 3-14 in order to make you aware that you will not be able to undo this action.
Click Yes to confirm and create your new table.
When your query has completed running, you will find a new table called SalesHistory in your Table objects.
A delete query deletes records from a table based on the definitions and criteria you specify. That is, a delete query affects a group of records that meet a specified criterion that you apply.
Although you can delete records by hand, there are situations where using a delete query is more efficient. For example, if you have a very large dataset, a delete query will delete your records faster than a manual delete. In addition, if you want to delete certain records based on several complex criteria, you will want to utilize a delete query. Finally, if you need to delete records from one table based on a comparison with another table, a delete query is the way to go.
As with all other action queries, you will not be able to undo the effects of a delete query. However, a delete query is much more dangerous than the other action queries because there is no way to remedy accidentally deleted data.
Given that deleted data cannot be recovered, you should get into the habit of taking one of the following actions to avoid a fatal error.
Run a select query to display the records you are about to delete. Review the records to confirm that they are indeed the ones you want to delete, and then run the query as a delete query.
Run a select query to display the records you are about to delete; then change the query into a Make-Table query. Run the Make-Table query to make a backup of the data you are about to delete. Finally, run the query again as a delete query to delete the records.
Make a backup of your database before running your delete query.
The marketing department has informed you that the SalesHistory table you gave them includes records that they do not need. They want you to delete all history before the 200806 Period. To meet this demand, do the following:
Design a query based on the SalesHistory table you created a moment ago.
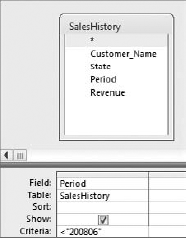
Bring in the Period field and enter <200806 in the Criteria row. Your design grid should look like the one shown here in Figure 3-16.
Perform a test by running the query. Review the records returned, and take note that 6418 records meet your criteria. You now know that 6418 will be deleted if you run a delete query based on these query definitions.
Return to the Design view. Go up to the ribbon and select Design

Since everything checks out, click Yes to confirm and delete the records.
Note
If you are working with a very large dataset, Access may throw up a message telling you that the "undo command won't be available because the operation is too large or there isn't enough free memory."
Many people mistakenly interpret this message to mean that this operation can't be performed because there is not enough memory. This message simply tells you that Access will not be able to give the option of undoing this change if you choose to continue with the action.
This is applicable to delete queries, append queries, and update queries.
An append query appends records to a table based on the definitions and criteria you specify in your query. In other words, with an append query, you can add the results of your query to the end of a table, effectively adding rows to the table.
With an append query, you are essentially copying records from one table or query and adding them to the end of another table. In that light, append queries come in handy when you need to transfer large datasets from one table to another. For example, if you have a table called Old Transactions where you archive your transaction records, you can add the latest batch of transactions from the New Transactions table by using an append query.
The primary hazard of an append query is losing records during the append process. That is, not all of the records you think you are appending to a table actually make it to your table. There are generally two reasons why records can get lost during an append process.
Type Conversion Failure: This failure occurs when the character type of the source data does not match that of the destination table column. For example, imagine that you have a table with a field called Cost. Your Cost field is set as a TEXT character type because you have some entries that are tagged as "TBD" (to be determined), as you don't know the cost yet. If you try to append that field to another table whose Cost field is set as a NUMBER character type, all the entries that have "TBD" will be changed to Null, effectively deleting your TBD tag.
Key Violation: This violation occurs when you are trying to append duplicate records to a field in the destination table that is set as a primary key or is indexed as No Duplicates. In other words, when you have a field that prohibits duplicates, Access will not allow you to append any record that is a duplicate of an existing record in that field.
Another hazard of an append query is that the query may simply fail to run. There are two reasons why an append query might fail:
Lock Violation: This violation occurs when the destination table is open in Design view or is open by another user on the network.
Validation Rule Violation: This violation occurs when a field in the destination table has one of the following properties settings:
Required Field is set to Yes: If a field in the destination table has been set to Required Yes and you do not append data to this field, your append query will fail.
Allow Zero Length is set to No: If a field in the destination table has been set to Zero Length No and you do not append data to this field, your append query will fail.
Validation Rule set to anything: If a field in the destination table has a validation rule and you break the rule with your append query, your append query will fail. For example, if you have a validation rule for the Cost field in your destination table set to >0, you cannot append records with a quantity less than or equal to zero.
Luckily, Access will clearly warn you if you are about to cause any of these errors. Figure 3-21 demonstrates this warning message.
As you can see, this warning message tells you that you cannot append all the records due to errors. It goes on to tell you exactly how many records will not be appended because of each error. In this case, 5979 records will not be appended because of key violations. You have the option of clicking Yes or No. The Yes button ignores the warning and appends all records minus the two with the errors. The No button cancels the query, which means that no records will be appended.
Keep in mind that as with all other action queries, you will not be able to undo your append query once you have pulled the trigger.
Tip
If you can identify the records you recently appended in your destination table, you can technically undo your append action by simply deleting the newly append records. This will obviously be contingent upon your providing yourself a method of identifying appended records. For example, you can create a field that contains some code or tag that identifies the appended records. This code can be anything from a date to a simple character.
The marketing department contacts you and tells you that they made a mistake. They actually need all the sales history for the 2008 Fiscal year. So they need periods 200801 thru 200805 added back to the SalesHistory report.
To meet this demand:
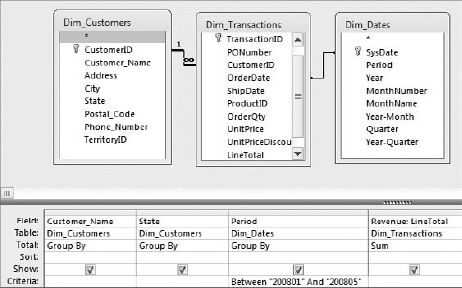
Create a query in the Query Design view that looks similar to the one shown in Figure 3-22.
Go to the ribbon and select Design

Once you have entered your destination table's name, click the OK button. You will notice that your query grid has a new row called "Append To" under the Sort row. Figure 3-24 shows this new row.
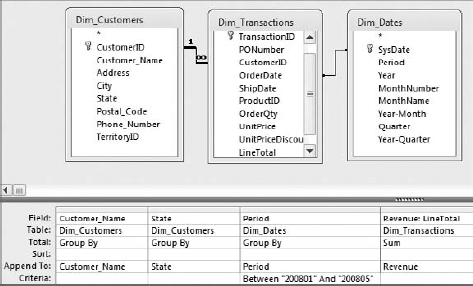
Figure 3.24. In the Append To row, select the name of the field in your destination table where you would like to append the information resulting from your query.
The idea is to select the name of the field in your destination table where you would like append the information resulting from your query. For example, the Append To row under the Period field shows the word "Period." This means that the data in the Period field of this query will be appended to the Period field in the SalesHistory table.
Now you can run your query. After you run your query, Access will throw up a message, as shown in Figure 3-25, telling you that you are about to append 1760 rows of data and warning you that you will not be able to undo this action. Click Yes to confirm and append the records.
An update query allows you to alter the records in a table based on the definitions and criteria you specify in your query. In other words, with an update query, you can change the values of many records at one time.
The primary reason to use update queries is to save time. There is no easier way to edit large amounts of data at one time than with an update query. For example, imagine you have a Customers table that includes the customer's zip code. If the zip code 32750 has been changed to 32751, you can easily update your Customers table to replace 32750 with 32751.
As is the case with all other action queries, you must always take precautions to ensure that you are not in a situation where you cannot undo the effects of an update query. Get into the habit of taking one of the following actions in order to give yourself a way back to the original data in the event of a misstep.
Run a select query to display, then change the query to a Make-Table query. Run the Make-Table query to make a backup of the data you are about to update. Finally, run the query again as an update query to delete the records.
Make a backup of your database before running your update query.
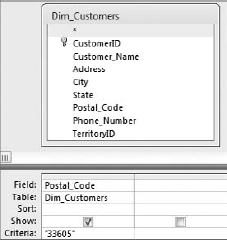
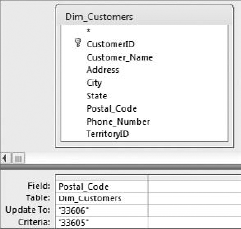
You have just received word that the zip code for all customers in the 33605 zip code has been changed to 33606. To keep your database accurate, you must update all the 33605 zip codes in your Dim_Customers table to 33606.
Create a query in the Query Design view that looks similar to the one shown in Figure 3-29.
Perform a test by running the query.
Review the records returned and take note that six records meet your criteria. You now know that six records will be updated if you run an update query based on these query definitions.
Return to the Design view. Go up to the Ribbon and select Design

Run the query. Access will throw up the message, shown in Figure 3-31, telling you that you are about to update six rows of data and warning you that you will not be able to undo this action. This is the number you were expecting to see, as the test you ran earlier returned six records. Since everything checks out, click Yes to confirm and update the records.
Not all datasets are updatable. That is, you may have a dataset that Access cannot update for one reason or another. If your update query fails, you will get one of these messages: "Operation must use an updatable query" or "This Recordset is not updateable."
Your update query will fail if any one of the following applies:
Your query is using a join to another query: To work around this issue, create a temporary table that you can use instead of the joined query.
Your query is based on a crosstab query, an aggregate query, a Union query, or a subquery that contains aggregate functions: To work around this issue, create a temporary table that you can use instead of the query.
Your query is based on three or more tables and there is a many-to-one-to-many relationship: To work around this issue, create a temporary table that you can use without the relationship.
Your query is based on a table where the Unique Values property is set to Yes: To work around this issue, set the Unique Values property of the table to No.
Your query is based on a table on which you do not have Update Data permissions or is locked by another user: To work around this issue, ensure you have permissions to update the table, and that the table is not in Design view or locked by another user.
Your query is based on a table in a database that is open as read-only or is located on a read-only drive: To work around this issue, obtain write access to the database or drive.
Your query is based on a linked ODBC table with no unique index or a Paradox table without a primary key: To work around this issue, add a primary key or a unique index to the linked table.
Your query is based on a SQL pass-through query: To work around this issue, create a temporary table that you can use instead of the query.
A crosstab query is a special kind of aggregate query that summarizes values from a specified field and groups them in a matrix layout by two sets of dimensions: one set down the left side of the matrix and the other set listed across the top of the matrix. Crosstab queries are perfect for analyzing trends over time or providing a method for quickly identifying anomalies in your dataset.
The anatomy of a crosstab query is simple. You need a minimum of three fields to create the matrix structure that will become your crosstab: The first field makes up the row headings, the second field makes up the column headings, and the third field makes up the aggregated data in the center of the matrix. The data in the center can represent a Sum, Count, Average, or any other aggregate function. Figure 3-33 demonstrate the basic structure of a crosstab query.
There are two methods for creating a crosstab query: using the Crosstab Query Wizard and creating a crosstab query manually using the query design grid.
The Crosstab Query Wizard comes in handy for beginners. Use this wizard when you want a simple guide through the steps of creating a crosstab query.
To activate the Crosstab Query Wizard:
In the ribbon, select the Create tab.
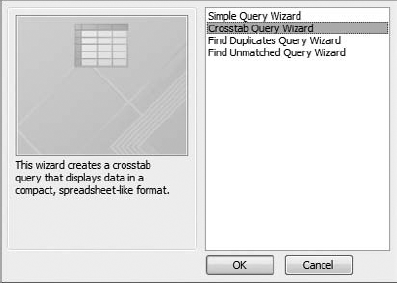
Select the Query Wizard button. This will bring up the New Query dialog box, shown in Figure 3-34.
Select Crosstab Query Wizard from the selection list and then click the OK button.
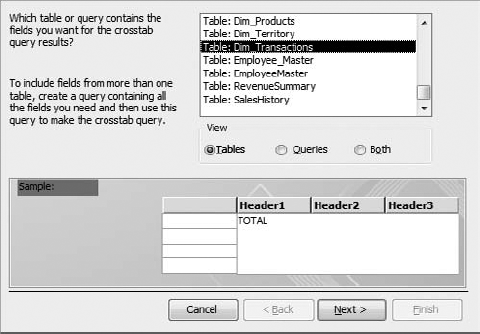
The first step in the Crosstab Query Wizard is to identify the data source you will be using. As you can see in Figure 3-35, you can choose either a query or a table as your data source. In this example, you'll use the Dim_Transactions table as your data source. Select Dim_Transactions and then click the Next button.
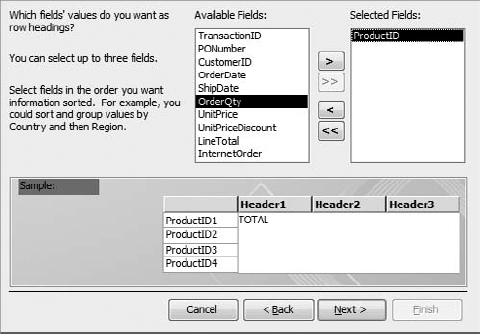
The next step is to identify the fields you would like to use as the row headings. Select the ProductID field and click the button with the > symbol on it to move it to the Selected Items list. At this point, your dialog box should look like Figure 3-36. Notice that the ProductID field is shown in the sample diagram at the bottom of the dialog box.
Note
You can select up to three fields to include in your crosstab query as row headings. Remember that Access treats each combination of headings as a unique item. That is, each combination is grouped before the records in each group are aggregated.
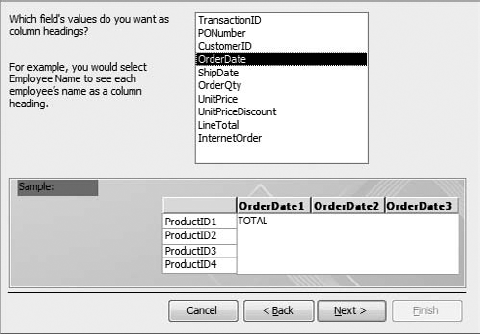
The next step is to identify the field you would like to use as the column heading for your crosstab query. Keep in mind that there can be only one column heading in your crosstab. Select the OrderDate field from the field list. Again, notice in Figure 3-37 that the sample diagram at the bottom of the dialog box updates to show the OrderDate.
Note
If the field used as a column heading includes data that contains a period (.), an exclamation mark (!), or a bracket ([ or ]), those characters will be changed to an underscore character (_) in the column heading. This does not happen if the same data is used as a row heading. This behavior is by design, as the naming convention for field names in Access prohibits use of these characters.
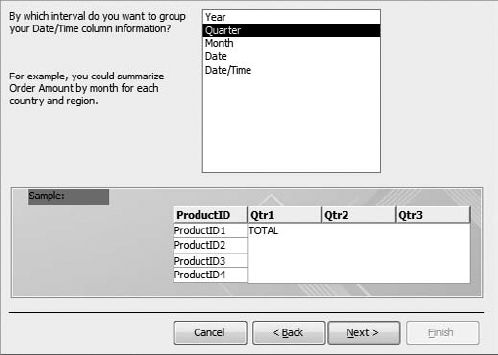
If your column heading is a date field, as the OrderDate is in this example, you will see the step shown here in Figure 3-38. In this step, you will have the option of specifying an interval to group your dates by. Select Quarter here and notice that the sample diagram at the bottom of the dialog box updates accordingly.
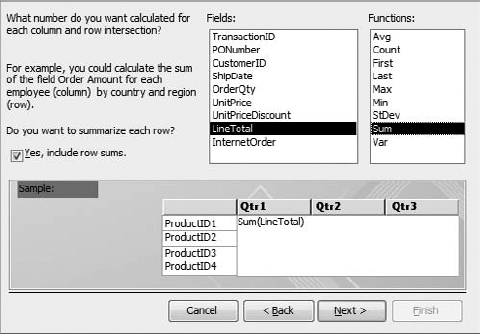
You're almost done. In the second-to-last step, shown in Figure 3-39, you identify the field you want to aggregate and the function you want to use. Select the LineTotal field from the Fields list and then select Sum from the Functions list.
If you look at the sample diagram at the bottom of the dialog box, you will get a good sense of what your final crosstab query will do. In this example, your crosstab will calculate the sum of the LineTotal field for each ProductID by Quarter.
Note
Notice the check box next to "Yes, include row sums." This box is checked by default to ensure that your crosstab query includes a "Total" column that contains the sum total for each row. If you do not want this column, simply remove the check from the checkbox.
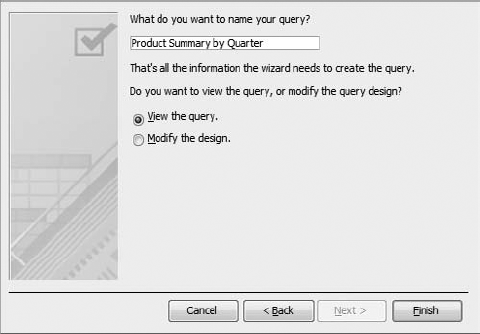
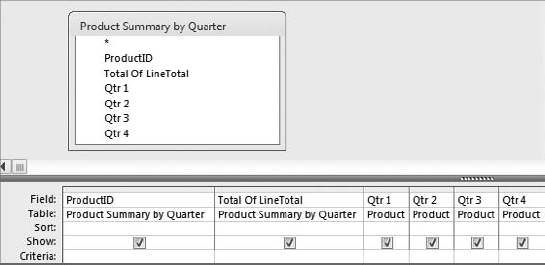
The final step, shown in Figure 3-40, is to name your crosstab query. In this example, you are naming your crosstab "Product Summary by Quarter." After you name your query, you have the option of viewing your query or modifying the design. In this case, you want to view your query results, so simply click the Finish button.
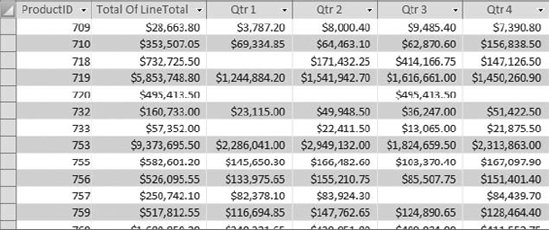
In just a few clicks, you have created a powerful look at the revenue performance of each product by quarter (Figure 3-41).
Tip
To quickly add all of a table's fields to the query design grid, double click the table's title bar. This will select all of the fields (except the asterisk). Now you can drag all of the selected fields to the grid at once.
Although the Crosstab Query Wizard makes it easy to create a crosstab in just a few clicks, it does come with its own set of limitations that may inhibit your data analysis efforts. The following list describes the limitations you will encounter when using the Crosstab Query Wizard:
You can only select one data source on which to base your crosstab. This means that if you need to crosstab data residing across multiple tables, you will need to take extra steps to create a temporary query in order to use as your data source.
There is no way to filter or limit your crosstab query with criteria.
You are limited to only three row headings.
You cannot explicitly define the order of your column headings.
The good news is that you can create a crosstab query manually through the query design grid. As you will learn in the sections to follow, creating your crosstab manually allows you greater flexibility in your analysis.
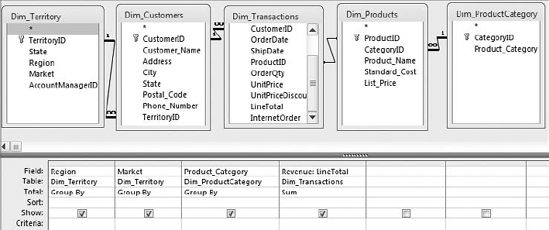
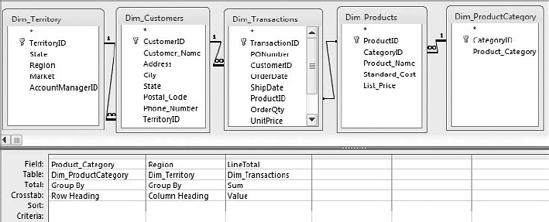
Create the aggregate query shown in Figure 3-43. Notice that you are using multiple tables to get the fields you need. One of the benefits of creating a crosstab query manually is that you don't have to use just one data source. You can use as many sources as you need in order to define the fields in your query.
In the ribbon, select the Design tab. From the Design tab, select the Crosstab button. At this point, you will notice a row in your query grid called Crosstab, as shown in Figure 3-44. The idea is to define what role each field will play in your crosstab query. Under each field in the Crosstab row, you will select where the field will be a row heading, a column heading, or a value.
Run the query to see your crosstab in action.
When building your crosstab in the query grid, keep the following in mind:
You must have a minimum of one row heading, one column heading, and one Value field.
You cannot define more than one column heading.
You cannot define more than one value heading.
You are not limited to only three row headings.
Note
Keep in mind that if you have more than one row heading, you will have to create a join on each row heading.
As useful as crosstab queries can be, you may find that you need to apply some of your own customizations in order to get the results you need. In this section, you will explore a few of the ways to customize your crosstab queries to meet your needs.
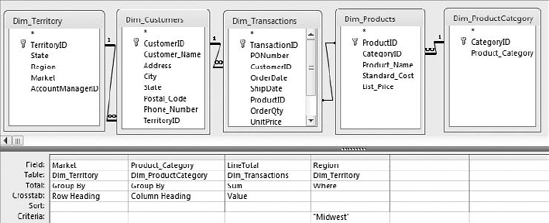
Defining criteria in a crosstab query: The ability to filter or limit your crosstab query is another benefit of creating a crosstab query manually. To define a filter for your crosstab, simply enter the criteria as you normally would for any other aggregate query. Figure 3-48 demonstrates this concept.
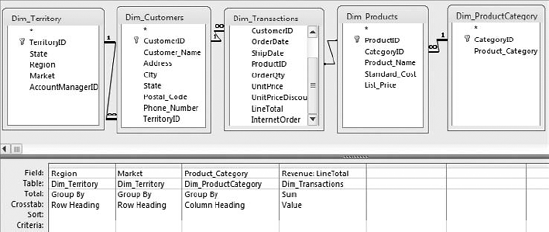
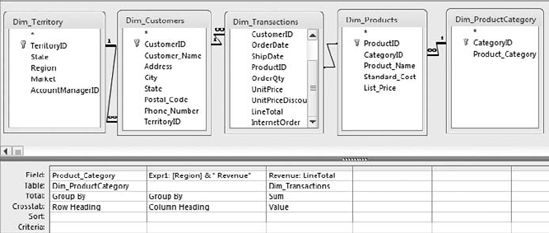
Changing the sort order of your crosstab column headings: By default, crosstab queries sort their column headings in alphabetical order. For example, the crosstab query in Figure 3-49 will produce a dataset where the column headings read this order: Canada, Midwest, North, Northeast, South, Southeast, Southwest, and West.
This may be fine in most situations, but if your company headquarters is in California, the executive management may naturally want to see the West region first. You can explicitly specify the column order of a crosstab query by changing the Column Headings attribute in the Query Properties.
To get to the Column Headings attribute:
Open the query in Design view.
Right click in the grey area above the white query grid and select Properties. This activates the Query Properties dialog box, shown in Figure 3-50.
Enter the order you would like to see the column headings by changing the Column Headings attribute.
Tip
Adjusting the Column Headings attribute comes in handy when you are struggling with showing months in month order instead of alphabetical order. Simply enter the month columns in the order you would like to see them. For example: Jan, Feb, Mar, Apr, May, Jun, Jul, Aug, Sep, Oct, Nov, Dec.

Figure 3.50. The Column Headings attribute is set to have the column read in this order: West, Canada, Midwest, North, Northeast, South, Southeast, and Southwest.
When working with the Column Headings attribute, keep the following in mind:
Each column name should be in quotes and separated by commas. If you omit the quotes, Access will insert them for you.
Accidentally misspelling a column name results in that column being excluded from the crosstab results and a dummy column with the misspelled name being included with no data in it.
You must enter every column you want to include in your crosstab report. Excluding a column from the Column Headings attribute excludes that column from the crosstab results.
Clearing the Column Headings attribute ensures that all columns are displayed in alphabetical order.
Data analysis often goes beyond selecting small extracts of data. The scope of data analysis also includes grouping and comparing data; updating and deleting data; performing calculations on data; and shaping and reporting data. Unfortunately, many Excel users don't realize that Access has built-in tools and functionality designed specifically to handle each of these tasks.
Aggregate queries allow you to quickly group and summarize data, aggregating the returned dataset into totals, averages, counts, and more. Similarly, crosstab queries summarize values and group them in a matrix layout, perfect for analyzing trends over time or providing a method for quickly identifying anomalies in your dataset.
Action queries go beyond just selecting data by actually performing some action on the returned results. The action performed depends on the type of action query you are using. There are four types of action queries: Make-Table queries, delete queries, append queries, and update queries:
Make-Table queries create a new table consisting of the data resulting from the query.
Delete queries delete records from a table based on the definitions and criteria you specify in the query.
Append queries append records to a table based on the definitions and criteria you specify in your query. In other words, with an append query, you can add the results of your query to the end of a table, effectively adding rows to the table.
Update queries allow you to edit large amounts of data at one time.
Utilizing the tools and functionality outlined in this chapter will help you carry out all your analytical processes within Access, saving you time, increasing your productivity, and reducing the chance for error.

