The Political Economy of Personalization
It’s becoming quite apparent to us that the world of playing the perfect music to people and the world of playing perfect advertising to them are strikingly similar.
—Eric Bieschke, chief scientist at Pandora
In his 1995 book Being Digital, Nicholas Negroponte described a world in which everyone had a virtual newspaper entirely tailored to his or her personal taste. Negroponte proposed creating an intelligent, computerized “interface agent” that would “read every newswire and newspaper and catch every TV and radio broadcast on the planet, and then construct a personalized summary”:
It would mix headline news with “less important” stories relating to acquaintances, people you will see tomorrow, and places you are about to go to or have just come from. It would report on companies you know. In fact, under these conditions, you might be willing to pay the Boston Globe a lot more for ten pages than a hundred pages, if you could be confident that it was delivering you the right subset of information. You would consume every bit (so to speak). Call it The Daily Me.1
Negroponte’s vision of The Daily Me proved highly influential, partly because it arrived just as the web was starting to transform the media landscape. The notion was endorsed by key technology industry leaders and top public policymakers as well as scholars.2 Much subsequent scholarship focused on media self-selection as functionally equivalent to The Daily Me, with particular worry that the internet would allow a partisan “echo chamber.”3
In recent years, improved filtering technologies and the emergence of social networking sites have produced something strikingly close to Negroponte’s original vision. Online sellers such as Amazon.com and eBay pioneered this technology,4 with other digital giants close behind. News sites such as Google News, CNN, and Yahoo! News now also rely heavily on learning algorithms. Facebook in particular has emphasized hyperpersonalization, with Facebook founder and CEO Mark Zuckerberg stating that “a squirrel dying in your front yard may be more relevant to your interests right now than people dying in Africa.”5 With the rise of the iPad and its imitators, Negroponte’s idea that all of this personalized content would be sent to a thin, lightweight, “magical” tablet device has been partially realized, too.
Scholarship such as Siva Vaidhyanathan’s The Googlization of Everything and Joe Turow’s The Daily You has viewed the trend toward personalized content and ubiquitous filtering as a part of a worrying concentration of corporate power. Eli Pariser’s bestselling book The Filter Bubble voices similar worries. But for journalism and media scholarship as a whole, as Barbie Zelizer has noted, there has been surprisingly little work on recommender systems.6 To the extent that algorithmic news filtering has been discussed at all, it was long unhelpfully lumped with a grab bag of different site features under the heading of “interactivity.”7 Research by Neil Thurman and Steve Schifferes has provided a taxonomy of different forms of personalization and has chronicled their (mostly growing) deployment across different news sites.8 Even Thurman and Schifferes’s work, however, has said little about recommender systems because traditional news organizations lagged in deploying them. As this book goes to press, new journalism and communication scholarship has finally started to address this longstanding gap.9 Still, much work remains to be done.
This chapter has two main aims. First, it offers a more detailed examination of the principals behind these recommendation systems than previous media scholarship. Recommender systems research has changed dramatically over the past decade, but little of this new knowledge has filtered into research on web traffic, online news, or the future of journalism. Much of the writing on recommender systems in these fields has been an unhelpful montage of hypotheticals and what-ifs. Elaborate deductive conclusions have been built from false foundational assumptions.
Second, this chapter examines the comparative impact of these technologies across media organizations, something that previous work has overlooked or misunderstood. Scholarship to date has focused on the impact of these technologies for an individual web user or an adopting media firm. But there has been little exploration of the wholesale effects of these changes not only within news and media organizations, but also with regard to competition between them.
This chapter takes a detailed look at the Netflix Prize—a contest with surprising lessons even for those who do not care about movies. As it turns out, the task of recommending the right movie is similar to recommending almost anything—predicting which songs users like, which ads they prefer, which news stories they engage with.
The Netflix Prize was the first large open-submission machine learning contest, and it produced big improvements in the accuracy of recommender systems. This contest remains perhaps the best lens through which to see the general principles of how recommender systems function.
The chapter goes on to examine how the general principles of targeting content apply to the broader attention economy. Two case studies are laid out in more detail: Google News, the algorithmic news pioneer, and Yahoo!, which has revealed much about how its behavioral targeting ad technology works. Taken together, these cases tell us much about who will win, and who will lose, as recommender systems assume a growing role in the delivery of media content.
These techniques, however, are not just for media organizations. The chapter concludes by looking at the Cambridge Analytica scandal, perhaps Facebook’s biggest public relations disaster to date. As the author was the first to report,10 Cambridge Analytica modeled Facebook user data using methods similar to those that won the Netflix Prize. Cambridge Analytica’s example shows that data held by digital giants, coupled with now-standard machine learning techniques, can be an important tool to match citizens with online political messages.
But to understand the broader context, this chapter begins by talking more generally about the economics of search. Media targeting and personalization are part of a more fundamental problem in economics: how to efficiently match buyers and sellers.
THE COSTS OF SEARCH
In 1961 the economist (and later Nobel laureate) George Stigler published an article titled simply “The Economics of Information.” Stigler’s focus was on the effort needed to connect buyers and sellers. Potential buyers want to pay as little as possible, but it costs time to compare prices. Moreover, the savings earned by continuing to search get smaller and smaller the longer a search goes on. A couple shopping for a car are far more likely to save money after checking a second or third auto dealership than they are from checking prices at the ninety-ninth or the hundredth. Stigler argued that diverse and geographically big markets have especially high search costs.
How does one lower the costs of search? One answer is to localize markets, as has happened for thousands of years as merchants clustered in bazaars or town squares or shopping districts. Advertising is a slightly more recent attempt to lower search costs. Classified advertising in particular provides a mediated marketplace where buyers and sellers can meet.
Another solution, as Stigler explained, involves the creation of market makers: “specialized traders whose chief service … is implicitly to provide a meeting place for potential buyers and sellers.”11 He suggested that such firms can take a variety of forms, from large used car dealers to trade journals to specialized information brokers. Stigler also predicted that the largest market-making firm is likely to eclipse any competitors: “Since the cost of collection of information is (approximately) independent of its use … there is a strong tendency toward monopoly in the provision of information.”12
Reading Stigler fifty years later, one is struck by how closely the logic above describes segment after segment of the web. If big, complicated markets have always tended to produce a single dominant information firm or a market-making monopolist, then the internet—the biggest and most complicated market in history—should produce these effects in spades.
Indeed it does. Take auctions. Auction houses are canonical examples of market makers. The art auction houses Sotheby’s and Christie’s localize markets, first segmenting art into subgroups by genre, time period, and region, and then holding auctions at regular intervals. Auction houses have many mechanisms to prevent price dispersion—or more plainly, to ensure that neither sellers nor buyers get ripped off. Substantial research goes into the sale catalogue, which describes each work and verifies its provenance. Insurance and security are substantial investments. Together, Christie’s and Sotheby’s account for the vast majority of high-end art sales worldwide. The duopoly has been prevented from merging only by antitrust laws—and even without a merger, the two companies have in the past colluded to set prices, leading to the criminal conviction of two top Sotheby’s executives.
It is therefore unsurprising that a single firm—eBay—has come to dominate the online auction market. In addition to providing a centralized virtual marketplace, eBay has mechanisms to reduce price dispersion and ensure quality. Price history for similar items is easy to see, and eBay’s reputation system and insurance policies help ensure that items bought will arrive as promised.
Yet other successful firms that dominate their online niche also turn out, upon closer inspection, to look like market makers or specialized information brokers. The market for books is large and complex for both publishers and readers. Amazon began by providing a virtual place for book buyers and publishers to meet, and giving targeted information to buyers about which books they were likely to enjoy. Netflix fulfills a similar role in the movie and television series marketplace (more on Netflix shortly).
But the most powerful extension of Stigler’s framework goes beyond the sale of goods. The costs of search do not apply just to physical goods or market transactions. As Stigler emphasized, the key cost of search is not money but time. In this light, Google itself is a market maker, matching purveyors of information with information consumers.
Yet there are crucial differences between traditional market making and the algorithmic matching that has taken over the web. One key distinction is that—at scale—recommendation algorithms often outperform human experts. Among Amazon.com’s early employees were about a dozen book critics and editors, who wrote reviews and suggested books. But as Amazon developed more sophisticated recommendation systems in the late 1990s, A/B tests showed that machine picks generated far more sales than the expert choices.13 Continuing to use human experts was costing Amazon millions of dollars a year.
But the success of recommendation systems in some contexts raises a host of questions. How exactly do these systems work? How much do they change patterns of content consumption? Which sorts of firms, and which websites, are able to use them most effectively? The story of the Netflix Prize gives insight into all of these questions.
NETFLIX AND CONTENT RECOMMENDATION
In October of 2006, movie-rental service Netflix kicked off the Netflix Prize, a worldwide competition to improve its video recommendation algorithm. At the time Netflix rented DVDs to subscribers by mail. A typical Netflix user signed up wanting to see a short list of movies, which she watched within a few months. Whether the subscriber stayed or left thus depended on her ability to find new movies to watch.
Netflix offered a $1 million prize to the first team that could beat CineMatch, its in-house recommendation engine. Even more remarkably, Netflix actually released its data. Once the contest started, anyone could download a real-world dataset containing 100,480,500 one-to-five star ratings, from 480,189 anonymous users, for 17,770 movies. The contest would end up running for more than two-and-a-half years, and engaging the efforts of more than five thousand teams. In the process, it illuminated much that is usually hidden about the ways in which digital firms personalize the content that users see.
The central task of the contest was an example of collaborative filtering, using automated methods to infer a user’s tastes from the preferences of other users. The key contest metric was root mean-squared error (RMSE)—a measure of how much, on average, a recommendation model misses the true value. If Joe Netflix Subscriber gives The Empire Strikes Back five stars, and the original CineMatch algorithm predicted that he would give it 4.5 stars, then the root squared error would be ![]() . (Squaring the errors, and then taking the square root, means that the RMSE is always positive.)
. (Squaring the errors, and then taking the square root, means that the RMSE is always positive.)
The contest hoped to drop the error as low as possible. Predicting that every user would give a movie its average rating produced an RMSE of 1.054—a typical error of more than a star in either direction. Netflix’s CineMatch offered an initial RMSE of.9525, about a tenth of a star better. Netflix described CineMatch as a relatively simple approach, “straightforward statistical linear models with a lot of data conditioning.”14 The contest winner, if any, would be the first team to drop the RMSE to.8572. Though this would still leave the model off by more than four-fifths of a star, this was twice the improvement CineMatch had managed on its own.
The contest showed rapid progress out of the gate. Within a week, several teams had equaled CineMatch; within three weeks CineMatch had been bested by 3 percent. These efforts revealed that CineMatch was actually a K-nearest neighbor (KNN) algorithm. If we wanted to predict Maria’s rating for Titanic, for example, a KNN approach might start by finding the users who (1) saw Titanic and (2) agree with Maria’s ratings of other movies—for example, those who also hated Gladiator but gave five loving stars to A Beautiful Mind. Once this “neighborhood” of similar subscribers is found, Maria’s predicted rating for Titanic is just a weighted average of her neighbors’ ratings. If Alex, Becky, and Chris are the users most similar to Maria, and they gave Titanic 1, 4, and 5 stars respectively, then Maria’s predicted rating is just 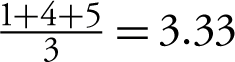 . KNN approaches dominated the early months of the contest.
The Netflix Prize attracted a wide range of participants from industry, the academy, and even some members of the general public. By late November, a team from AT&T Research Labs had also joined the competition. The team’s key members were Yehuda Koren, a computer scientist and network visualization specialist, and Robert Bell, a statistician with a focus on machine learning. Bell and Koren called their team BellKor, and the duo would ultimately form the nucleus of the winning team.15
One goal of the open competition was to attract and aggregate insights from a far broader and diverse group than otherwise possible. As Netflix had hoped, one of the largest single improvements came from an unlikely source. In early December 2006, participants were surprised to see the name Simon Funk jump to third place on the leaderboard. Simon Funk was the pseudonym of Brandynn Webb, a computer scientist who had worked on artificial intelligence and pattern recognition.
While many teams were highly secretive about their methods, Funk explained his entire approach in a detailed blog post.16 Funk had applied a factor analysis technique called singular value decomposition (SVD) to the Netflix data. SVD modeled the millions of movie ratings as the sum of a (smaller) number of unknown variables. As Funk explained on his blog,
The end result of SVD is essentially a list of inferred categories, sorted by relevance. Each category in turn is expressed simply by how well each user and movie belong (or anti-belong) to the category. So, for instance, a category might represent action movies, with movies with a lot of action at the top, and slow movies at the bottom, and correspondingly users who like action movies at the top, and those who prefer slow movies at the bottom.17
While this is true in theory, interpreting factors can be difficult in practice, as we shall see.
SVD had rarely been used with recommender systems because the technique performed poorly on “sparse” datasets, those (like the Netflix data) in which most of the values are missing. But Funk adapted the technique to ignore missing values, and found a way to implement the approach in only two lines of C code.18 Funk even titled the blog post explaining his method “Try This at Home,” encouraging other entrants to incorporate SVD.
Nearly all of the top competitors did so. When the Netflix Prize was finally awarded, SVD methods were the the largest component of the models on the winning and second-place teams.
Still, it is unlikely that SVD techniques on their own would have been powerful enough to win the competition. One unexpected revelation of the contest was the advantage of blending different learning techniques together. As BellKor reported at the end of the first year, “Combining predictions from multiple, complementary models improved performance, with one model’s strengths compensating for the weaknesses of others.”19 While SVD might be the single best technique, it would often miss relationships that would be obvious to a human observer, like recommending a sequel to a user who had liked the first movie in a series. KNN models were much better at finding clusters of closely related films.
By the end of the contest, teams were using megablends of hundreds of different models. And while latent-factor models like SVD and nearest-neighbors models made up the largest portion of the solutions, the final blends included a complex mishmash of different techniques, from principle component analysis to ridge regression to Restricted Boltman Machine neural network approaches. As AT&T’s Chris Volinsky explained, “I don’t think when we started that anybody expected that that would be the way to win the competition.”20
The same premium on diverse approaches also led, eventually, to a wave of mergers among teams. The Netflix Prize rules, in addition the $1 million grand prize, called for the awarding of $50,000 yearly”Progress Prizes” for the team currently closest to the goal, providing that there had been substantial progress. The catch was that the winning Progress Prize team had to publish a full accounting of their techniques, allowing competitors to catch up.
As the end of the first year neared, BellKor had led narrowly since March. But with only a day left in the Progress Prize window, the fifth- and sixth-place teams combined their predictions, and the blended results vaulted them into second place. This unexpected move set off a flurry of last-minute activity (and forum debates about whether this new tactic was fair). The second- and third-place Dinosaur Planet and Gravity teams followed suit with a hasty merger of their own (When Gravity and Dinosaurs Unite), and the merged team submitted a final score that edged out BellKor’s previous best. The BellKor team worked through the night, submitting two buzzer-beating entries that eked out a narrow victory in the Progress Prize.
At the end of the first year BellKor had managed an 8.43 percent improvement over CineMatch. But most of the easy progress had already been made. Over the next year the pace of improvement would be far slower. In early 2008, after the publication of BellKor’s methods, several new teams appeared in the top twenty sites. In February, When Gravity and Dinosaurs Unite passed BellKor to take a narrow lead.
As the contest dragged on, it became clear that the BellKor team would be unable to win the prize on its own. So it, too, decided to seek the improvements that other teams had shown when they combined their efforts. As AT&T’s official account later explained, “Teams that collaborated always improved over their individual scores provided each team brought different methods to the table.”21
Bob Bell suggested a method by which teams could compare their results, without giving away all of their secrets. By adding statistically regular noise to their predicted ratings, teams could share their output and perform simple calculations to see how similar their approaches were. These results showed that the team BigChaos was the best merger candidate. BigChaos had a relatively low error rate, but, more importantly, its predictions were least correlated with the predictions of BellKor, suggesting a potential payoff to collaboration. After legal negotiations, the merger went through.
As it turned out, much of BigChaos’s contribution came from using sophisticated neural networks to blend the results. As the AT&T team later wrote, “Where BellKor used simple, linear blending based on each model’s individual performance, BigChaos had determined that the individual RMSE of a single method was not the best indication of how much that model would add to the blend.”22
With the improvements from BigChaos, the combined team won the second Progress Prize in October 2008 by a comfortable margin. But progress soon stalled. Once again, the solution was to find another team to merge with. This time the candidate was Pragmatic Theory. Pragmatic Theory was particularly good at identifying unusual or even quirky predictors, like the length of a film’s title, or users that rated films differently on Sunday than they would on Monday. On their own, these sorts of features predict little about users’ ratings. In the context of the full model, however, they gave a small added boost in accuracy.
The teams initially disguised the merger by continuing to post separately. By adding noise to their results, they could see how close they were to the 10.0 percent finish line without alerting other teams to their progress. By June 2009, the newly merged team knew that they had reached their goal. On June 26, 2009, the team went public, submitting a 10.05 percent result under the name BellKor’s Pragmatic Chaos (BPC).
The hectic conclusion of the Netflix Prize proved a replay of the first Progress Prize. The posting of a result with better than 10 percent improvement, as required by the rules, triggered a final 30-day period for all teams to submit their final answers. With nothing to lose, many teams rushed to join forces. The main competitor to the BellKor-led effort ended up being a super-group called The Ensemble, which ultimately comprised twenty-three different original teams or individual competitors, including the previously merged Dinosaur Planet and Gravity groups. The Ensemble improved rapidly in the last few weeks of the contest. In the final days, The Ensemble seemed to nudge past BPC on the public leaderboard. But since the leaderboard was based on public data, and the contest would be judged on a similar but unreleased private dataset, it was not clear who was really in the lead.
On September 21, 2009, almost three years after the contest opened, BellKor’s Pragmatic Chaos was publicly announced as the winner. Only later was it revealed that The Ensemble had achieved the exact same level of improvement: an RMSE of 0.8567. BPC had won because of a tie-breaker in the fine print of the contest: BPC’s final results had been submitted twenty-four minutes earlier. After years of effort, the contest had ended in a photo finish.
THE LESSONS OF THE NETFLIX PRIZE
Why should those interested in online audiences or digital news care about the Netflix Prize? One answer is that these recommender systems now have enormous influence on democratic discourse. In his book The Filter Bubble progressive activist Eli Pariser reported that posts from conservative friends were systematically excluded from his Facebook feed. This sort of filtering heightens concerns about partisan echo chambers, and it might make it harder for citizens to seek out opposing views even if they are inclined to. Increasingly, learning algorithms are also replacing editorial judgment and longstanding news norms.
Yet recommender systems should be of interest for an even more fundamental reason. Recommender systems do not just influence which articles users see, but also which sites they end up visiting in the first place.
Whether they are funded by advertising or subscriptions, websites require traffic to succeed. Sites live or die based upon their stickiness—their ability to attract readers, to make those readers stay longer when they visit, and to convince them to return again once they leave. Even slight differences in site stickiness compound quickly and rapidly create enormous differences in audience. Recommendation systems are one of the most powerful tools available for sites to keep and grow their traffic, and those who cannot deploy them are at a profound competitive disadvantage.
The key question is this: which sorts of sites can build, and benefit most from, high-quality recommender systems?
The Netflix contest provides a partial answer. Moreover, the Netflix Prize is likely the only chance we will have in the near future to look at the inner-workings of web recommendation systems using a large, public, real-world dataset. Netflix initially planned a successor contest to the Netflix Prize. However, facing a class-action lawsuit and an FTC investigation regarding user privacy, Netflix canceled the intended sequel.23 Given these legal complications, other large digital firms have been wary about sponsoring similar contests or releasing comparable datasets.
The Netflix Prize is often discussed as an example of crowdsourced problem solving. The results of the contest, however, suggest that the advantages of recommender systems will accrue highly unevenly. The very largest sites have been able to build excellent content recommendation systems; the smallest sites have not.
Recommender systems favor large, well-resourced organizations. In order to inspire such a high level of participation, Netflix had to be willing to write a $1 million check. Large teams won the competition, and the winning team needed to merge with two other teams to cross the finish line. Even stronger evidence for this point comes from The Ensemble’s nearly successful last-minute scramble to catch up. By combining the efforts of more than a dozen other teams, The Ensemble was quickly able to equal the results of BellKor’s Pragmatic Chaos. Indeed, The Ensemble would likely have won if the contest had continued just a few days longer.
Building successful algorithms is an iterative and accretive process. It benefits from larger groups and diverse approaches, and thus provides inevitable size advantages. As the competition evolved, the models produced became absurdly complex. Managing this complexity also requires expertise and substantial staffing.
Similarly, the sorts of individuals who rose up the contest leaderboard also suggest limits to crowdsourced problem solving in contests like the Netflix Prize. Those who led the most successful teams were already prominent academic or corporate researchers. Even those who were initially unfamiliar names, such as Funk (Brandynn Webb) or the Princeton undergraduates who made up the Dinosaur Planet team, had formal training and relevant professional experience. The project benefited little from average citizens, but it benefited greatly from drawing on a broader and more diverse set of those with subject-area expertise. Netflix would never have been able to hire that level of expertise even at five times the contest budget. But if the research and positive publicity was worth it, the effort nevertheless required a seven-figure investment.
Not only do big sites have a large edge in terms of resources, but they also have an even more crucial advantage: more data. Building infrastructure to collect, store, organize, analyze, and constantly update data is an enormous investment. This is not something that a small startup could have done nearly as successfully, and not just because of the money, hardware, and expertise required. Data come from monitoring users, and startups do not have nearly as many users to monitor. As AT&T’s team put it, “As the competition progressed, using more information almost always improved accuracy, even when it wasn’t immediately obvious why the information mattered or how little the information contributed.”24
The need for as much information as possible has broad implications. One fact often overlooked is that Netflix already had reached the overall level of accuracy they paid one million dollars for. As the contest FAQ explained,
The RMSE experienced by customers on the Netflix site is significantly better than the RMSE reported for the training dataset. This is due both to the increase in ratings data but also to additional business logic we use to tune which of the large number of ratings to learn from …let’s just say we’d be seriously in the running for a Progress Prize, if we were eligible.25
In other words, even at the start of the competition, Netflix was able to do significantly better than the raw CineMatch results indicated. They did this both by adding more variables and by training on a larger dataset. The same techniques used to extract more information from a simple list of users and movie ratings work even better with data from (for example) user demographics or browsing behavior.
Subsequent statements from Netflix show that they have gone even further in this direction. Netflix’s business has changed dramatically since 2006, as the company has gone from a DVD-by-mail model to a focus on video streaming over the web. In a blog post detailing their followup to the Netflix Prize, they explain that they now operate as if “everything is a recommendation,” and that they extract information from almost every aspect of user behavior.26 Most site features are now personalized based on this data. Netflix claims that optimized models and additional features provide them with a five-fold improvement over ratings data alone.27
Yet for learning algorithms more broadly, what constitutes more information is not always obvious. More data is not just about more variables. In the initial stages of the competition, several teams attempted to supplement the movie data with a host of other details about each movie: the director, actors, studio, genre, year, etc. In simple linear models, the inclusion of this data at first seemed to improve the results. But with more sophisticated latent-factor models and nearest-neighbor models, adding movie details did not improve the predictions at all, because the machine learning models had already implicitly included all of this information.
More information can also be found even without collecting more data, by transforming the existing dataset to extract new features. Koren, in a lecture a few months after the contest’s end, declared, “One thing that we discovered again and again …is that understanding the features in the data, or the character of the data, …is far more important than picking the right model or perfecting the model.”28 The Netflix competition started off with a very limited feature set: just user, movie, rating, and day of rating. Jumps in accuracy involved taking that limited data and extracting new features, like temporal effects.
The moral here is somewhat paradoxical. Netflix released a massive dataset to find the best algorithm, but the algorithms themselves proved less important than the data. Similar lessons have emerged in other, quite different realms of machine learning. In research on natural language processing, Microsoft researchers examined how accuracy improved across several different algorithms as the amount of training data increased. Although these algorithms showed dramatically different performance on tests of one million words, as the researchers scaled up the training set—to ten million, one hundred million, and finally one billion words—the algorithms’ performance became more and more similar. As Banko and Brill concluded, “These results suggest that we may want to reconsider the trade-off between spending time and money on algorithm development versus spending it on corpus development.”29
The Netflix contest also highlighted several parts of the “black box problem.” One disadvantage of complex learning techniques is that when a model is performing well, it is often not clear why. The success of latent factor models in the competition emphasized this issue. In theory, one might think of latent factor models as revealing human-interpretable categories like “action movie vs. non-action movie,” or “serious vs. escapist,” or “male-focused vs. female-focused.” Sometimes the results that latent factor models give do seem to map easily to categories that humans already understand or expect.
But that is not really what happened with the Netflix Prize. The dimensions that popped out of the data do not map neatly to obvious predefined categories. Funk’s first attempt at using an SVD model found that the most important dimension was anchored on one end by films like Pearl Harbor (2001), Coyote Ugly (2000), and The Wedding Planner (2001), while the other end of the scale was defined by films like Lost in Translation (2003), The Royal Tenenbaums (2001), and Eternal Sunshine of the Spotless Mind (2004).30 These are very different sorts of films, yet it is tough to articulate a concise description of what separates these groups. As Koren later concluded, “It is very difficult to give names to these axes.”31 And if one latent-factor model is tough to interpret, how much harder is it to interpret the final blend of more than seven hundred models—many of which were themselves blends of different component models?
In one way, however, Netflix’s example calls into question claims that filtering technologies will end up promoting echo chambers and eliminating serendipitous exposure. Such worries have been a centerpiece of scholarship on personalized news over the past decade (see earlier discussion). One of Pariser’s key claims about what he terms the “filter bubble” is that it is ostensibly invisible to users.32 Netflix, however, tries hard to make users aware of its recommendation system: “We want members to be aware of how we are adapting to their tastes. This not only promotes trust in the system, but encourages members to give feedback that will result in better recommendations.”33 Netflix also attempts to explain (in an oversimplified way) why specific movies are recommended, typically highlighting its recommendations’ similarity to movies the user has already rated.
Even more important, Netflix shows that there is a performance boost for recommending diverse content, not just for predicting ratings accurately. Partly, this is because Netflix subscriptions are often shared among members of a household who may have very different tastes. But as Netflix explains, “Even for a single person household we want to appeal to your range of interests and moods. To achieve this, in many parts of our system we are not only optimizing for accuracy, but also for diversity.”34 The biggest, most blended models that drew on the most varied features performed best overall in the Netflix Prize. In hindsight, it is perhaps unsurprising that recommending a highly diverse basket of movies also ends up improving performance. But given concerns about “filter bubbles” and online echo chambers, a performance bonus for diversity challenges conventional wisdom.
GOOGLE NEWS
The Netflix experience demonstrated several features of recommender systems that are likely to persist across many different websites and varied genres of online content. In recent years, several of the largest online websites have been willing to release greater details about their recommender systems, and the algorithms with which they personalize content for their users. Even more so than with the Netflix Prize, the information released by companies like Google, Yahoo!, Microsoft, and Facebook is only an incomplete picture of the whole. These companies are understandably wary about releasing information that would give their competitors an advantage or would compromise user privacy.
Nonetheless, recent disclosures do provide key details about how recommender systems are being applied in practice, and how they benefit some organizations over others. In particular, the results of A/B testing provide compelling evidence of just how important personalized content is for improving site traffic. Recommendation systems dramatically increase stickiness for the largest websites in ways small sites cannot replicate.
Consider the case of Google News, one of the largest news sites on the web, and a pioneer in replacing editorial judgment with algorithmic decision-making. In 2007, Google researchers released a paper detailing the company’s internal work in news personalization.35 In some ways recommending news stories is similar to recommending movies. Most users, most of the time, arrive at a news site without knowing which specific articles they would like to see. As Google’s researchers put it, user attitudes are dominated by the demands to “show us something interesting.”36
Yet news targeting also presents a series of unique problems, too. First, news articles provide a particularly severe example of the “cold start” or “first rater” problem. All personalization algorithms perform well with lots of information on both the items to be recommended and individual user preferences. With movies, for example, the accuracy increases for a user as he or she rates more movies, and as each movie gets reviews from a larger number of Netflix subscribers. News content, however, shows an enormous amount of turnover day to day, and even hour to hour. By definition news readers are most interested in content that is new, precisely the articles that lack substantial training data. Making the matter worse, it is quite costly—in both time and computing power—to constantly rebuild or retrain the recommendation framework to offer predictions for the newest content. Because site speed is one of the most important parts of the user experience, personalized results have to be returned to the user in no more than a couple hundred milliseconds.
The technical infrastructure that Google News requires is daunting: numerous large-scale data centers, more than one million server computers, enormous investments in fiber, even customized operating systems and file systems. Total development costs for this infrastructure, including both hardware and software components, ran into the tens of billions of dollars. Many recommendation algorithms are computationally costly to implement at scale, and some of Google’s researchers’ findings focus on achieving similar performance with less computation. Their initial paper details several slightly different algorithms, all in the same general family of methods as the K-nearest-neighbor algorithm described earlier.
The most dramatic results in the paper come from Google’s testing of the extent to which these personalized recommendations improve traffic numbers. By interleaving personalized results with results based just on popularity, Google was able to control for the fact that higher-ranked items get more attention. The results were striking: overall, stories based on collaborative filtering had 38 percent more clicks than stories chosen just based on popularity.37
These early methods have now been superseded by even more effective forms of targeting. In 2010, Google released a second report on its targeting algorithms in Google News.38 Here Google distinguished between the collaborative filtering approaches, which were the basis of its earlier work, and content-based approaches. Collaborative filtering looks at the similarity between users and between items, whereas content-based methods use text analysis to match users with the types of stories they have favored in the past. Content-based models proved better at recommending brand-new stories, and they better allowed for user differences. For example, Google reported that its first-generation collaborative filtering mechanism recommended entertainment news stories to all users, even those who had never once clicked on entertainment news: “entertainment news stories are generally very popular, thus there [were] always enough clicks on entertainment stories from a user’s ‘neighbors’ to make the recommendation.”39
Google’s 2010 report details a hybrid model combining both collaborative and content-based approaches. When the recommendation system has few news clicks from a user, its predictions rely on collaborative methods, which focus on current popular stories. Once the system records a significant amount of click data, recommendations are based more and more on users’ past behavior and demonstrated interests.
This hybrid model shows dramatic improvements over collaborative filtering alone, which (again) was itself far better than simply recommending to users whatever was popular. Compared to straight collaborative filtering, the hybrid model produced 31 percent more clicks on news stories, though this was largely the result of shifting traffic from interior sections of the site to recommended stories on the front page. Even more importantly, over the course of the study users who saw the hybrid model had 14 percent more daily visits to the Google News site. This is a clear demonstration of just how much improved recommendation systems can boost daily traffic.
Other computer science researchers have produced traffic bonuses with news recommendation engines. Hewlett-Packard researchers Evan Kirshenbaum, George Forman, and Michael Dugan conducted an experiment comparing different methods of content recommendation on Forbes.com. Here too, as at Google, the researchers found that a mixture of content-based and collaborative-filtering methods gave a significant improvement.40
YAHOO! AND BEHAVIORAL TARGETING
If Google’s results are potentially worrisome for traditional news organizations, research from Yahoo! is perhaps even more dispiriting. Yahoo!, too, has been highly active in personalizing and targeting its news results. While Yahoo! itself has been circumspect about releasing details of its news targeting methods, journalistic accounts have similarly claimed big improvements in news traffic and click-through rates. Yahoo! reported that personalized targeting increased clicks on its news page’s “Today” box by 270 percent.41
But if Yahoo! has been relatively discreet about its news targeting methods, research papers have pulled back the curtain on its targeted advertising abilities. The same technologies that provide users with the most clickable content also allow advertisers to match their messages to the most promising potential buyers. Understanding how this behavioral targeting works is crucial for understanding the political economy of online media.
There are three general types of online ad targeting. At the broadest level there is property targeting, in which ads are run on sites that feature related content or favorable demographics. Showing truck ads on an automobile site or a sports site is an example of property targeting. Second, there is a user segment targeting, which typically focuses on the age range and gender of the user: for example, showing ads for trucks to 25–40 year-old men across a wider variety of properties.
Both of these methods are crude compared to behavioral targeting. As the Yahoo! researchers explain, “The key behind behavioral targeting is that the advertisers can show ads only to users within a specific demographic of high-value (such as people likely to buy a car) and combine that with a larger number of opportunities (places to show ads) per user.”42 In this case the Yahoo! researchers used support vector machines, a common machine learning technique, to predict which users were likely to be good prospects. But it is almost certain that similar results would have been obtained with other learning techniques.
The key difference between the Yahoo! research and earlier targeting efforts (at least publicly acknowledged ones) lies in the type of training data. Typically, behavioral targeting models have looked at clicks on an online ad as the key metric. Yahoo! researchers instead trained their data on “conversions,” sales that resulted directly from clicking on an online ad.43
Clicks on ads are uncommon, with typical click-through rates just a fraction of a percent. And if clicks are rare, conversions are only a tiny fraction of clicks. Increasingly, however, retailers have provided web beacons that beam sales information back to advertising networks or partner sites. Still, only a handful of organizations have the detailed user behavior and conversion data necessary to target in this way.
Yahoo!’s research demonstrates just how much purchase data matters. Pandey and collaborators performed A/B testing between models trained on conversion data and the same methods trained just on click data. In four tested real-world advertising campaigns, conversions increased between 59 and 264 percent. In every case there was a dramatic drop in advertisers’ cost per sale. Advertisers ultimate goal, of course, is to get the greatest number of sales for the least advertising cost. The bottom line, as the researchers conclude, is that “we can improve the number of conversions per ad impression without greatly increasing the number of impressions, which increases the value of our inventory.”44
The research also suggests that the greatest improvements accrue to the largest advertising campaigns. Since conversions are rare, only the largest campaigns have enough sales data to train the models effectively. This is especially noteworthy given that Yahoo! is one of the largest sites on the web, with an enormous online ad inventory. If only the largest campaigns on the largest sites are able to take advantage of these techniques, this has significant implications for the web as a whole.
What do these results mean for news sites? For starters, they show that standalone news organizations cannot perform behavioral targeting nearly as effectively as Yahoo! or Google. Many newspaper executives and print publishers have argued that local newspaper websites are valuable because they (supposedly) reach a local audience. The problem is that location targeting through property targeting is, by modern standards, extremely crude and inefficient. Nearly everyone who visits local newspaper sites also visits the most popular sites. Potential local customers can be found more cheaply and efficiently on Yahoo! or Facebook than on the local newspaper website.
Size matters for behavioral targeting. Even on Yahoo!, one of the largest online publishers, small advertising campaigns cannot be targeted as effectively as large ones. Few newspapers have conversion data, and no campaign on a mid-sized local news site has the scale that effective targeting requires. This means that newspapers must either partner with big sites or online ad networks—at substantial cost—or else subsist on much lower impression prices than their inventory would receive on a larger website. Neither alternative is attractive.
RECOMMENDATION SYSTEMS AND POLITICAL TARGETING
There is an important coda to the story of the Netflix Prize. Today SVD and similar approaches are not just used to recommend movies or match consumers with product ads. Reporting by the author has revealed that techniques pioneered by the Netflix Prize have been adapted for online political targeting.45
Cambridge Analytica is a British political consulting firm best known for its role in the 2016 Donald Trump campaign and the 2015 Brexit campaign in the United Kingdom. For years Cambridge Analytica courted controversy—and garnered skepticism—by claiming that it used “psychographic” models that supposedly targeted voters based on personality traits.
In March 2018 the Guardian reported that Cambridge Analytica had downloaded tens of millions of Facebook profiles using a personality test app, as part of a partnership with Cambridge University researchers Aleksandr Kogan and Joseph Chancellor.46 The revelation of this “data breach” sparked regulatory investigations on both sides of the Atlantic. Yet a key question remained: how exactly had these models built on Facebook data worked?
Based on the research in this chapter, I had a hunch that Kogan and Chancellor were doing singular value decomposition or something similar. I emailed Kogan to ask—and somewhat to my surprise, he replied.
“We didn’t exactly use SVD,” Kogan wrote. Instead, he explained, “the technique was something we actually developed ourselves…. It’s not something that is in the public domain.” Yet he confirmed that his approach was a close cousin of SVD. The same kinds of dimension reduction models that Funk had adapted for the Netflix Prize were the core of Cambridge Analytica’s Facebook models.
Knowing the original approach of Cambridge Analytica’s model answers some long-standing questions. If Kogan’s account is accurate, the inferred categories that the model produces are not about personality per se. Instead, they boil down demographics, social influences, personality, and everything else into a big correlated lump. Information about users’ personality traits seems to have made only a modest contribution to the model’s accuracy.
Still, this class of model is remarkably good at guessing personal details and political partisanship from seemingly trivial social media data, such as whether the user liked the Wu-Tang Clan or curly fries. Research by Mikal Kosinski, David Stillwell, and Thore Graepel showed that an SVD model made with users’ Facebook “likes”—but without any demographic information—was 95 percent accurate at guessing race and 93 percent accurate at guessing gender.47 Even more impressive, it was 88 percent accurate at distinguishing gay from straight men and 85 percent accurate at separating Democrats from Republicans. That level of accuracy is a floor, not a ceiling: any additional data boosts accuracy even higher. Kogan’s model seems to have produced results comparable to this public research.
Modern campaigns depend heavily on voter databases to predict citizens’ partisanship and their likelihood of turning out to vote. Only 28 percent of the users targeted by the Trump campaign on Facebook, however, were matched to the voter file.48 SVD and similar dimension reduction techniques can make good guesses about users’ political leanings even without data that is obviously personally revealing.
We should not exaggerate the effectiveness of these models, which are far from a crystal ball. Nonetheless, Netflix-style models were a real advantage for the 2016 Trump campaign. These techniques can condense information about individuals into usable form, even when that information is scattered across dozens or hundreds of different variables. Now that this approach is known to be effective, it is likely to be duplicated in countless other campaigns and with other kinds of digital trace data. Reaching users on Facebook and other large sites increasingly requires the kind of data mining that produced these digital giants in the first place.
LESSONS AND QUESTIONS
The rise of recommender systems as a key mechanism of content delivery is a tectonic shift in the media landscape, on par with the arrival of the rotary press or the emergence of the web itself two decades ago. Like these previous shifts, recommendation technology strongly favors some organizations over others.
What can we conclude from what we know about the inner workings of targeting and recommendation systems? Scholarship to date suggests six broad, interrelated lessons about which types of organizations are likely to win—and lose—in a world with ubiquitous algorithmic filtering.
First, and most important, recommender systems can dramatically increase digital audience. Web traffic is properly thought of as a dynamic, even evolutionary process. Recommender systems make sites stickier, and users respond by clicking more and visiting more often. Over time sites and apps with recommender systems have grown in market share, while those without have shrunk.
Second, recommender systems favor digital firms with lots of goods and content. There is only value in matching if the underlying catalogue of choices is large. Small outlets benefit little: users do not need help sorting through the content of a news site that produces only three articles a day. In the same vein, sites that have a wide diversity of content benefit most from recommender systems. Publications with a narrower scope—say, sites that focus just on technology news or entertainment gossip—derive less value from recommender systems.
Third, recommendation systems benefit firms with better hardware and more staff expertise. Even when the underlying techniques are relatively standard for the industry, deploying them in a production environment still takes substantial time, energy, equipment, and effort. Moreover, targeting techniques are often expensive in terms of CPU cycles and computing resources. Smaller organizations are unlikely to have the hardware and resources needed to deploy cutting-edge techniques.
The expertise and equipment needed to target content can also be used to target advertising. Personalization systems can provide dramatically better results for advertisers, generating more sales per dollar of ad spending while increasing the overall value of a site’s ad inventory. As the Yahoo! research shows, some sites are far better at targeting than others. Sites that make more money in online advertising can use that revenue to produce even more content or to improve their sites, further increasing their advantages over competing organizations.
Fourth, recommender systems benefit firms with more data. The most popular and most heavily used sites have a significant advantage in building recommender systems over sites that are currently less popular. More signals, and a greater diversity of signals, significantly improve performance.
Fifth, personalization systems promote lock-in, making it costly for individuals to switch between sites and apps. Consider an occasional user of Google News who visits Yahoo! News or Bing for the first time. Initially, this user will see news content that is a significantly poorer match for her individual news tastes. Much of this apparent advantage is temporary: more time spent on the Yahoo! News site provides more information for Yahoo!’s targeting algorithms. From the user’s perspective, though, personalization algorithms create barriers to moving from one provider to another.
Lastly, recommender systems promote audience concentration. This is the opposite of what most previous scholarship has assumed. Negroponte concluded that the The Daily Me would be a powerful decentralizing and dispersive force: “The monolithic empires of mass media are dissolving into an array of cottage industries …the media barons of today will be grasping to hold onto their centralized empires tomorrow.”49
While Negroponte’s technological vision was prophetic, his economic logic was precisely backward. There is a long tradition in media scholarship that ties homogenized, broadcast media with media consolidation.50 Mass broadcasting provided large economies of scale, whereby the same sitcom or news broadcast could be seen in hundreds of millions of homes simultaneously.
But most observers have failed to understand that personalization can produce the same result as broadcast standardization. One large website, by learning its users’ tastes, can match users to their preferred content far more efficiently than hundreds of small “cottage industry” sites. Economies of scope—where the efficiencies come from providing a broad mix of different products—generate concentration just as surely as economies of scale do. The Daily Me provides media organizations with unprecedented economies of scope, and increasingly they succeed not by being “monolithic,” but by being all things to all users.