
The Visual Studio environment, solution, and project have separate debug settings:
Debug settings of the Visual Studio environment are set in the Options window. (From the Tools menu, choose the Options command, and select the Debugging entry in the left-hand pane.)
Debug settings of a project are set in the <project> Properties window, which is opened by using the <project> Properties command on the Project menu.
Debug settings of a solution are set in the Solution Property Pages dialog box, which is opened by right-clicking the solution in Solution Explorer and choosing Properties from the context menu.
The debugging settings for Visual Studio apply to all projects. You can configure Edit And Continue, just-in-time (JIT) debugging, native debugging options, symbol servers, and general debugging options for the environment.
The general debugging options are an assortment of miscellaneous options. Each option can be enabled or disabled. Figure 15-4 shows the General settings in the Debugging category of the Options window.
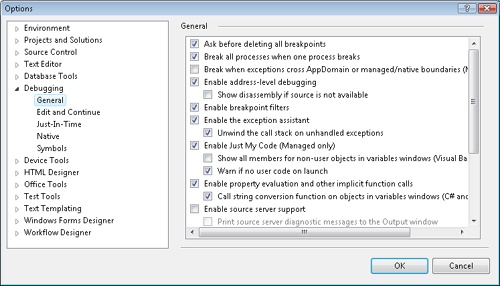
Each option for C# is described in Table 15-2.
Table 15-2. General debugging options
Option | Description | Default |
|---|---|---|
Ask Before Deleting All Breakpoints | Requires confirmation when using the Delete All Breakpoints command. | Enabled |
Break All Processes When One Process Breaks | Breaks all processes being debugged by Visual Studio in the current debugging session when any process is interrupted. | Enabled |
Break When Exceptions Cross Appdomain Or Managed/Native Boundaries (Managed Only) | Asks the Common Language Runtime (CLR) to catch exceptions that cross an application domain or that cross between managed and native code. | Disabled |
Enable Address-Level Debugging | Enables some operations at the address level, such as setting breakpoints on instruction addresses. | Enabled |
Show Disassembly If Source Is Not Available | Requests that the disassembly window be displayed when user source code is not available. | Disabled |
Enable Breakpoint Filters | Lets developers set filters on breakpoints, where filters can be based on the thread, process, and machine context. | Enabled |
Enable The Exception Assistant | Automatically displays the Exception Assistant for managed exceptions. | Enabled |
Unwind The Call Stack On Unhandled Exceptions | Asks Visual Studio to unwind the call stack when an exception occurs. | Enabled |
Enable Just My Code (Managed Only) | Has the debugger step into only user code. System code, optimized code, and code without symbols are not stepped into. | Enabled |
Warn If No User Code On Launch | Displays a warning when debugging is initiated if no user code is available. | Enabled |
Enable Property Evaluation And Other Implicit Function Calls | Allows properties and other implicit functions to be evaluated in the QuickWatch and variables windows. | Enabled |
Call String Conversion Function On Objects In Variables Windows (C# And JavaScript Only) | Converts objects to strings when displayed in variables windows. | Enabled |
Enable Source Server Support | Requests that Visual Studio get source from the source server (srcsrv.dll). | Disabled |
Print Source Server Diagnostics Messages To The Output Window | Displays messages from the source server in the Output window. | Disabled |
Highlight Entire Source Line For Break Points And Current Statement | Highlights an entire line of source code to emphasize the current breakpoint or statement. | Disabled |
Require Source Files To Exactly Match The Original Version | Asks the Visual Studio debugger to verify that the current source file matches the version used to build the application. | Enabled |
Redirect All Output Window Text To The Immediate Window | Redirects debugger messages from the Output window to the Immediate window. | Disabled |
Show Raw Structure Of Objects In Variables Windows | Disables debugger display customizations, such as the DebuggerDisplay attribute. | Disabled |
Suppress JIT Optimizations On Module Load (Managed Only) | Disables JIT optimizations while debugging. These optimizations make debugging more difficult. | Enabled |
Warn If No Symbols On Launch (Native Only) | Displays a warning when debugging is initiated if no symbol information is available. | Enabled |
Warn If Script Debugging Is Disabled On Launch | Displays a dialog box when debugging is started if script debugging is disabled. | Enabled |
Edit And Continue supports changes to the source code while debugging. The changes are applied immediately without having to rebuild and restart the application. Edit And Continue is enabled automatically when breaking and then stepping through an application.
Some changes within a method are supported, such as deleting a line of code. Changes are more limited outside a method. For example, deleting class members is not allowed. The following changes are not supported in Edit And Continue:
Modifying an active statement
Surrounding an active statement with a foreach, using, or lock block
Surrounding the active statement in the current function with a catch or finally block
Adding a nested exception handler beyond six levels
Changing code in the try block that contains the active statement
Adding a new member
Adding a global symbol
Changing the signature of a member
Editing an anonymous method or a function containing an anonymous method
Changing, adding, or deleting an attribute
Changing or deleting a local variable
Modifying a method that contains a yield return or yield break statement
Changing, adding, or deleting a using directive
Modifying a constructor that contains a local variable that is initialized in an anonymous method (an outer variable)
Furthermore, Edit And Continue is not available in the following situations:
Mixed-mode debugging
SQL debugging
After an unhandled exception, unless the Unwind The Call Stack On Unhandled Exceptions general debugging option is enabled
After attaching to an application for debugging
In a 64-bit managed application
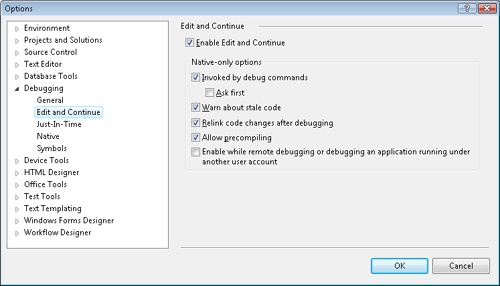
In the Edit And Continue settings in the Debugging category of the Options window, the Edit And Continue feature can be enabled or disabled. Figure 15-5 shows the Edit And Continue settings in the Debugging category of the Options window. The settings in the Native-Only Options frame pertain to native code.
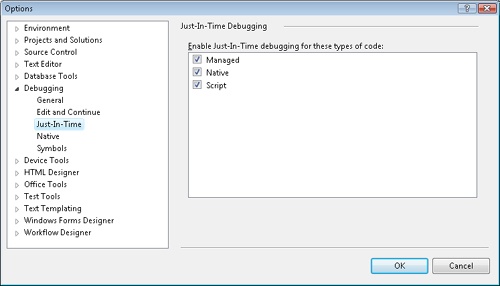
The JIT debugger is attached to a running application when the program crashes. Register Visual Studio as the JIT debugger in the Just-In-Time Debugging window (shown in Figure 15-6). Visual Studio can be the JIT debugger for managed code, native code, and scripting. JIT debugging is discussed in Chapter 16. When Visual Studio is installed on your machine, it registers itself as the JIT debugger for native and managed code.
The Native settings in the Debugging category of the Options window have two debugging options. Enable the Load DLL Exports option to load the export tables for DLLs. This is beneficial when the debug symbols are not available for the DLL. For example, you can set breakpoints on function names exported from the library even though symbols are not available. The Enable RPC Debugging option enables stepping into Component Object Model (COM) remote procedure calls. Both options are disabled by default.
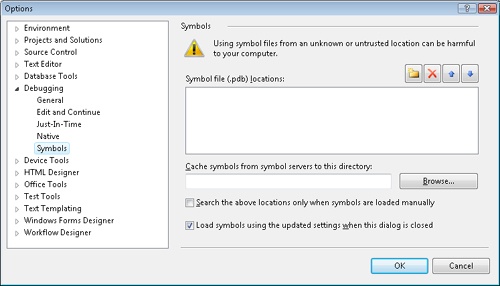
Visual Studio can be configured to use a symbol server to download the correct debugging symbols in a local symbol cache. Developers can use the Microsoft public symbol server or a custom symbol server. Identify symbol servers and downstream paths (caches) in the Symbols window, which is shown in Figure 15-7. In the Symbol File Locations list box, enter the Uniform Resource Locator (URL) for symbol servers. They are searched for in the textual order of the list. Enter downstream servers in the Cache Symbols From Symbol Servers To This Directory text box. Missing symbols are downloaded from symbol servers into downstream servers, where the symbol can be obtained in the future.
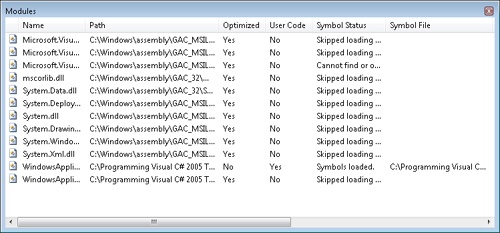
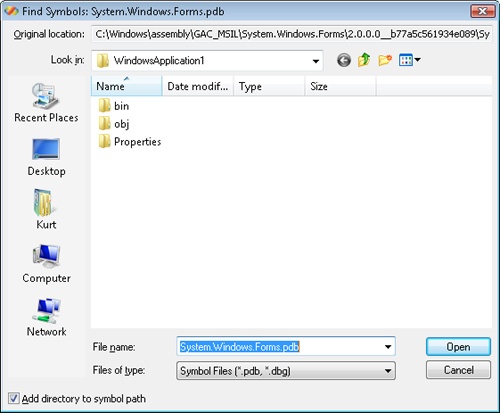
Symbols can be loaded manually in the Modules window, which is shown in Figure 15-8. Open the Modules window from the Debug menu and the Windows submenu. The Modules window lists the modules loaded in the current application. Each row represents a module and has the name of the module, path to the module, whether the module is optimized, source code availability, symbol status, and fully qualified path to the symbol file. The Symbol Status column indicates whether the symbols are loaded or skipped. Symbols are skipped automatically for optimized code. The Symbol File column displays the path to the loaded symbol file. For skipped symbols, you can load the symbols for a specific module manually by right-clicking the module and choosing the Load Symbols command from the context menu. After loading the symbols for a module, the Symbol Status and Symbol File columns are updated. If the symbol file cannot be found for the specified module, you are prompted with the Find Symbols dialog box, as shown in Figure 15-9. From there, you can browse to the relevant symbol file.
For more commands on symbols, right-click an item in the Modules window to display the context menu. From the context menu, the Symbol Load Information menu command displays information about the symbol file of the module. There is also a Symbol Settings menu command, which opens the Symbols settings in Debugging category of the Options window. You can configure symbols for the overall application in this window.
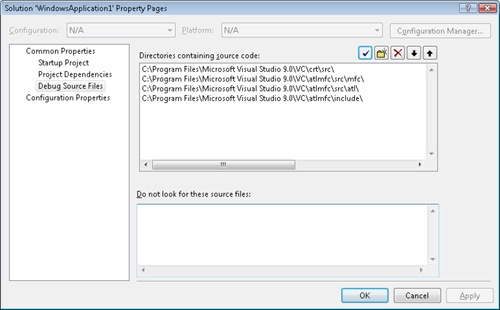
Debug settings for a solution are set in the Solution Property Pages window. The only available debug setting is the Debug Source Files setting. (The Debug Source Files settings of the Solution Property Pages window are shown in Figure 15-10.) In this window, you can set directories to include or exclude source files.
Debug settings for a project set the startup action, command-line arguments, and other debug options. Figure 15-11 shows the Debug tab of the <project> Properties window.
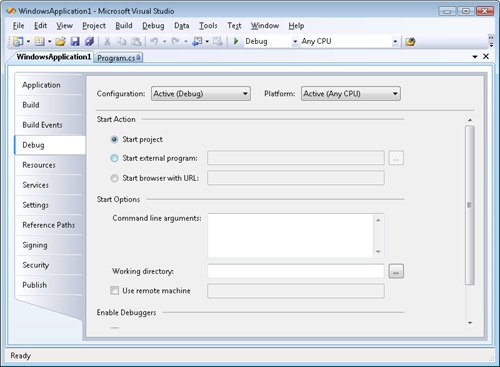
Settings in the Start Action frame indicate the startup action for debugging, which determines the application to launch when starting a debugging session. Here are the options:
The Start Project option, which is the default, starts the application from the startup project specified in the Application tab of the Options window.
The Start External Program option typically is selected when debugging class library projects. Specify the hosting application that loads the related DLL. You then can debug into the class library project.
The Start Browser With URL option is useful for debugging Web applications. Browse to a URL that is controlled by the Web application. The Web application then is loaded via the Web server. You then can debug the Web application in Visual Studio.
The Start Options frame contains the following miscellaneous settings:
Enter command-line arguments for the application in the Command Line Arguments text box.
The Working Directory text box sets the working directory of the application. This is the path for directory- and file-related tasks.
The Use Remote Machine option identifies a remote machine. The application is started at that location.
Settings in the Enable Debuggers frame indicate the kind of code that can be debugged, as follows:
The Enable Unmanaged Code Debugging option enables mixed-mode debugging. Developers can debug between managed and unmanaged code.
The Enable SQL Server Debugging option allows developers to debug CLR assemblies running within Microsoft SQL Server.
The Enable The Visual Studio Hosting Process option activates Visual Studio hosting, which is a .vshost.exe process.