Beyond Customer Led
Discontinuity and the Life Cycle
Customer as Value Manager
Customer Value Analysis
Scenarios
Gartner Magic Quadrant
Portfolio Analysis
Problems and Solutions
Dialectical SWOT Analysis: Strengths, Weaknesses, Opportunities, and Threats
Market Tipping
Corporate Strategy
Generic Strategy
E-Business Opportunity Matrix
Global Product Planning
Generic Network Strategy
Marketing and Communications Frameworks
Mass Customization: The Four Approaches
Attentionscape
Managing Customer Loyalty
Likelihood to Buy
Revenue and Profitability
BCG: Product Portfolio Analysis
Uncertainty-Impact Matrix
Entrance and Exit Strategies
Strategy is the art and science of competing more effectively than one's competitors. The visible strategic act of corporate leaders is making choices that advance the goals of the firm in the best possible way. The more intense the competitive landscape is, the tougher the choices become. Great strategy making is, of course, more complex, subtle, and multifaceted than this.
The key question the strategist seeks to answer is "How do we compete more effectively?" The archetypal strategic dilemma involves resolving the tension between Context and Value (Figure 6.1). Context is the who, why, where, and how of value creation; Value is the what. The job begins with defining the fields of inquiry in ways that naturally give rise to the right sorts of dialogue, learning, and, eventually, choices.
Note
The Archetypal Strategic Dilemma
Core Question: How do we compete more effectively?
Leaders establish constraints that frame future decisions. When Lewis and Clarke arrived at the fork in the Clearwater River on their long, arduous journey in 1805, the deliberation was framed as, "Which way should we go?" and not, "Should we go on?" Gandhi, in the early 1900s, chose the path of nonviolent protest, inspiring a nation and overpowering the endurance of the British Empire. First, he defined the strategic arena as how to achieve independence for India, and then he focused the issue as a choice of means: Would there be violence or not? Saul Alinsky, the ingenious 1960s guerrilla lawyer and advocate for social justice and change, laid strategic traps for uncooperative institutions. When disenfranchised residents in Harlem were refused credit from the local bank, he organized legions of supporters to tie the bank in nonproductive knots, lining up all day to deposit and then withdraw pennies at a time.[38] He defined the battlefield as an issue of access and then gave the bank problems much greater than that represented by fair access. He applied this social jujitsu time and again to champion the causes of his clients.
More often than not, effective definition of strategic issues and options is built on a dialectical foundation. Lewis and Clarke were torn between the leader's vision and the navigator's expert but incomplete advice. India, under Gandhi's guidance, pursued the tension between the right to self-determination and rule, and the maintenance of civility and progress. Alinsky played one interest (high-value clients, risk aversion) against another (community power expressed through system jamming and escalating embarrassment).
Viewed in this way, making tough strategic choices is really the final step in a more complex process. Gaining leverage lies in planning and controlling that process, arguably the most important thing a leader can do.
Modern business strategy practices can be traced to the work of Alfred Chandler and Igor Ansoff in the early 1960s.[39] Form follows function was the way Chandler framed strategy in his book Strategy and Structure. The how should derive from the what and why. Ansoff's seminal book, Corporate Strategy, focused on the strategic problem of a firm and presented a framework and language for strategic decision making. The now famous Product-Market matrix (see page 135) defined growth and diversification options in a way that planners could easily apply and communicate to others.
A generation of business leaders took the strategy credo to heart, and planning departments began to appear everywhere, creating detailed multiyear blueprints for their corporations. General Electric's strategic planning office employed over two hundred senior-level staff in 1983 when Jack Welch disbanded it. Mintzberg's empirically based study of executive behavior, reported on in 1983, described what was really going on, emphasizing the dynamic, reality-informed, and iterative nature of strategy.[40] A more apt metaphor for strategy, it seemed, was course correction, and zigzagging rather than perfect planning processes yielding long-term blueprints.
The term strategic thinking replaced strategic planning in the late 1970s to reflect this need to sense and adjust to external reality on an ongoing basis. The best strategy making is done in context, on the fly. Mintzberg's leaders built strategy on the move. They thought strategically, grabbing moments in the hall, on elevators, and in conversations. Reflection and action define an ongoing learning process that is periodically expressed as strategy.
Competition shifted to warp speed in the 1990s, driven by the Internet and globalization. New rules were being written daily, as all semblance of predictability and permanence seemed to disappear in a shrinking and real-time world. Direct and inexpensive access to competitive intelligence, coupled with the rise of new inter-enterprise business models, redefined competitive practices. Being strategic replaced the development of long-term strategy, and businesses found it more helpful to refer to strategic contexts within which rolling three- and six-month plans were implemented.
Strategy making is recognized now as a dialectical dance between competing goals and modes; form and function shape each other; the organization is the strategy. Agility, an aspect of form, is recognized as key to strategic effectiveness; market share and profitability compete for primacy, and growth and stability oscillate in self-correcting loops.
Strategy is inherently dialectical in nature, and so it is no surprise to find a wealth of important and useful strategic 2 × 2 frameworks. The frameworks in this chapter are organized into five categories:
Customer needs. Customers are the ultimate arbiter of any strategy. Businesses have devised elaborate surveys and focus group methods to help them get inside the customer's head and understand her experiences and motivations. The frameworks in this section address the challenge from an assortment of useful and creative angles.
Strategic context. Business success is as much a function of external factors as the actions undertaken by a firm itself. Strategic context includes such considerations as the nature of competition and the timing of an offering.
Strategic options. The essence of strategy lies in defining a value proposition and creating the competitive plan. This group of frameworks helps to generate a rich set of possibilities and sort them in an efficient and meaningful way.
Marketing and communications. Brand development and positioning are critical competitive factors, determined largely by how a firm presents itself and communicates its value. Businesses need to know how they are perceived in the marketplace and what they are seen to stand for.
Risk management. With competition and reward comes risk. Businesses must get clear about the value of the prize, the costs involved in trying to succeed, and the possibility of failure. This set of frameworks helps to make risk decisions more explicit and rational.

What is in the minds and hearts of our customers? How do they view us? How will their needs evolve? Who else might become customers?
The success and renewal of a firm's value proposition begins in the marketplace with customers. In the past decade, power has been migrating steadily away from firms to customers, riding on the wings of readily available knowledge. Proactive customers know what they want, and they seek out suppliers who will deliver to their satisfaction. Paying attention to customers' needs and experiences is common sense and good business. The cost of acquiring a new customer can easily be several hundred dollars. Retaining customers doesn't need to be an expensive undertaking, with the added bonus of learning more about how to do your business better.
The public does not know what is possible, but we do.
As much as anything, foresight comes from really wanting to make a difference in people's lives.
To Hamel and Prahalad, innovation and the ability to challenge one's own practices and assumptions are necessary core competencies for the successful 21st century corporation. Successive waves of organizational improvement tend to play within existing boundaries and do little to shape markets in helpful ways. Corporate restucturing and reengineering are two major sets of initiatives that lower costs and improve efficency but ignore core issues of value definition and renewal. Hamel and Prahalad's work represents a healthy and invigorating reaction to hierarchical strategic planning, encouraging everyone to be more proactive in recognizing opportunities, innovating, and making their own work more meaningful. Their message is delivered in award-winning Harvard Business Review articles like "Strategic Intent," books like Competing for the Future and Leading the Revolution, and the work of Strategos, the strategy consulting firm that Hamel heads.
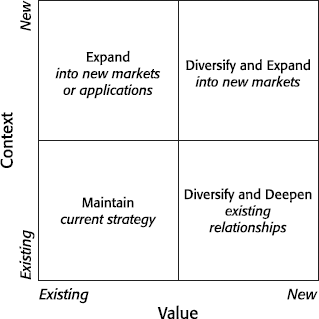
The Two Dimensions and Their Extremes. The Beyond Customer Led matrix (Figure 6.2) explores the two dimensions of Needs and Customers:
Needs. Businesses pride themselves on understanding their customers and their evolving needs. Most methods, however, provide insight into those needs that customers recognize and can express as a wish or a gap. The Needs dimension defines this condition as one end of a continuum, with unknown, unarticulated needs as the counterpoint.
Customers. Two classes of customer are important to a business: those it currently serves and those it does not.
The Four Quadrants. Companies can meet the known needs of existing customers, or they can venture further into new and promising areas of potential and future needs. The Beyond Customer Led matrix identifies four possible need groups:
Upper left: Unarticulated-Served. A satisfied customer today may become frustrated or uninterested if his unexpressed but felt needs are not addressed. This set of needs represents a rich opportunity for reinvention, value extension, and learning.
Lower left: Articulated-Served. This is the known world of customer needs. Although it is crucial to care for these signals, there is limited innovation potential here, and companies need to be careful not to lose sight of what is evolving in their efforts to be responsive.
Lower right: Articulated-Unserved. Offerings developed and perfected for existing customers can be extended to new customers in different markets. Like the upper left quadrant, this space describes a prime and natural strategic opportunity zone.
Upper right: Unarticulated-Unserved. Getting inside the heads and experiences of unaddressed customers is the last frontier of customer need identification. As remote as this may sound, it is exactly what proactive and visionary companies like Honda have done to fuel their remarkable expansion over the past two decades.
Example: The Chrysler Minivan. In the 1950s, U.S. automobile production accounted for two-thirds of the world total. By the 1970s, that number had been cut to 23 percent due directly to the growing strength of its offshore competitors in Japan and Europe. The oil crunch of the 1970s added to the problem, leaving thousands of gas-guzzling sedans sitting in Detroit plant parking lots while consumers flocked to buy fuel-efficient cars from overseas.
In the early 1980s, Hal Sperlich was working at Ford to develop what would become the now ubiquitous minivan. When he couldn't convince Ford this was a good idea, he left to join Chrysler. The rest is history.
The North American automobile companies were losing market share for a number of good reasons. Built for volume production, their assembly lines and factories were costly and inflexible. A disaffected workforce was more concerned with protecting labor gains than making their companies innovative and more competitive. Probably most worrisome, competitors' cars were outperforming theirs, using new lean manufacturing methods that were almost impossible to apply in older car plants.
The cost structure and underlying business model of the North American companies made innovation nearly impossible, yet this was precisely what was needed to revitalize the sector. When Sperlich launched his campaign within Ford, it ran afoul of both the strategic thrust and the company executives, eventually leading to his being fired. "[Ford] lacked confidence that a market existed, because the product didn't exist. The auto industry places great value on historical studies of market segments."[43]
Demographics painted a clear picture of the coming period. Relatively affluent and growing North American families needed larger interior car space. They just didn't know they did because nothing like the minivan yet existed. The minivan provided that extra bit of space that made trips to the cottage more comfortable, hockey equipment easier to cart around, and home repairs less painful (Figure 6.3).
The Beyond Customer Led matrix shows how unarticulated needs can be used to inform strategic vision and ultimately help redirect investments. "In 10 years of developing the minivan we never once got a letter from a housewife asking us to invent one. To the skeptics, that proved there wasn't a market out there."[44]
Sperlich's innovation and Chrysler chairman Lee Iaccoca's vision and courage were instrumental in pulling Chrysler out of a desperate decline. When the MPV model was launched in 1983, it sold more than half a million units, helping right Chrysler and overnight creating a new car category.
Context. Beyond Customer Led is ideal for strategic planning and product-service reinvigoration. This is a simple and powerful way to tap creative thinking within a firm and in dialogue with partners and customers. It is also a useful device for auditing future plans once they have been developed by asking questions from the perspective of each of the four needs groups—for example, Will these plans meet the known needs of existing customers?
Method. There is a highly intuitive feel to applying this framework as a tool. The process works best as a creative search exercise, responding to a set of questions which elicit content for each of the quadrants. Once this is done, patterns in needs and opportunities can be identified. This tool works well for individuals and teams:
Step 1: Make incremental improvements. Looking at the lower left quadrant, ask the following questions: How well are we responding to the articulated needs of our customers? Are there innovative ways we could improve on meeting their needs?
Step 2: Anticipate needs of existing customers. Looking at the upper left quadrant, ask the following questions: What do we know about our current customers that suggests additional needs we are not addressing? How will our customers' situations change over the next five to ten years? What needs will these changes create that we might respond to?
Step 3: Meet known needs of new customers. Looking at the lower right quadrant, ask the following questions: Which of our offerings have the greatest portability to new settings and customer segments? Which new markets are most attractive and well suited to our offerings?
Step 4: Explore needs of noncustomers. Looking at the upper right quadrant, ask the following questions: Which new markets are most appealing to us? What would be useful to know about them? How might we go about learning more about their needs? What needs exist beyond the obvious ones?
Step 5: Review. Having answered these questions, step back from the matrix and look for patterns of opportunity. What are the most unusual ideas? Which ones are the best fit with your firm's competencies?

Hamel, G. Leading the Revolution. Boston: Harvard Business School Press, 2000.
Hamel, G., and Prahalad, C. K. "Strategic Intent." Harvard Business Review, May 1989.
Hamel, G., and Prahalad, C. K. Competing for the Future. Boston: Harvard Business School Press, 1994.
You may think you're in the high-tech business—software, hardware, networking, services, biotech, whatever. In fact, you're in the discontinuous innovations business. Which means you're in the most risky business on earth.
Dramatic improvements in end-user capabilities, then, are the accelerator that drives technology adoption, just as paradigm shock is the brake.
The technology adoption life cycle, developed at Harvard University in the 1930s, originally described the pattern and rate of acceptance of new seed potatoes in the U.S. Midwest. Shaped like the typical bell curve, it elegantly mapped how a new technology grows from an experimental notion to a widely used commodity. As a technology matures and becomes less risky, different groups of customers, each with a distinct set of characteristics and needs, adopt it. The earliest adopters are technically oriented, with genuine interest in the product features. Later buyers tend to be pragmatic and conservative, and care most about business benefits resulting from the technology's use.
Geoffrey Moore expanded on the cycle in his 1991 book, Crossing the Chasm, describing what occurs when the technology is discontinuous and disruptive. In these cases, as was true for many of the Internet companies in Silicon Valley when Moore wrote his book, successful movement through the cycle involves bridging a set of gaps. Color TVs and laptop computers are continuous technological improvements, drawing on preexisting infrastructures and user skills. Wireless computing and electric cars are discontinuous and demand greater patience, investment, and learning while the technology becomes fully functional and supported by manufacturers, servicers, and standards. Not all new technologies successfully cross the chasm between the early experimenters and the more risk-averse majority buyers.
The book became a marketing bible for information technology companies during the supercharged 1990s, and Moore's Chasm Group was called on to guide hundreds of entrepreneurial ventures through the technology adoption life cycle. Discontinuous technology is by definition a risky business, and Moore's modeling offered structure, principles, and method to convert innovation into profitable business. Begin by understanding where your technology fits in the adoption cycle, focus on the right customers for the stage you are at, and deliver value that responds to current needs and interests. Strategy and communications change dramatically as a technology matures and one audience is replaced by the next.
The Discontinuity and Life Cycle framework (Figure 6.4) is the core tool employed by the Chasm Group for strategic diagnosis and market planning, integrating the cycle with market forces and customer types. Although this framework describes the world of discontinuous technologies, the method and lessons are relevant for most businesses involved in launching new products.
The Discontinuity and Life Cycle matrix is a highly integrated planning tool that communicates three sets of information: the technology adoption life cycle, the customer audiences being served, and the forces driving and restraining market adoption. At first glance, the picture may appear complex; however, each of the three sets of information is valid, relevant, and intuitively clear. The key to deciphering the map is to follow the life cycle, which moves in a clockwise direction starting in the upper left quadrant.
The Two Dimensions and Their Extremes. Two kinds of discontinuity shape the technology adoption life cycle: Paradigm Shock and Application Breakthrough. It is helpful to think of these forces as variations of Cost (Paradigm Shock) and Benefit (Application Breakthrough):

Paradigm Shock (Pain). Paradigm Shock measures the amount of adjustment required by end users and infrastructure providers to use the new technology. When this is too high, as it often is in early phases, people are more reluctant to invest. Electric cars are expensive and demand considerable investment and learning on the part of owners, mechanics, and gas stations in order to perform adequately. This pain dampens enthusiasm and the willingness to purchase, save for the most enthusiastic buyers.
Application Breakthrough (Gain). Application Breakthrough is the gain derived through use of the new technology. Potential users become motivated to sign on as the ability to benefit rises. Often there is a noticeable threshold that must be reached before a larger mass audience recognizes the merits of the new technology and pursues it. Faxes and cell phones are examples. In the case of electric cars, the benefits of ownership need to outweigh the costs for the technology to move to a state of mass adoption.
The Four Quadrants. The four quadrants in this model help to organize and align key elements of a marketing strategy:
Upper left: Prototypes. Life cycles begin here, built on ideas with potential rather than practical things. At this stage, pain and adjustment tend to be high, and tangible benefits are low. This is the world of pure science and prototypes, where users are tech-savvy enthusiasts.
Upper right: Early Market. A limited Early Market is led by one or several visionaries who recognize the potential of the new technology and support its development through funding and leadership. The first application breakthroughs are made in this phase, attracting the interest of more pragmatic customers. The challenge of this period is to demonstrate the potential value of the innovation in a convincing enough manner to recruit customers willing to experiment with it in their organizations. The Chasm, which lies between the Early Market and the Bowling Alley, can last for an extended length of time, effectively blocking mainstream adoption. Anticipating and planning for this time lag is critical.
Lower right: Bowling Alley. New technologies must be proven in smaller niche-like environments before broad uptake can occur. This is like targeting specific bowling pins, with momentum and impact increasing as successive pins are knocked over. To accomplish this, the supplier must gain a full understanding of the specific issues facing the target business and deliver a complete end-to-end solution. This is an incremental strategy phase, where success with one or two players in a segment leads to additional competitors' getting on board. If one or two industries can be won over, interest and credibility rise, and infrastructure requirements for mass adoption begin to be met.
Lower left: Main Street. Maturation of basic infrastructure and the emergence of standards fuels what Moore calls the Tornado. In Tornados, demand accelerates significantly as the product moves from niche to generic. Buyers tend to be technical as companies recognize the benefits and want to integrate the new technology as quickly as possible. The key to winning in Tornados is being part of the dominant solution or platform, staying focused on the core offering, and meeting the demand in a reasonable enough time frame.
Example: Winners and Losers in the PC Industry. The early years of computing were dominated by IBM, which at one point accounted for almost 80 percent of computer-related revenues worldwide. As the computing paradigm switched from mainframes to minis and PCs, a new generation of hardware, software, and services companies entered the scene, redefining the market. Out of this competitive chaos, two companies emerged as winners: Microsoft in software and Intel in the microchip market. In 1993, Intel took 50 percent of the total profit earned by the top 150 high-tech companies in Silicon Valley and by 2003 had a market value approaching that of IBM. Microsoft's market value is roughly twice that of IBM.
Organized first around the DOS operating standard and subsequently around the now ubiquitous Windows, the pair has dominated the computing world and benefited disproportionately from waves of innovation and the ever-growing number of users. How Microsoft and Intel achieved this success and continue to exercise such influence is made apparent by the discontinuity and life cycle analysis (see Figure 6.5).
Until the late 1970s, computing was principally the domain of specialists and hobbyists. Computers were expensive, large, and complicated. Interacting with them required learning elaborate programming languages. Prototypes of faster, smaller computers were being tested, but materials, design, and usage barriers kept all but the keenest enthusiasts away.

This all began to shift in the 1970s with the introduction of smaller minicomputers and desktop personal computers. The revolution was under way as visionaries at Bell Labs, Apple, and a few other places designed personal computers that were functional and held the promise of applicability to a wider audience. At the core of the new machines was a small, affordable microprocessor that enabled miniaturization and an operating system that was more intuitive and human-friendly.
To get through the first Chasm organized around the DOS operating system, the Wintel coalition contained a host of strategic partners, including Lotus for its spreadsheet software, MicroPro's Wordstar word processor, HP for printers, Conner for hard disk drives, and Novell for a network operating system. As these firms came together to deliver a complete working system, the Bowling Alley strategy quickly accumulated the energy needed to launch a Tornado that would lock in whole markets to the new systems and standards, with Microsoft and Intel at its center. The key to unleashing the Tornado was the flood of applications that independent software developers created to support the common platform. The move to Main Street occurred once technical and cost barriers had been removed and the infrastructure was solid.
The cycle was repeated again in 1991, but more quickly, when the Windows operating system was introduced. This time, fewer partners were included in the core coalition. Intel remained with its 486 and Pentium chips, as did HP, but Microsoft took the opportunity to integrate its own word processing package, Word, and spreadsheet application, Excel. One of the lessons of Tornado marketing is that markets want to deal with the fewest number of vendors organized around standard offerings. The outcome, as we know, is that the Microsoft Office suite of applications quickly became the desktop standard, much as Windows was the dominant operating system.
Margins compressed as these products matured and found their way onto Main Street, but market size increased exponentially. In successive mini-waves of innovation, additional partner functions have been integrated into the core set, like Novell's network operating system. However, by providing a standard, they have been able to preserve their role, adding improvements and cutting costs to stay ahead of the competition.
Context. The framework is applicable to strategy and marketing efforts of businesses where innovation and technology development are central to success. Each phase of the technology adoption life cycle has a unique set of requirements and opportunities, and it is dangerous and wasteful to be working from the wrong starting point.
Method. The object is to gain market acceptance in the quickest and most effective manner. While accuracy of analysis is important, the first critical task is to align the business leadership team around their assessment of the phase of development of the technology category to which the innovation belongs:
Step 1: Diagnose. Determine where the technology category lies on the technology adoption life cycle.
Step 2: Move out of the twilight zone. At any point, the market adoption process is at risk of losing steam and being marooned. New technologies cannot survive these for very long, and it becomes a priority to break loose. The two levers are reducing Paradigm Shock and increasing Application Breakthrough benefits.
Step 3: Move to the next stage. Strategies exist to advance successfully to the next stage. For example, Early Market entry requires finding visionaries and defining high-payoff development areas, while Bowling Alley entry depends on careful segmentation and understanding industry-specific challenges.
Moore, G. Crossing the Chasm: Marketing and Selling High-Tech Products to Mainstream Customers. New York: HarperBusiness, 1991.
Moore, G. Inside the Tornado: Marketing Strategies from Silicon Valley's Cutting Edge. New York: HarperCollins, 1995.
Wiefels, P. The Chasm Companion: A Fieldbook to Crossing the Chasm and Inside the Tornado. New York: HarperBusiness, 2002
It's a new imperative; businesses need to design their processes in ways that allow customers to drive value creation.
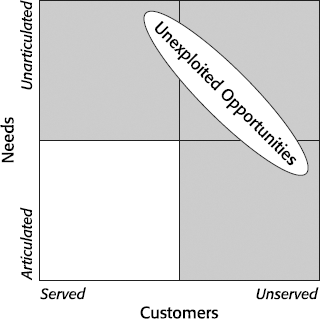
What does it mean to develop a customer-driven fulfillment network? The concept of the customer as value manager (CVM) comes from a multimillion-dollar research project into the future of supply chains conducted by Digital 4Sight in 2000. It explored how companies use information technology to support sales and let individual customers design those parts of the product or service experience that matter to them. There are great variations in the degree to which customers want to play an active role in processes related to product design, configuration, sales, delivery, and support. Some prefer to act through intermediaries; others want to buy on-line. Some care about product configuration; others are concerned with fast delivery. The model encourages companies to think in terms of enabling customers to access only those parts of the supply chain that add value for them (Figure 6.6). When we view customers as value managers, we present them with an individualized supply chain that perfectly fits their needs. Ideally, we isolate and emphasize supply chain capabilities to meet customer needs rather than the needs of mass production.
The Two Dimensions and Their Extremes. The CVM model differentiates customer groups by the degree to which they actively participate in offering design and by the way they access supply chain activities:[48]
Influence on Elements of Value. Influence refers to the degree to which customers want to have a voice in the design and customization of products and services.
Customer Access to Supply Chain. Customers interact directly (using information systems) with supply chain activities or through intermediaries. Consider the case of a company selling business furniture. Customers might prefer to purchase through an intermediary such as an architect, space planner, or retailer, or they might choose to buy directly from the company.
The Four Quadrants. The model segments buyers by their purchasing preferences rather than by demographic or economic characteristics:
Upper left: Guided Connoisseur. The Guided Connoisseur is a serious customer who is experienced in dealing with intermediaries—architects, space designers, retailers—and expects a high level of choice and customization. One way to reach the Guided Connoisseur is through on-line tools that can be shared by them and their chosen intermediary. This is commonly done in the building industry.
Lower left: Consumer. The Consumer segment is happy to buy standard products through existing channels. In our corporate furniture example, this might represent a corporate customer who lets a space planner make all furniture decisions.
Lower right: Efficiency Seeker. The Efficiency Seeker wants to control the buying experience and is prepared to accept a limited role in designing product specifications. This might be an executive in a fast-moving start-up who wants to be able to go on-line to manage his account and is more concerned with convenient financing, quick delivery, and service than in an expanded selection or product customization.
Upper right: Prosumer. The Prosumer is a sophisticated customer who wants both high customization and direct access. This buyer is comfortable dealing through the on-line channel and doesn't want the transaction overhead of retailers and agents.
Method. Follow these steps to conduct a Customer as Value Manager analysis:
Step 1: Assess the offering. Make a short list of the critical features of your product or service offering viewed from the customer's perspective. You may include elements such as style, price, delivery terms, selection, and financing.
Step 2: Assess customers. Make a list of your major customer groups and identify individual customers within these groups. This will help you think about where to place them on the matrix.
Step 3: Diagnose. Place customers into the four quadrants based on the extent to which they need to influence and manage value. Refer to the list of features identified in step 1 to evaluate customer preferences.
Step 4: Design. Define strategies to provide customers with their preferred form of access.
Tapscott, D., Ticoll, D., and Lowy, A. Digital Capital: Harnessing the Power of Business Webs. Boston: Harvard Business School Press, 2000.
Winning customers by providing superior quality attracts customers who are inherently more loyal.... By contrast, customers who instinctively buy on price, or are trained to buy on promotions, tend to wander from supplier to supplier looking for the one who is most desperate.
Are your customers satisfied with your current offerings? Do you know why they are satisfied? Is it because of your price or your value? And even if they report that they are deeply satisfied, under what conditions would they switch to a competitor's product or service?
These are questions that marketers find difficult to answer. Customer satisfaction surveys are helpful, but only fill in part of the picture. Customer Value Analysis (CVA) is a powerful tool that reveals how specific product attributes contribute to customer perception of value and the buying decision. It enables one to focus on the aspects of product or service that are most likely to increase customer acquisition, retention, and profitability.
The branch of economics that is concerned with how consumers make decisions is called utility theory and has its roots in the work of economist Jeremy Bentham in the late eighteenth century. Modern Customer Value Analysis is the result of work done by Bradley Gale and others at AT&T in the 1980s. A generally satisfied customer, they found, does not necessarily produce repeat business or improved financial results. The CVA principles and method described in Gale's 1994 book, Managing Customer Value, were created to get at the critical drivers and interdependencies influencing customer buying decisions (see Figure 6.7).
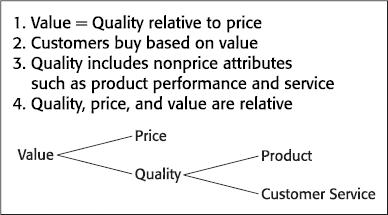
Customer Value Analysis is built on the proposition that customers choose among suppliers based on perceived value. Value (Figure 6.8) is a combination of price and quality. Lowering the price or raising the quality of a product will improve its overall perceived value relative to competitors' products (provided, of course, that such information is communicated convincingly to potential customers).
Customer Value Analysis is a two-step process. First, measure how customers perceive the quality and price of your products versus those of your competitors. Then plot these data on a Customer Value Map. Firms that are perceived to be lower in price and higher in quality than competitors are poised for market share gains. Conversely, a low score in either or both of these measures is cause for concern. The fair value line indicates where quality and price are in balance. Gale uses the terms "Customer-Perceived Price" and "Customer-Perceived Quality" (or "Market-Perceived Quality") to reflect that the profiles are determined principally by gauging customer perceptions.
The Two Dimensions and Their Extremes. The Customer Value Map explores two key dimensions: Customer-Perceived Price and Customer-Perceived Quality:
Customer-Perceived (Relative) Price. Customer-Perceived Price reflects all relevant components of price. For homes, this might include financing costs, maintenance, local real estate taxes, and expected appreciation, as well as the initial purchase price. If you were shopping for steaks, purchase cost would be the only relevant price.
Customer-Perceived Quality. Perceived Quality includes all product attributes other than price. Different attributes are relevant in each product category. Home buyers might consider location, materials, style, size, landscaping, and other factors. In the steak example, quality perceptions might focus on such attributes as color, marbling, freshness, brand, government inspection, and convenience of purchase.

The Four Quadrants. Each quadrant (Figure 6.9) corresponds to a general relative value and suggests a particular action. The fair value line sits at a different angle for different product categories. For example, in luxury goods, a small quality improvement may justify a large price differential. However, for commodities, consumers may be indifferent to quality differentiation, suggesting a more horizontal fair value line:
Upper left: Worse Customer Value. Customer preferences shift in economic downturns, and higher-priced products often find themselves in this position. The recession of 2000–2003 contributed to the demise of the Concorde as wealthy travelers decided to cut back on its pricey transatlantic flights in favor of cheaper air travel.
Lower left: Commodity Value. Goods in this quadrant are commodities with little differentiation between vendors. As a result, the products tend to sell on price. Many raw materials and agricultural products are sold as graded commodities. The price a seller of copper receives is typically the same as the price every other seller receives.
Lower right: Better Customer Value. Products in this category are perceived as value leaders; costs are competitive, and the products possess the quality attributes that customers value most highly.
Upper right: Unique Value. This quadrant is populated by upscale goods and services that offer Unique Value. Examples include high-margin products such as custom jewelry and entertainment experiences for which close substitutes are not available.

An area chart of customer value, sometimes called a defection-acquisition index (Figure 6.10), is used to gain insight at a more granular level into factors influencing customer decision making. Each horizontal bar represents an attribute or feature, such as style, service, or image. Ratings to the left of the bar indicate that a company is perceived as performing worse than its competition, making it vulnerable to customer defection. Ratings to the right indicate it is perceived as better than the competition, suggesting opportunities for customer acquisition.
In addition to targeting product and service investments into areas that will have the greatest impact on ability to win and retain business, the area chart also is useful in identifying areas of potential investment or cost savings. For example, if it is expensive to improve feature 1 but relatively easy to improve feature 3, the firm could gain the most customers for the least dollars by focusing its investments on feature 3. This type of modeling is also sometimes referred to as performance impact analysis.
Example: Denim Jeans. Let's use a hypothetical example based on recent events. In the denim jeans market of recent years, Levi's has consistently lost market share, falling from $7 billion of revenue in 1996 to $4.2 billion in 2001. It lost business on the high end to more stylish and innovative competitors such as Calvin Klein and fashionable upstarts such as Diesel. Conversely, it lost low-end business to companies such as Arizona Brands. For much of this period, Levi's was heavily dependent on U.S.-based manufacturing and couldn't compete on price with offshore competitors. In such a situation, one can well imagine that existing Levi's customers might respond positively on a traditional customer satisfaction survey, but still purchase a different brand. A customer value analysis can provide insight into the situation.

The key components of quality in a pair of jeans might include materials, cut or styling, availability, peer group approval, and advertising. The hypothetical CVA analysis in Figure 6.11 shows that although Levi's is lower priced than many competitors, it is still on the wrong side of the fair value line. Merely cutting the price is unlikely to right the fair value equation. Instead, Levi's needs to change the product or the perception of the product, or some combination of the two. Deeper analysis of customer value on a feature-by-feature basis may reveal that Levi's invests too much on some attributes of the product and not enough in others.
Method. An in-depth CVA implementation requires marketing research skills and familiarity with statistical analysis techniques described in Gale's book. Many consulting companies specialize in Customer Value Analysis as a specific offering. For a general introduction to the method, we suggest trying the following exercise. If customers are not easily available for surveying, have your sales teams rate the products and those of the competition.

Step 1: Define. Develop a list of competitors and products to which you wish to be compared.
Step 2: Research. Develop quick market-perceived price and quality profiles by asking customers what attributes they consider in making a purchase. Then ask customers to weight the attributes by distributing 100 points among them. Create the price and quality ratios (the method is described immediately after step 3).
Step 3: Summarize the implications. Using the market-perceived quality ratios, identify and discuss the defection and acquisition implications of your analysis.
Creating a Quality Profile. There are three steps to creating a quality profile:
Determine the attributes of product quality that influence purchases.
Survey customers to determine how your offering is perceived relative to that of your competitors.
Weight the scores to derive a quality ratio.
The simplest way to determine the components or attributes of quality is to ask a group of survey subjects what they believe they are. Then ask them how you and your competitors rate on each attribute of quality. (It may also be useful with some products to gather information from secondary sources such as research firms to objectively define product performance. For example, if you were comparing motorcycles, you might factor in objective data about performance and handling or warranties.) Next, ask them to weight each quality attribute by dividing 100 points among all of the attributes based on their relative importance in the overall purchasing decision. A market-perceived quality ratio is then created by multiplying each competing product's score by the weight of the factor.
Table 6.1 contains a sample quality profile. Company A surveys handbag buyers to find out which features are most important to their purchasing decisions. It discovers that there are three key features: materials, style, and brand image. Company A also finds that although purchasers rate it above competitors in terms of materials and brand image, they rate it at the same level with competitors on style. This is important because style is the product attribute that customers rate as most influential to their buying decisions. The overall weighted ratio is 115.375 (a score of 100 indicates relative parity with competitors), indicating the company is well positioned versus competitors in terms of perceived quality.
Creating a Price Profile. Perceptions about the costs of purchasing and owning a product can be as important as actual price in influencing purchases. This is especially true in the case of expensive products such as cars, where the anticipated costs of maintenance, financing, and the gain or loss through resale value figure prominently. To capture this information, price profiles are calculated based on customers' perceptions of the cost of components that constitute the total price of a particular good (Table 6.2). Weighting these components produces a market-perceived price ratio, similar to the quality ratio.
Table 6.1. Customer-Perceived Quality Profile
Market-Perceived Quality Ratios | |||||
|---|---|---|---|---|---|
Quality Attributes | Importance Weighting | Company A | Competitors | Ratio Company A/Competitors | Weight Times Ratio |
Materials | 25 | 8 | 6 | 1.33 | 33.25 |
Style | 50 | 9 | 9 | 1 | 50 |
Brand image | 25 | 9 | 7 | 1.285 | 32.125 |
115.375 | |||||
Once price and quality ratios are completed, the outcomes are plotted on a Customer Value Map that compares perceived quality and price points for a company and its competitors. Points on the map correspond to each company's relative performance in terms of overall quality and overall price. At any point on the fair value line, a company should neither lose nor gain market share.
What external trends and factors need to be considered? How will they affect choice of strategy? What impact will they have on implementation?
Strategy is relative. Like moves on a chessboard, the wisdom of a decision depends entirely on the placement of the other pieces as well as what is in the minds of the other players. Understanding the external context is always important, but it is most useful in two critical phases of strategy development: as input before a strategy is formulated and as consideration during implementation.
There are many different approaches to context analysis. One can focus on the future, the market structure, competitors, trends, and other features of the competitive landscape. Often firms contract this task out to a consulting or research partner to ensure they receive an unbiased view. However, you can also learn a great deal simply by sampling different strategic context models. Each of the frameworks in this section offers a different way to profile the competitive landscape and is worthy of consideration. After reading a framework summary, invest five minutes to see what it tells you about your strategic needs.
Scenarios are not about predicting the future, rather they are about perceiving futures in the present.
The future is unknowable and therefore risky.[51] Traditional planning methods work well enough when the time frame is the next quarter or perhaps one to two years into the future. But beyond that, projections based on current reality are dangerously unreliable. Reality rarely unfolds in a linear fashion, and unpredictable events—wars, revolutions, scientific breakthroughs, stock market booms, natural disasters, and others—spoil the best-laid plans.
Scenario planning aims to reduce longer-term risk by creating imagined futures based on an appreciation of key forces driving social, economic, political, and technological change. Companies, governments, and other large institutions create scenarios to make judgments about the future viability of current strategies and to explore areas of long-range concern that would never show up in a typical planning exercise. Many of the most useful scenario planning efforts adapt readily to the 2 × 2 form. We'll examine two of them in this section.
Scenario planning emerged as a serious business method at Shell in 1960s and 1970s where Pierre Wack led a group that developed scenario methods and anticipated the oil price shocks of 1973. Later, Wack, working closely with Willis Harman, Peter Schwartz, and other scenario developers at the Stanford Research Institute, refined the methods. Schwartz himself took over scenario planning at Shell, where he had the opportunity to improve the technique further, anticipating issues such as the fall of the Eastern bloc countries. In 1987, he and a group of visionary thinkers and writers, including Jay Ogilvy, Stewart Brand, Lawrence Wilkinson, and Napier Collins, formed the Global Business Network, a firm specializing in scenarios. Today, the technique is widely used in government, academia, and corporate planning exercises.
The goal of scenario planning is not to create the one right scenario. Rather, it is to create a set of viable options—robust scenarios that may hew closely to the future as it unfolds. Parts of each of the scenarios are likely to become manifest over time. To be useful, modeling needs to push limits so aspects of the scenarios are radical enough to encompass wild card events.
Choosing axes is the most critical step in scenario matrix development. Each axis must represent a dynamic force that is likely to be a defining feature of any future reality. Well-chosen axes create four plausible futures that help assess the risks of particular positions and strategies. Defining the axes frequently begins with asking questions that could have a great impact on the institution's future, such as, "What happens if economic growth slows down or increases greatly?" "Will social attitudes become more liberal or more conservative?" "Will raw material prices be stable or fluctuate greatly?"
We look at two examples here that illustrate the range and impact of the method: one on the future of automobiles and the other on libraries.
Example 1: The Future of Automobiles
This example was developed by the Global Business Network in the 1980s while working with an automotive company. The work influenced Detroit's thinking about the increasing appeal of sports utility vehicles (SUVs) and spurred development of other multifunction vehicles.
The Two Dimensions and Their Extremes. This matrix (Figure 6.12) explores two key dimensions: Fuel Prices and Societal Values:
Fuel Prices. Fuel Prices are a key driver of economic activity in almost all industries, particularly transportation. They range from low to high.
Societal Values. Societal Values provide a complex and nuanced measure of social conditions that might drive car-buying patterns. Traditional Values describe a conservative society in which religious, social, and personal values are relatively stable. In this vision, nuclear families would become stronger, gender roles would be well defined, and traditional practices in all fields would remain dominant. Inner-Directed Values describe a society that places greater emphasis on self-fulfillment and less fidelity to social norms. In this vision, people would be more likely to tackle anything new, from exotic religious practices and extreme sports to experimental social practices and nontraditional brands. Values, combined with fuel prices, spawned four plausible yet vastly different scenarios.
The Four Quadrants. Values, combined with Fuel Prices, spawned four plausible yet vastly different scenarios:
Upper left: Engineer's Challenge. Under this scenario, North America falls prey to the kinds of continuing high fuel prices that were first experienced during oil embargos in the 1970s (returning again in 2003). The challenge for auto companies becomes how to build innovative, fuel-efficient cars while appealing to a customer base whose taste and values reflect an earlier period when car design was driven by style and power, not efficiency.
Lower left: Long Live Detroit. In this scenario, the domestic car industry in North America would benefit from the combination of permanently low gas prices and a customer base that stuck close to traditional brands. Firms would build the types of cars (gas-guzzling muscle cars) that were popular in the 1960s. While muscle cars continue to come and go, this clearly was not the dominant scenario.
Lower right: Foreign Competition. A lack of traditional brand loyalty, combined with low fuel prices, would enable Japanese and German firms to capture an ever-increasing share of the U.S. market. Sportier cars, light trucks, and vans would proliferate as tastes splintered and markets fragmented.
Upper right: Green Highways. This is the eco-dream quadrant. High fuel prices make the return of inefficient automobiles unlikely. Inner-directed values drive customers to focus on the more sober aspects of car ownership, such as pollution control, fuel efficiency, and the effect of automobiles on the environment. As a result, automakers vie with one another to produce more eco-friendly vehicles.

At the time this set of scenarios was being developed, the two upper quadrants seemed quite likely. The world had become accustomed to higher oil prices in the 1970s, and there was little expectation that we would have sustained energy deflation throughout the 1990s, but that is what happened. Gas prices in real terms were far lower in the 1990s than in the two previous decades. At the same time, people in North America moved right on the horizontal axis, becoming more inner directed overall. The lower right quadrant turned out to model the automotive future more accurately than the other three. By the end of the century, light trucks, vans, and SUVs dominated car sales, and foreign firms had racked up impressive gains in market share.
Example 2: Librarian Scenario
The basic structure of the Librarian Scenario matrix was developed by Lawrence Wilkinson of the Global Business Network.[52] It was adapted by Tom Wilson of the University of Sheffield to explore the future of library services and its impact on the job prospects of librarians.[53]
The Two Dimensions and Their Extremes. The matrix explores two key dimensions: Social Contract and Locus of Concern (Figure 6.13):
Social Contract. The degree to which society is likely to share common values (Coherence) or to fragment into conflict among interest groups (Fragmentation) defines the extremes of the Social Contract. In fragmented societies, central authorities exercise control over the behavior of individuals. In Coherence scenarios, shared values makes such control unnecessary.
Locus of Concern. The Locus of Concern represents the long-standing struggle between the Individual and Community. It asks, "Will the key locus of concern for citizens be the well-being of the community or themselves?"
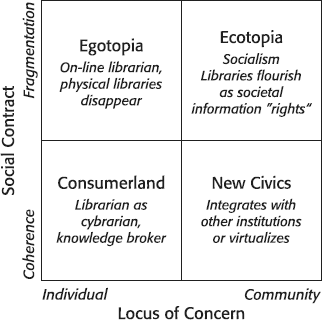
The Four Quadrants. The four quadrants illustrate the possibilities:
Upper left: Egotopia. In Egotopia, Community is disintegrating. Individuals are connected by the Internet and do much of their work there. Since Individuals have less stake in the community, social infrastructures decline. Under such a scenario, physical libraries are likely to disappear, replaced by on-line librarians who provide open market services electronically.
Lower left: Consumerland. A strong social contract supports the need for shared physical and on-line public libraries. But the librarian focuses on serving individuals, not groups. In this vision, the librarian is a "cybrarian," brokering knowledge to the members of society.
Lower right: New Civics. The New Civics envisions a strong Social Contract combined with strong Communities. In this future, the library remains an important community component that might integrate with other institutions in order to perform its mission better.
Upper right: Ecotopia. In Ecotopia, libraries are a right, not a luxury. This is envisioned as a more socially responsible future in which communitarian values prevail. Although social cohesion is low, support for institutions of business and government remains high. Corporations focus more on meeting social goals, and citizens exercise power to clean the environment and fund needed services.
Under all four scenarios, physical libraries were considered likely to decline and on-line services would grow. Also, there would be a demand for librarian services under all four scenarios. In some, such as New Civics and Ecotopia, this appears to be greater due to the commitment to maintaining physical libraries, but overall, the scenarios demonstrated a continuing demand for fee-based and public library services.
Method. Scenario planning can be an intensive process, involving many people and lasting several months. In his book The Long View, Peter Schwartz provides an overview of the scenario planning process that is adapted here:[54]
Step 1: Focus. Identify the focal issue of your decision. Scenario development works better by looking inside out, examining the kinds of major decisions you'll be grappling with this year and in the future. Identify some key decisions that have to be made and will have big repercussions on the firm, such as, "Should we build the new facility?" or "Is it wise for us to enter the European market?"
Step 2: Examine key environmental forces. What are the local factors—such as information about suppliers, customers, and competitors—that influence the success or failure of decisions chosen in step 1? What will be the key determinant of success for the decision in step 1?
Step 3: Identify driving forces. Examine the economic, social, political, demographic, and technical driving forces that are external to the firm. These range from high certainty (demographics) to low certainty (political upheavals) forces. Typically, additional research is required to support your conclusions at this step.
Step 4: Prioritize issues. Take your macro (step 3) and micro (step 2) lists, and rank them by importance and uncertainty. If working in groups, suggest giving each person three votes, and use the votes to establish priorities.
Step 5: Build the scenario logic. The ranked factors provide the raw material for creating the axes of your 2 × 2 matrix. Work as a team on the meaning of the two axes, and pay special attention to factors that may be combined or integrated. Language is critical at this stage. Global Business network consultant Nicole Boyer says, "The planning team must own the language describing the axes and each quadrant. The story has to feel right for it to make an impact on an organization."
Step 6: Flesh out the scenarios. Describe in some detail (one to four pages) what the world would look like if any of the four scenarios came to pass. What would be the impact on the use of your product or services, commodity prices, shopping habits, government policies, or other areas of life that would affect your business? Look again at the key drivers in steps 1 and 2, and visualize how they might play out under each scenario.
Step 7: Consider strategic implications. Scenarios enable you to test strategies for risk. Boyer asks, "Are your strategies robust in all four quadrants? Do you die? Do you thrive? You may have strategies that are moderately risky in all scenarios, or you may have a big bet that is very risky in most of the scenarios. If all the scenarios are equally likely, would you bet your company on only one of them?"
Step 8: Create measures and signposts. Once a solid set of scenarios is developed, ask, "What are the key measures that tell us if the future is unfolding according to one of the scenarios?" Look for simple indicators that might provide useful information. For example, if one of your scenarios is increasing community fragmentation, how would you measure that? Household formation? Parent-Teacher Association attendance? Divorce rates? These indicators provide an early warning system for future strategic choices.
Ringland, G. Scenarios in Business. New York: Wiley, 2002.
Schwartz, P. The Art of the Long View. New York: Doubleday, 1992.
van der Heijden, K., and others. The Sixth Sense: Accelerating Organizational Learning with Scenarios. New York: Wiley, 2002.
Wilkinson, L. "The Future of the Future." Wired (special edition), 1995, pp. 77–81.
[http://www.wired.com/wired/scenarios/build.html].
Wilson, T. "The Role of the Librarian in the Twenty-First Century." Keynote address for the Library Association Northern Branch Conference, Longhirst, Northumberland,
Nov. 17, 1995. [http://www.shef.ac.uk/~is/wilson/publications/21stcent.html].
Leadership is the capacity to translate vision into reality.
Major information technology buying decisions are among the most expensive and fateful that executives make. They must choose suppliers that understand their business, stand behind the product, and can provide needed services. The investments are typically long term, so they must choose a vendor that will be around in the future—one with the vision and foresight to survive in the cutthroat technology marketplace.
Gartner Inc., founded in 1979 in Stamford, Connecticut, is the leading research firm providing insight and advice to corporations on technology markets and products. Gartner associates serve as independent counsel on strategic business issues and often are called before the U.S. Congress to discuss the technology issues driving the economy.
The Gartner Magic Quadrant (Figure 6.14) describes the relative positioning and future prospects of firms in technology hardware, software, and services. Producers take Gartner's ratings seriously and devote significant marketing resources to building the case that they are material for the upper right—the Leaders quadrant.
The Two Dimensions and Their Extremes. The Magic Quadrant measures firms' offerings by contrasting two business values: Ability to Execute and Completeness of Vision. Long-term success in information technology requires both. Completeness of Vision is most important when a product category is new and customer needs are evolving rapidly. Ability to Execute becomes more important over the longer term as companies require support and customized solutions to meet specific needs.
Ability to Execute. Ability to Execute reflects the discipline and resources—human, financial, intellectual—needed to get the job done. In addition to core competencies, firms rated high on Execution display financial strength and the right strategic alliances along the value chain.
Completeness of Vision. Completeness of Vision focuses on creativity and inventiveness. It measures a firm's ability to lead and influence the direction of technology development and implementation practices in their market.
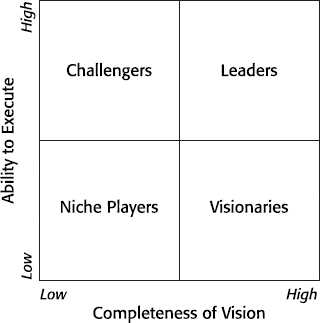
The Four Quadrants. Combinations of the two dimensions define four possible competitive positions:
Upper left: Challengers. These companies execute well and often dominate large segments of the market. However, they are not fully in step with emerging market directions or capable of setting the industry agenda.
Lower left: Niche Players. These are often smaller competitors with credible technology or firms focused on smaller market segments. Firms in this quadrant are judged not to excel at either innovation or performance.
Lower right: Visionaries. Visionaries understand where the market is going but do not have all the capabilities necessary to execute the vision. Companies in this quadrant are notable for their breakthrough ideas but are challenged to develop the broad competencies needed to support and sustain customers.
Upper right: Leaders. Leaders execute well today and are positioned for the future. These are companies with excellent customer service, dynamic solutions, and strong value delivery. Gartner recognizes firms that can adhere to a well-articulated strategic plan, align their vision with industry trends, and are flexible in reacting to market forces.
Example: Supply Chain Software. The matrix is a regular feature of the Gartner Group's research reports on software and hardware technology. Each Magic report includes market analysis, vendor inclusion criteria, and comments from Gartner's army of analysts. Page 124 contains two examples of what a completed matrix looks like. (While names have been deleted, each dot represents a real company evaluation.) The quadrant in Figure 6.15 compares supply chain management (SCM) software vendors. SCM software is typically bought in a suite that may include applications for demand planning, manufacturing planning and scheduling, distribution transportation planning, and other processes. A firm needs to meet stiff criteria, including a global presence and broad product offering, to be considered for inclusion in the Magic Quadrant. As a result, new entrants are often excluded. In this example, only two firms are ranked above the midpoint on the Ability to Execute dimension. Since Gartner maps are issued frequently, each one is a current snapshot, and it is not uncommon for companies to change their position on the map over time.
In new markets, few products or firms meet all the criteria for leadership. The Portal Software example (Figure 6.16) is a map of the emerging company portal software industry in 2000. At that time, the market was still quite small, and few products or companies had proved they could adequately meet customer needs or implement and service their products. Gartner rightly identified that no companies ranked high on Ability to Execute.


Context. The Gartner Magic Quadrant offers a relatively simple and powerful way to model industry competitors. It is well suited to corporate strategic planning exercises in any field where technology changes increase the risks of vendor selection.
Method. Follow these steps to conduct a Magic Quadrant analysis:
Step 1: Define the problem. In a sentence, articulate the business issue you intend to confront.
Step 2: Create a matrix. Focus the dimensions of the axes with a list of key issues relating to the specific problem at hand. For Completeness of Vision, consider the number of new products, research and development, technology, and standards. For Ability to Execute, consider financial viability, track record, management quality, investor relations, impact of government legislation, and production systems. Then define your own list of additional key issues for each axis.
Step 3: Assess. Place all relevant industry players on the matrix according to your first instinct. Then with an associate, debate and review each company until you are satisfied that the placement is fair and accurate. The more people who validate the matrix, the more reliable it will be for decision making.
Step 4: Follow up. Update the matrix following major announcements by players and new entrants. Over time, you will gain a better understanding of industry trends and organizational strategies.
Unfortunately, not all business is good business.
Not all customer accounts are worth pursuing or maintaining. Companies understandably have a difficult time rejecting business, but this is sometimes precisely what they should do. This applies to existing accounts as well as those in the sales pipeline. The Portfolio Analysis matrix provides a useful structure and set of criteria for assessing the relative value of customers (Figure 6.17).
The Two Dimensions and Their Extremes. The Portfolio Analysis matrix explores two key dimensions: Business Quality and Mutual Value:
Business Quality. Business Quality is considered Excellent if the relationship is profitable and growing and the client is satisfied. It is Poor if engagements are unprofitable, missing milestones, draining resources, or the client is dissatisfied.
Mutual Value. Mutual Value is a measure of the interdependence between service provider and client. Mutual Value is Symbiotic when the client and service provider are able to produce new, positive results that they could not have achieved separately. For example, Motorola recently outsourced its human resource department to Affiliated Computer Services (ACS). Gaining critical mass and a marquee client enabled ACS to bring its business process outsourcing (BPO) offering to market faster and to add functionality, increasing its competitiveness. Motorola gained access to best-in-class human resource and process management practices from ACS and was able to remain focused on its core competencies. It also retained a royalty on other BPO engagements that ACS sells. Beneficial Mutual Value to the service provider could also mean expanding into new vertical industries, establishing recurring revenue streams and creating an offering that can be replicated. Mutual Value is considered to be Nonexistent when service is rendered primarily as a low-cost alternative.

The Four Quadrants. Careful consideration of Business Quality and Mutual Value produces four strategic options:
Upper left: Maintain. Work of this nature is worth doing for the money but contributes little to long-term strategic development. Cash cows tend to be in this quadrant. Some of these businesses will eventually need to be cannibalized; however, in the interim, they help fund new growth initiatives.
Lower left: Exit. This type of client relationship is unsupportable and should be renegotiated or stopped as soon as legally and morally possible.
Lower right: Adjust or Limit. These assignments are strategically well aligned, but they are not profitable and may not be generating additional work. An example is the development of emerging technologies where investment is required to be competitive. These engagements need to be closely monitored. Some activities in this category can be promoted and developed into prime work, while others will need to be cut.
Upper right: Grow. This is the best quadrant for business to fall into. It is profitable, growing, and strategically well matched, representing a virtuous cycle of learning, growth, and profitability. Ideally, relationships started in the other boxes can be directed here.
Method. Use the Portfolio Analysis matrix to evaluate and optimize client relationships:
Step 1: Diagnose. Assess all current and prospective customers, applying the two dimensions of the Portfolio Analysis matrix. Place each customer in the appropriate quadrant of the matrix. Use large and small circles to denote the size of client engagements. Color coding the circles or markers can also be used to quickly identify specific types of engagements.
Step 2: Plan. Create plans for each customer. Some merit additional effort and attention, while other relationships may need to be terminated.
Step 3: Execute. Apply plans and monitor for changes in status.
Wait for the future to happen, and you will have no future.
Watts Wacker is perfectly at home in the future. As a former futurist at SRI and now with his own firm, First Matter, he advises top corporations on how to nurture long-range planning capabilities. In The Visionary Handbook, he coaches firms to set up an internal futures council to continually assess issues related to their future development. The council creates a future vision for the company and monitors evolving sets of problems and solutions that may have significant impact on the company in the future.
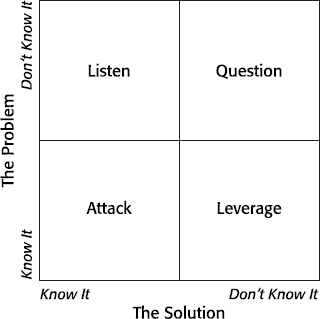
The Problems and Solutions matrix (Figure 6.18) asks, "How do we apply company resources to the problems and solutions in our future vision?"
The Two Dimensions and Their Extremes. The Problem and Solution matrix explores two key dimensions: Problems and Solutions:
The Problem. Problems range from today's known problems to emerging issues that a future vision reveals. For example, demographic changes can signal future problems that will require attention.
The Solution. Solutions may be known and obvious today or unknown and yet to be discovered. New technologies (such as wireless) or new paradigms (such as mass customization) frequently start out as solutions to unknown problems.
The Four Quadrants. Different action is needed depending on whether Problems and Solutions are known. The four basic options are described as follows:
Upper left: Listen. If the futures council is paying attention, it will identify ideas that solve problems that are not yet evident. These solutions challenge the firm to make sense of weak signals from the marketplace and recognize possible future trends. Seek input from thought leaders and mentors whose perceptive contributions can help you re-vision the present and future.
Lower left: Attack. Sometimes the situation is clear and compelling. You know what's wrong and what you need to do, so take action.
Lower right: Leverage. The problem is known, but you don't have a solution. In this case, leveraging the knowledge and efforts of partners and friends is suggested to lead more quickly to a solution.
Upper right: Question. Wacker calls this the fool's box, referring to medieval fools or jesters. Organizations must actively nurture renegades who question and present bold ideas if they are to get beyond the limits of today's problems and solutions. In this manner, one remains open to transcendent solutions to tomorrow's challenges.
Method. The method has three steps:
Step 1: Form. Establish a futures council within the firm composed of people at different levels.
Step 2: Assign. Charge the futures council with creating a vision of the future. Include in the vision a list of questions (problems) and answers (solutions) that could have an impact on reaching the company's future vision.
Step 3: Follow up. On a continuing basis, test the futures council's list of problems and solutions against the matrix, and take appropriate action.
Opportunities are like buses. There is always another one coming.
SWOT is the acronym for strengths, weaknesses, opportunities, and threats. In a traditional SWOT analysis, these four categories are investigated independently and fed into the planning process. In dialectical SWOT, we treat Strengths and Weaknesses as internal factors and Opportunities and Threats as external. Traditional SWOT analysis generates a powerful and reasonably comprehensive strategic snapshot. The unique value in this approach comes from juxtaposing information from these two categories, as shown in Figure 6.19. Each quadrant of the matrix represents a unique combination of Internal and External conditions, and each produces a specific recommendation.
The Two Dimensions and Their Extremes. The SWOT matrix explores two key dimensions: External Environment and Internal Environment:
External Environment. Organizational success depends on sensing and responding to shifting conditions in the business environment. At the most basic level, these represent Opportunities and Threats.
Internal Environment. The ability to compete effectively depends on the resources and knowledge available to the organization. We draw on our Strengths and guard against possible exposure created by our Weaknesses.
The Four Quadrants Dialectical SWOT defines four zones of risk and reward, each demanding a different response. The key to success often lies in being proactive:
Upper left: Confront. Threat is matched with organizational strength. Businesses face these conditions all the time—new competitors, legislative changes, commoditization of a core offering, and many others. Mobilize to limit and control the looming danger.
Lower left: Exploit. Opportunity is matched with strength. This is a business's growing edge, where it can capitalize on areas of strategic advantage. The one caution here is to be careful not to ignore other demands. Vital and scarce corporate resources are too easily drawn to exciting and rewarding growth-oriented projects, which can deplete the organization's ability to deal effectively with more mundane and defensive challenges.
Lower right: Search. Opportunity is matched with weakness. This quadrant represents a conundrum. Opportunities exist that the organization can recognize but is not equipped to tackle. The gap may be financial, scale, location, or any of a number of other factors. Creative options are needed. If you don't act on the opportunity, perhaps a competitor will, with potentially disastrous consequences.
Upper right: Avoid or Prepare. Threat is matched with Weakness. Some threats are avoidable, and others are not. Confronting competitive Threats with Weakness is not only dangerous but also resource draining. When possible, it is best to avoid such situations. Consider the company about to enter a price war with a much larger and better-financed adversary. Sometimes, however, the threat cannot be sidestepped and must be addressed, whatever the cost.

Method. Follow these steps to conduct a dialectical SWOT analysis:
Step 1: Generate lists of strengths, weaknesses, opportunities, and threats. Be sure the people involved in completing this task have the necessary knowledge and independence to report in an honest (not fearful or protective) way.
Step 2: Assess the interactive effect of the internal (Strengths and Weaknesses) and external (Opportunities and Threats) observations. Place the conclusions onto the dialectical SWOT matrix.
Don't plan to play the high[er] stakes, winner-take-all battle to become the standard unless you can be aggressive in timing, in pricing, and in exploiting relationships with complementary products.
It is not unusual for technology markets to be dominated by a single technology standard, and sometimes by a single large firm. The Market Tipping matrix (Figure 6.20), introduced by Carl Shapiro and Hal R. Varian in Information Rules, examines whether a developing technology market will tip to a single dominant player. It is risky to compete in "tippy" markets, since losers can end up with zero market share.
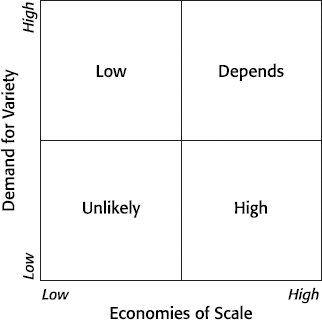
The Two Dimensions and Their Extremes. The Market Tipping matrix explores two key dimensions: Demand for Variety and Economies of Scale:
Demand for Variety. Demand for Variety ranges from Low, in which one standard prevails (such as the QWERTY keyboard), to High, in which the market supports competing standards (as in data storage technologies). Variety should not be confused with implementing a standard design in a broad fashion. DVD players are implemented in different styles, but to users, compatibility with the existing interfaces and formats is more important than style. When customer demand for variety is low, the dominant player can be dislodged only by vastly superior technology or favorable economics, such as low or no switching costs.
Economies of Scale. Economies of Scale refer to cost advantage as a result of size or volume. They can be demand side or supply side in nature and range from Low to High.
The Four Quadrants. The matrix describes four degrees of likelihood that a market will "tip" to a single supplier:
Upper left: Low. Products requiring highly specialized electronics or software, from one-of-a-kind medical devices to Saturn rockets, fall into this category. Customer requirements are so specialized that standardized manufacturing is impossible.
Lower left: Unlikely. Low Demand for Variety and Low Economies of Scale are usually found together when products are introduced and demand has not risen to the point where it triggers positive feedback or provides manufacturing economies of scale. For example, Apple's Newton satisfied a small group of customers but never created a mass market.
Lower right: High. This is what Shapiro and Varian refer to as a classic "tippy" market. Users want to choose a product that will win in the marketplace. Once they make their collective decision, powerful network effects set in. The CD format, introduced by Sony and Phillips in 1982, took seven years to overcome vinyl and audiocassettes in the market. Once its dominance was established, it moved into other devices. Now, computers, audio players, DVD players, and even some video cameras can read CDs.
Upper right: Depends. Many technology markets start out in this quadrant, with lots of competing products and firms. But demand for variety diminishes as market needs coalesce and mature. Currently, users of Linux software can choose from a half-dozen popular varieties of the Linux operating system. If all these versions continue to work well together, they may continue to divide the market.
Method. You need to make qualitative judgments about variety and scale to determine the likelihood that a market will tip to a dominant vendor or standard:
Step 1: Assess demand. Determine customer demand for variety.
Step 2: Assess tippiness. Determine economies of scale. Will high volumes lead to lower costs in sourcing, manufacturing, transportation, marketing, distribution, and retailing? If these are combined with network effects on the demand side, you are dealing with a market likely to tip.
Step 3: Determine impact. Describe the impact of this market's tippiness on your proposed offering or plan.
What are our main strategic options? How do we differentiate our offerings? How do we tailor our offerings for different markets?
The core of strategy is design of the value proposition and how it is competitively positioned and delivered. Debate about these points in organizations can be extensive and heated, with many people convinced that they are right and others are not. Ultimately, direction must be set, and unanimity of support and understanding for the strategy can spell the difference between winning execution and lackluster performance.
Strategic Options frameworks offer criteria for generating and prioritizing ideas. Paradoxically, limiting the field of focus spurs the imagination and improves the richness of output. More than the other matrices in this book, these frameworks support collaborative efforts where many views are aired in a noncompetitive atmosphere, and the best ideas can be selected and built on by interdependent members of teams and larger communities.
Of course much that is new and different has been added, but the rock on which everything has been built was provided by Igor Ansoff.
Ansoff's 1965 classic, Corporate Strategy, contains one of business's most important and enduring strategic formulations. Before becoming a distinguished academic, writer, and consultant in the mid-1960s, Ansoff progressed through a series of planning positions at the Rand Corporation and Lockheed, ending this phase of his career as vice president and general manager of the Industrial Technology Division at Lockheed Electronics. Experience with diversification planning helped him formulate key issues and tensions that firms face in choosing a growth strategy. The operating problem is akin to determining the best way to milk a cow. The strategic challenge is of a different order: "But if our basic interest is not the cow but in the most milk we can get for our investment, we must make sure that we have the best cow money can buy."[61] In strategic terms, this translates into product-market combinations that are most advantageous to the firm. The Product-Market matrix (sometimes called the Corporate Strategy matrix) defines the options for achieving this (Figure 6.21).
The Two Dimensions and Their Extremes. The Product-Market matrix explores two key dimensions: Product and Market:
Product. Businesses are built around products and services that define their value offering. Most offerings are limited in at least two ways: time, in that their relevance diminishes and redesign or renewal is usually required, and transferability, in that they tend to work best under certain market conditions. Ansoff noted that modifying the core offering is a key strategic choice.
Market. Generally applied as Market options, this dimension distinguishes between customer markets that are well established and known to the firm versus all the rest that are not.

The Four Quadrants. In Ansoff's terms, each of the four possible options defines a core strategic response to a different set of internal and external conditions. Careful assessment leads to better understanding and decision making:
Upper left: Product Development. Marketers understand the enormous value of a positive customer relationship and the goodwill and trust that go with it. This relationship capital allows a company to make new product offers more effectively and inexpensively to existing customers than to new ones. The advantages of this must be weighed against the possible damage resulting from negative spillover from the new to the existing product experience should it not be entirely satisfactory. When Stihl, the maker of the world's top chain saws began to sell augurs, hedge trimmers, and complementary items such as cut-retardant leg chaps, it was practicing Product Development. Heineken has achieved great success by introducing over eighty brands around the world.
Lower left: Market Penetration. This is the de facto strategy: change nothing and sell more of the same to existing customers. When a business does not consciously select a growth or diversification strategy, it is doing this. When Stihl sells to the forestry industry, it is in this quadrant, as is Heineken when it supplies beer to European drinkers. This is the preferred strategy when a company's product is performing well and there is room to increase market share.
Lower right: Market Development. A well-developed product can be introduced into new markets to extend its value. This is ideal when little modification is required and room for growth in the original market is restricted. Products as diverse as food, pharmaceuticals, and automobiles fit this category. When Stihl reached out to recreational users and North American buyers, it was employing a Market Development strategy, as was Heineken when it began exporting its beer outside Europe, with great success.
Upper right: Diversification. Diversification represents a near total strategic overhaul, simultaneously trading in both Product and Market. It is the most challenging, costly, and risky of the options. New skills and relationships need to be developed. Companies choose this strategy in conjunction with one or more of the others or when they have recognized a crisis. Ideally, there is a gradual migratory path leading from the known to the unknown. It would be easier for Stihl to evolve into a retail hardware supplier, say, than a candy manufacturer or entertainment company. The recent misfortunes of Seagram's Distiller' and Vivendi's (historically a water and utility company) painful transformation into a communications, media, and entertainment company are a reminder of the riskiness of Diversification.
Example: Green Mountain Coffee Roasters. Green Mountain Coffee Roasters (GMCR) began as a house brand at a small café in Waitsfield, Vermont, in 1981. Brewed from high-quality beans roasted on the premises, the coffee quickly became a favorite of locals and vacationers. Before long, it had expanded far beyond the café walls to become one of the top specialty coffee companies in America, generating annual revenues of $97 million with a growth rate close to 20 percent.[62]
It is hard to think of a more generic item than coffee, the second most highly traded commodity in the world after oil. The $55 billion industry in the United States is dominated by four global companies (Nestlé, Procter & Gamble, Sara Lee, and Kraft) that buy almost 50 percent of the world's coffee. The specialty category of excellent brewed coffee took shape in the 1970s, with several brands and retail chains gaining great popularity. Starbucks has emerged as the category gorilla, growing from a single outlet in 1971 to almost six thousand locations worldwide today.
Green Mountain Coffee Roasters has followed a different path to success, staying clear of the fiercely contested retail outlet market space, which coincidentally would not have fit the company philosophy of matching quality product and experience with ecological and ethical practices.
In Ansoff's terms, GMCR started life as most start-ups do, with an attractive value proposition that the originators were uniquely qualified to deliver (Figure 6.22). Their first expansion efforts took the form of Market Penetration. The popular coffee almost sold itself: visitors bought bags to take home with them and eventually began to order by mail. GMRC sold more of the core product to existing customers to max out its return on the original business platform.
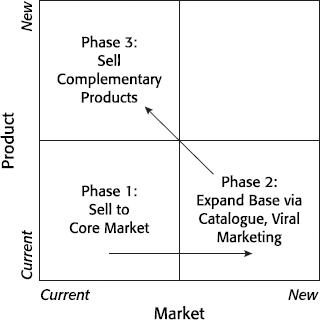
Success with the core business led to a second strategic phase, Market Development. The demand for high-quality, ethically produced coffee was expanding, and this demographic segment of the population was not opposed to paying a premium to attain what they wanted. With excellent positioning and word-of-mouth viral marketing in their favor, they expanded the customer base through mail order sales, eventually producing an on-line and paper catalogue.
The third strategic phase, Product Development, grew in conjunction with catalogue-based sales, as customers welcomed a range of complementary item offers, from cups to roasters.
Context. The Product-Market matrix is one of the most intuitive and flexible strategic frameworks, applied by planners and decision makers in organizations of all sorts and sizes. The ideal time to use the framework is at the start of the planning cycle or to help in making tough decisions about business focus.
Method. The Product-Market matrix presents a structured approach to investigate and prioritize four basic strategic options for expanding a business. The method typically starts with what is and ends with what is imaginable. Risk increases as strategy moves further from the current situation:
Step 1: Diagnose. Define the product-service focus for analysis. A company with multiple offerings is advised to consider each separately at first.
Step 2: Envision. Consider each of the four strategic options, beginning in the lower left quadrant. The prime questions are, "Should the offering stay the same or should it change?" and "Should we focus on current customers or new ones?"
Step 3: Decide. Assess the attractiveness of each of the four strategic options. In most cases, pursue the easiest path as the top priority.
Step 4: Design. Build a clear action plan to implement the chosen strategy.
Ansoff, I. Corporate Strategy. New York: McGraw-Hill, 1965.
Hussey, D., and Ansoff, I. "Continuing Contribution to Strategic Management." Strategic Change, 8(7), 375–392.
Competitive advantage grows fundamentally out of the value a firm is able to create for its buyers.
In his epic 1980 book, Competitive Strategy, Michael Porter lays out one of the most complete and coherent foundations in the field of strategy. Each industry is shaped by a set of competitive forces that determine its nature and profitability in structured and predictable ways. Competition within industries is natural and inevitable. Firms gain a competitive advantage by creating value for buyers. Strategy should be intentional, not accidental or optional. Two central issues shape the work of the business strategist: the attractiveness of the industry and the relative positioning of a firm within an industry.
An industry's attractiveness is largely determined by the interplay between a set of core competitive factors. Applying what is now known as Porter's Five Forces model, strategists are directed to a careful consideration of Entry Barriers, Buyer Power, Supplier Power, Threat of Subsitutes, and Rivals to understand the structural makeup of an industry. For example, concentrated Buyer or Supplier Power limits the range of freedom and negotiating room, while low Barriers to Entry will keep incumbent competitors more vigilant and price sensitive than ever before. Not all industries are equally attractive, and Porter offers a rich analytic approach to determining what is going on and where to concentrate investment efforts.
Profitability and long-term sustainability depend on a firm's positioning within an industry. Even some relatively unprofitable industries, like computers and cable television, reap sizable rewards for certain of the value chain participants. In Porter's modeling of Generic Strategy options (Figure 6.23), he maintains that firms may possess a myriad of interesting and unique strengths and weaknesses. However, their competitve advantage is determined by one of two things: low cost or differentiation. Strengths are relevant to the extent that they enable or block these two strategies. The context in which this advantage is pursued can be either broad or focused, creating an additional set of strategic approaches. Companies are advised to avoid straddling more than one option, since dilution limits their ability to execute their strategy and makes them vulnerable to others with greater focus and discipline.
Porter has continued to develop his ideas on competition and strategy, first looking at their application to governments in the Competitive Advantage of Nations, and more recently the competitive importance of geographically based clusters like Silicon Valley for computing, Grand Rapids, Michigan, for furniture, and northern Italy for weaving.

The Two Dimensions and Their Extremes. The Generic Strategy matrix explores two key dimensions: Competitive Advantage and Competitive Scope:
Competitive Advantage. Firms must choose between Lower Cost and Differentiation. These are inherently in contradiction to one another, since Differentiation generally requires a higher level of investment.
Competitive Scope. Firms can compete Broadly across an industry, or they can Focus Narrowly on one or several segments.
The Four Quadrants. Porter writes, "'Being all things to all people' is a recipe for strategic mediocrity and below average performance, because it often means that a firm has no competitive advantage at all."[64]
Firms often gain advantage by adopting one of the generic strategic approaches, and then relinquish it when they attempt to pursue one of the other strategies in tandem. While it may be tempting at times to do this (Porter refers to this as "getting stuck in the middle"), it is rarely advisable or sustainable. Each of the four options in the matrix is a unique response to industry structure and the strengths a company can call on:
Upper left: Cost Leadership. This is the clearest of the generic strategies. Cost Leadership involves achieving the lowest costs in an industry while maintaining an acceptable level of quality. Typically, only one competitor can win with this strategy. Low costs are attainable in a variety of ways, drawing on the industry structure and the company's strengths. Some of the cost-limiting sources are preferential access to raw materials, better production methods, economies of scale, and more efficient distribution channels. A common low-cost strategy is to offer the no-frills version while ensuring that the most highly weighted aspects of customer value are preserved. It is important to maintain what Porter calls parity in the offer to prevent erosion of customer goodwill due to an unacceptable drop in quality as compared with available alternatives.
Lower left: Cost Focus. In the Cost Focus strategy, a firm takes advantage of the unique needs of a segment of an industry that is difficult or uneconomical for the Broad Cost supplier to service adequately. Sometimes Broad Cost competitors must overperform to meet the special needs of some segments, where a less costly solution or product would suffice. This occurs in the world of high-tech equipment when manufacturers sell higher-grade devices and components set to a lower performance level. Or there may be custom requirements that lend themselves better to smaller, more tailored low-cost offerings. A group with special dietary needs may be better served by a company that can focus exclusively on them than by generic suppliers. Porter uses the example of a small paper mill's superior ability to execute cost-effective, low-volume runs of high-quality specialty paper.
Lower right: Differentiation Focus. The Differentiation Focus strategy applies the principle of added value within a small segment of a market rather than across the entire market. Customer needs are sometimes met in an uneven way, with some groups left to adapt a good deal of the offering to meet their requirements. Rural markets may require extra service; an in-depth understanding of a special technology may be worth extra money to customers seeking reliability and risk reduction.
Upper right: Differentiation. In differentiating, a firm sets out to deliver some unique form of value that customers recognize and appreciate. A differentiation strategy depends on developing or exploiting talents and resources that set the company's offer apart in a way that is both meaningful and difficult to replicate. The reward for successfully differentiating is customer loyalty and the right to charge a premium price. Examples of differentiated offerings are plentiful, from fine wines to high-tech products from Apple and RIM. When you think quality and hard to replace, you have the basis for differentiation.
There are numerous ways firms go about differentiating themselves. They can add features and functionality to a product, improve process effectiveness to the point that it is truly significant, or dramatically enhance service quality, creating a noticeably better experience than their competitors. Unlike Low Cost, a number of competitors can pursue Differentiation strategies simultaneously, each exploiting a different valued attribute of the offering.
Example: Automotive Industry. By the turn of the twentieth century, an assortment of electric-, steam-, and gasoline-powered vehicles were being produced by a large number of mostly small craft operations.[65] Each automobile took several days to build, and product performance was spotty. Use of cars was reserved for the wealthy, who drove primarily for luxury and sport. The industrial revolution had provided the means for manufacturing key automotive ingredients like metal and rubber. It was the application of assembly line thinking to building the car itself that enabled wider access by lowering prices and increasing volume and quality control capabilities.
The Generic Strategy view is that over time, the strongest strategy will win. Companies need to draw on their strengths to respond competitively to the industry context, which is defined by Porter's five forces. The history of the automotive industry is instructive, as illustrated by the strategic approaches of a number of well-known companies (Figure 6.24).
In 1913, the Ford Motor Company introduced the first moving assembly line in the automobile industry and quickly became the largest car company in the world. Buyers wanted a reliable low-cost option and gladly traded uniqueness for the new standard. For almost a decade, Ford dominated the market, setting the pace for suppliers and customers, without any real direct competitors in sight.
In the 1920s, General Motors (GM) read the market forces right, offering attractive features at premium prices to an increasingly affluent public that was becoming more familiar and trusting of automotive technology. Rallying to GM chairman Alfred Sloan's famous differentiation dictum, "A car for every purse and purpose," GM went on to become the number one car company.

Focused Cost strategies appeal to buyers willing to do some of their own maintenance and put up with a bit of inconvenience. The Russian-made Lada was sold for several years in the West at a remarkably low price; however, the consistently poor quality and after-sales service record finally deterred even most bargain hunters. The Korean Hyundai has aggressively won market share in recent years with a higher-quality low-cost offering.
A number of Focused Differentiation brands have succeeded at the higher end of the price spectrum. Volvo, Rover, Corvette, and others have been able to attract and retain loyal customers for decades by providing a unique driving experience.
Due to the size and complexity of the automobile market, it has regularly been possible for some companies to succeed with the more dangerous stuck-in-the-middle strategy. The VW Beetle did this through the 1960s and 1970s, as have the top-selling Honda Civic and Toyota Tercel more recently.
But even in this large and diversified industry, we see that companies must eventually choose a clear strategy to remain competitive as tastes change and imitators find ways to duplicate successes and remove the uniqueness of an offer.
Context. Porter's Generic Strategy is often used in conjunction with the five forces diagnosis in devising corporate strategy. The most natural fit for the approach is in very large firms that can realistically pursue the scale of options contained in the model. It is useful for firms of all sizes for taking stock of competitive conditions and plotting the strategies of competitor firms.
Method. Generic Strategy is determined through a careful analysis of competitive forces. The steps describe the process at a high level:
Step 1: Define. Define the domain of business interest and industry boundaries.
Step 2: Scan. Complete an analysis of the five forces at play in the industry.
Step 3: Diagnose. Determine which of the generic strategies is most suitable, given the industry analysis and the unique strengths and weaknesses of the firm.
Step 4: Plan. Develop a plan to implement the chosen strategy.
Porter, M. Competitive Strategy. New York: Free Press, 1980.
Porter, M. Competitive Advantage. New York: Free Press, 1985.
Porter, M. Competitive Advantage of Nations. New York: Free Press, 1988.
Exploitation of e-business involves capturing key changes in value contribution from the physical marketplace to the virtual information space.
Computer devices and networks make it possible for businesses to transform their offerings in two ways (Figure 6.25). First, they can change the Context—the environment in which transactions take place and the experience of consuming a good or service. As the Context moves from physical to virtual, new forms of value, such as greater inventory or twenty-four-hour availability, become possible. Alternatively, they can extend or redefine the Content of a current offering by using computer technology to add information to it. In many instances, it is possible to combine approaches, adding both virtual and informational value. Amazon's on-line transactions enable customers to buy books from any Internet browser twenty-four hours a day, and the Customer Review feature adds an information service to the book-buying experience. Hertz lets customers reserve cars on-line, while its airport kiosks provide maps and tourist information that add value to the car rental environment.
The Two Dimensions and Their Extremes. The E-Business Opportunity matrix explores two key dimensions: Context and Content:

Context. The environment in which customers transact, consume, or receive support can be located in the Physical or Virtual realm.
Content. The core value of an offering can be Physical (for example, a book) or Virtual (for example, monitoring location or status).
The Four Quadrants. Companies should consider a mix of e-business Context and Content strategies to dramatically improve value propositions:
Upper left:
Biz.com. TheBiz.comquadrant maps opportunities made available by simply moving a physical product or service to the Web context. On-line banking enables customers to check accounts and transfer money from any browser.Lower left: Status Quo Innovation. This is the starting point for reinvention. Although the focus of the exercise is on technology-enabled transformation, many good ideas involve nondigital innovations—basic improvements to the status quo business.
Lower right: E-innovation. These add a virtual content dimension to an offering within the existing physical environment. For example, ATM machines revolutionized banking by offering information and transactions twenty-four hours a day at the local branch.
Upper right: Breakthrough. The most spectacular opportunities answer the question, "How can the Web and related technologies help create totally new competencies, products, or services that can be leveraged across multiple vertical markets?" On-line mapping software changes both the Context and Content of finding directions, adding new value that can be used in transportation, telecommunications, public safety, and other fields.
Method. This tool is best used with groups tasked with identifying new opportunities.[67] A work team of five to eight people is ideal:
Step 1: Assess. As a group, discuss how you could use computers, networks, and mobility to change product design, manufacturing, distribution and delivery, sales and marketing, transactions, and customer support.
Step 2: Envision. Ask each individual in the group to write ten e-business ideas that they would like to explore. Write each idea on a single sticky note.
Step 3: Present. Draw a large version of the E-Business Opportunity matrix on a white board or flip chart. Ask the group to present their ideas, placing each sticky note in the most appropriate matrix quadrant.
Step 4: Synthesize. Group similar ideas. For example, you may have five ideas related to product delivery that can be combined into a single innovative project. Define and prioritize the idea groupings that make sense as possible e-business projects.
Tapscott, D., Ticoll, D., and Lowy, A. Digital Capital: Harnessing the Power of Business Webs. Boston: Harvard Business School Press, 2000.
After the product was launched, the company discovered that the British consume their cake at tea time. The cake they prefer is dry, spongy and suitable for being picked up with the left hand while the right manages a cup of tea.
Geographical expansion presents an attractive way a company can develop its business and reap further rewards from a successful offering. On the surface, it might seem obvious that every successful product in a specific market should be sold around the world. Reality is quite different. Local competitive, cultural, supply chain, and regulatory conditions present challenges. Companies differ in their readiness to sell into a global market and need to think seriously about their commitment to developing the necessary competencies. Warren Keegan has devised a useful framework for considering the major strategic options for pursuing such growth, looking at both the Product itself and the Communications strategy (Figure 6.26).
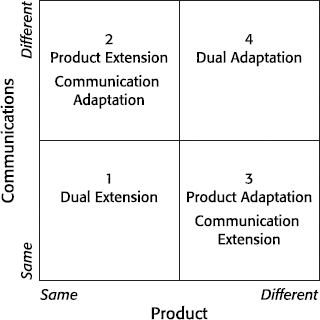
The Two Dimensions and Their Extremes. The Global Product Planning matrix explores two key dimensions, Communications and Product:
Communications. This refers to the way an offering is marketed and advertised. The approach may remain the same, or it may be altered to address local needs and tastes.
Product. The offering can remain unchanged, or it can be modified to accommodate the new context.
The Four Quadrants. In geographical expansion, both the Product and the Communications strategy may or may not be altered to reflect local market requirements. Consideration of possible combinations defines four major expansion strategies. Companies can choose one or several of the options for their strategic approach:
Upper left: Product Extension/Communication Adaptation. This strategy is ideal when the product can be sold as is to meet a different set of needs. Perrier mineral water became popular in Europe for its healthful properties, but succeeded in North America as the chic beverage choice in restaurants and bars in place of a cocktail. The biggest differences in product use can be seen between developed and less developed economies. Bicycles and scooters are primary leisure items in one and primary transportation in the other.
Lower left: Dual Extension. Under the right conditions, this strategy is the easiest and cheapest to implement. Software and construction tools and materials are examples of Dual Extension. It is easy to make erroneous assumptions or overlook subtle differences that ultimately derail a wholesale extension of both Product and Communications. Something as innocent as soup tells the story. Campbell learned the hard way that diners in the United Kingdom preferred a more bitter-tasting mix than Americans, and Knorr found Americans surprisingly unfriendly to their powdered package variety.
Lower right: Product Adaptation/Communication Extension. Some products and brands have universal appeal even when the product undergoes varying degrees of modification. Exxon modifies its fuel formula for different geographies and weather conditions, but to the customer, it's still, "Put a tiger in your tank." The breakfast cereal Mueslix tastes completely different in Europe than it does in North America.
Upper right: Dual Adaptation. In some cases, both the Product and the Communications strategy need to be modified to fit a variety of local conditions. For years, Unilever sold its fabric softener in different-sized bottles and under a variety of brand names in European countries. Hallmark and other greeting card companies modify their design, packaging, and marketing for the European and North American markets due to cultural idiosyncrasies. American cards contain prepared messages, while the European ones leave blank space for personal notes.
Method. The matrix is useful in two contexts: planning the geographical expansion of a single product offering and reviewing a company's portfolio of businesses.
Step 1: List key product features.
Step 2: Select target markets.
Step 3: Ask how well the product would work in these markets: perfectly (Extend), well enough (Adapt), or not at all (consider dropping).
Step 4: Ask how well marketing promises and basic product functionality would transfer to these markets: directly (Extend), with work (Adapt), or not at all (consider dropping).
Step 5: Locate the product offer on the Global Product Planning matrix, and build a plan.
The information age is built on the economics of networks, not the economics of factories.
A network market is one in which the value of the product to any particular user increases with the number of users. For example, a fax machine becomes more valuable as more fax machines are connected to the network. Each new purchaser is buying the value of being connected to all of the other machines on the network. This creates strong positive feedback that drives adoption, a dynamic common to many high-technology markets.
Varian and Shapiro identify four generic strategies for innovators in network markets. Two crucial elements determine the nature of the network strategy: Migration Strategy and Platform design (Figure 6.27). Migration strategies are either in line with existing technology (evolutionary) or represent a more radical departure (revolutionary). Platform design options range from technical standards that are closed and proprietary to ones that are open and public.
The Two Dimensions and Their Extremes. The Generic Network Strategy matrix explores the two key dimensions of Migration (or Adoption) Strategy and Platform:

Migration (or Adoption) Strategy. Migration (or Adoption) Strategy can emphasize Compatibility or Performance. Compatibility is an evolutionary approach in which new products are fully capable of integrating with existing technology. The Performance approach is revolutionary and makes existing hardware and media obsolete.
Platform. A single vendor may control the technical specifications and business opportunities of a platform, or it may be open so that anyone can design and sell products for it. Control generates maximum value for the firm through customer lock-in and licensing opportunities, but Openness may ignite positive feedback more quickly. A mix of Control and Openness is often the optimal approach.
The Four Quadrants. Each quadrant defines a different strategic approach. Businesses need to assess both the competitive environment and the innovation itself in selecting the best option:
Upper left: Controlled Migration. Controlled Migration is often the least risky strategy because it does not orphan existing technology. For example, when a user upgrades Windows, all existing documents remain usable. The strategic challenge in Controlled Migration is to give current customers sufficient reason to upgrade.
Lower left: Performance Play. Performance Play offers customers a new product that is not backward compatible and is available from only one manufacturer. Customers fear lock-in, and competitors may offer technology that is more open, as happened in the case of VHS versus Sony's controlled Beta format. Conversely, such a strategy works well if performance is important enough. Nintendo, Sony, and Microsoft video game players are examples of Performance Play strategies.
Lower right: Discontinuity. Customers fear buying a new, unproven technology owned by a single vendor. Discontinuity overcomes this by creating an open platform, so that there are plenty of suppliers that can support the product. When all the manufacturers in an industry line up behind a single standard, as happened with CD audio, it becomes much easier to dislodge existing technology.
Upper right: Open Migration. Open Migration reduces risk for customers by ensuring that new products are backward compatible with existing hardware and software and that many vendors can compete. The television industry, with a nudge from government, has always operated on an Open Migration basis.
Method. One's current market position—strong or weak—and the ability to gain cooperation from other hardware and software firms have a great impact on network strategy:
Step 1: Assess the market. Does the market in which your product competes exhibit strong network characteristics?
Step 2: Diagnose strategic fit. Does your product fit neatly into one of the quadrants, or could it conceivably fit one of the other strategies as well?
Step 3: Envision. Make a list of the potential risks and payoffs of pursuing each of the strategies available to you. Which has the least risk and which the greatest payoff?
Step 4: Plan. Select the most promising strategic option, and create a plan that reduces foreseeable risks.
How will we position ourselves in the marketplace? What is our communication plan?
Much as strategy defines core value, marketing determines how it will be presented. In an increasingly competitive, overdeveloped marketplace, decisions about how, when, and to whom become significant determinants of success. A movie is the core value, and almost everything postproduction is marketing. The Lord of the Rings movie was split into three audience experiences, each a year apart to build anticipatory excitement and sustain interest and identification with the story and its characters.
The evolution of mass media to targeted communications is permitting increasingly customized marketing plans to be aimed at tightly defined customer segments. Frameworks selected for this section help to model customer characteristics and needs so that messaging decisions are well matched to unique preferences.
Each customer is unique and they all deserve to have exactly what they want at a price they are willing to pay.
For the first half of the twentieth century, the developed economies were defined by mass production. Markets were large and homogeneous; customer segments, where they existed, were defined crudely. Mass manufacturing and mass markets delivered finished goods at reasonable prices to many of the world's citizens. In exchange, some things were lost. In terms of quality, many early manufactured goods were not better than the handmade goods of the craft economy; indeed, they were inferior. In all instances, customers needed to sacrifice choice and customization in order to obtain the benefits of manufacturing economies of scale.
In the 1970s, firms around the world began chipping away at the mass production model, primarily through paying attention to incremental process improvements in design and manufacturing. By the early 1980s, Japanese firms had taken the quality lead in market after market, dominating consumer electronics and toys and eventually taking a large slice of fields such as autos and machine tools. Many of the flexible manufacturing techniques pioneered in this era enabled shorter product runs and quicker production process changes, leading to an explosion in consumer choice in dozens of industries. For example, from 1950 to 2000, the average supermarket went from offering three thousand items to fifty thousand or more.
More recently, this trend has crystallized in the practice of mass customization, characterized by variety, time-based competition, just-in-time production, shortened product life cycles, continuous process reengineering, and customer-centric database marketing. Examples abound, from Burger King's strategy of cooking each burger for a specific customer ("Have it your way!") to the telephone companies that have gone from offering one-size-fits-all residential service to hundreds of flexible (and sometimes confusing) packages aimed at different groups and individuals. Mass consumers, media, and markets are being replaced by diverse populations, targeted media, and markets of one.
In The Experience Economy, Pine and Gilmore identify four approaches to mass customization (Figure 6.28). Core to their thesis is the idea that the sacrifices that customers make in purchasing and consuming offerings drive the opportunities for mass customization. In the past, these sacrifices were commonplace and embedded in aphorisms like: "You can have any color as long as it's black," and, "Speed, quality, and price; choose any two." Today, we still have to make trade-offs. No business can offer an infinite choice of styles and materials plus immediate delivery. However, mass customization strategies enable businesses to meet customer needs by strategically removing sacrifices that matter to specific individuals. The Mass Customization matrix offers a powerful tool for analyzing customers' sacrifices, and selecting the mass customization approach that best fits their needs.
The Two Dimensions and Their Extremes. The Mass Customization matrix explores two key dimensions: Product and Representation:
Product. One can offer a standard unchanging product, or customize the product for individual customers.
Representation. Representation can be standard or uniquely structured for each customer. Aspects that can vary include marketing, packaging, delivery, pricing, and support choices.

The Four Quadrants. Four Mass Customization strategic approaches are defined by varying the extent to which Product and Representation are modified:
Upper left: Transparent. Often, customer needs are predictable or can easily be deduced. Companies as different as Ritz-Carlton and Lands End observe and record customer preferences in order to minimize the sacrifice customers make in repeatedly filling out forms or making their preferences known. In this way, offerings can be customized within a standard package for individual customers.
Lower left: Adaptive. Adaptive customizers offer a standardized product that customers can adapt to fit personal usage patterns. Adaptability is built into the product so that customers can personalize it after purchase. The Adaptive approach works well when there is a standard offering but so many variations in style and usage that sorting through the alternatives can be difficult. Select Comfort of Minneapolis manufactures and sells the Aero bed. Its unique air chambers enable couples to select different levels of firmness on either side of the bed. Many luxury cars enable drivers to adapt the seat and mirrors to their personal driving style and then recall it with the touch of a single button. The recently introduced Toyota Scion was designed to make it easy for after-market producers to sell customized add-ons to the car, enabling owners to individualize their car's appearance and performance attributes.
Lower right: Cosmetic. This approach works best when different customer segments use a product the same way but receive personalized value from specialized packaging, marketing appeals, and delivery options. Banks, for example, have experimented widely with checking, savings, and loan offerings that differ primarily in how the product is represented to customers. The underlying service does not change, but the manner of representation and delivery personalizes the experience and adds convenience.
Upper right: Collaborative. The Collaborative customizer works closely with the customer to determine the value to be created. Drum Workshop, a maker of professional equipment for drummers, lets shoppers try out various colors and styles on-line, save the data, and send the order to the retailer of their choice. When customers are faced with a multitude of confusing options and may have to live with the product for a considerable time, Collaborative customization helps them feel confident in their choices.
Example: Herman Miller. Herman Miller is a leading office furniture producer and progressive employer that has been named the top furniture company by Fortune magazine for fifteen of the past sixteen years. The company's roots lie in its groundbreaking designs, many of them in the permanent collections of leading museums such as the New York Museum of Modern Art and the Whitney.
Historically, Herman Miller built high-quality, durable office furniture for large corporations, offering a wide set of options with millions of combinations of color, fabric, and style. Customers typically placed large orders with long lead times. In effect, many of Herman Miller's orders were customized in terms of styling and design. The sacrifice that customers had to make—speed—was tolerable for large, stable companies that could afford to plan their office changes well in advance of when they were needed.
The same, however, was not true for smaller, less established companies, where the costs of customizing smaller orders or meeting demands for speedier delivery were prohibitive. In the late 1980s, Herman Miller embarked on a continuous improvement campaign that drastically reduced inefficiencies and accelerated manufacturing processes. Most important, it developed technologies that enabled customizing on the fly. If a customer wanted a fifty-five-inch desk rather than a standard fifty-inch model, this could be accomplished quickly. Delivery times were cut significantly, sometimes by up to several months. This set the stage for several new mass customization initiatives.
In 1996 the company rolled out Miller SQA ("Simple, Quick, Affordable"), which offered cheaper office solutions through a selection of no-frills furniture. SQA also offered built-to-order products that targeted smaller companies looking for top quality and fast-growing larger companies that needed quick delivery. Both of these groups were more interested in furniture choices that fit their needs and personalized delivery than with details like the choice of fabric. By limiting choice in the SQA lines, Herman Miller was able to satisfy customers who didn't have time to sift through options, and to deliver much more rapidly than before. SQA integrated aspects of Cosmetic, Transparent, and Collaborative customization strategies (Figure 6.29). In 1998, it launched hmstore.com, enabling customers to configure and order office furniture on-line (Collaborative customization). This concept was extended by the development of Herman Miller Red in 2000, a brand with a limited line of furniture exclusively available on-line (Cosmetic customization) and at a single store in New York City. During this same period, Herman Miller was also making its office systems offerings more modular and flexible, enabling customers to quickly change furniture to meet the varying needs of work groups (Adaptive customization).
Companies that have traveled the path that Herman Miller followed understand the paradoxes of mass customization—lower costs can lead to better service; fewer choices can mean greater customer satisfaction—and have profited from using them to reduce customer sacrifice.
Context. The Product-Representation matrix offers a creative and convenient way to customize products, services, and experiences for customer groups.
Method. The steps below provide a high-level blueprint for creating a mass customized approach to meeting customer needs:
Step 1: Assess sacrifice. What kinds of sacrifices do customers currently make to purchase and use your product or service? Sacrifices include delays, searching and sorting challenges, and lack of personalization. List up to three sacrifices.
Step 2: Diagnose. Which mass customization option would enable you to overcome these sacrifices? If you have more than one product, place each in the ideal quadrant.
Step 3: Envision. Imagine ways to streamline the experience so that customers are offered only what they need, and nothing more.
Step 4: Implement. Explore the implications of your mass customization assessment with appropriate staff, and develop solutions.

Pine, B. J. II. Mass Customization. Boston: Harvard Business Press, 1993.
Pine, B. J. II, and Gilmore, J. H. The Experience Economy. Boston: Harvard Business School Press, 1999.
Pine, J., and Pine, J. "The Four Faces of Customization." Harvard Business Review, Jan.-Feb. 1997.
Companies that succeed in the future will be those expert not in time management, but in attention management.
In a world overwhelmed with information, attention becomes our scarcest resource. Davenport and Beck's The Attention Economy describes how attention works and can be leveraged as a key asset in a knowledge economy. The Attentionscape tool (Figure 6.30) helps companies measure attention so it can be managed better. This has relevance both within firms, looking at how executives and employees direct their interests, and outside firms, focusing on customers.
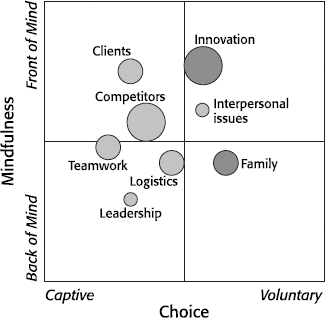
The Two Dimensions and Their Extremes. The two dimensions of Mindfulness and Choice define the Attentionscape matrix:
Mindfulness. Attention that is conscious and deliberate is Front of Mind. If it is unconscious and spontaneous, it is Back of Mind.
Choice. Captive attention is thrust on you, as when you are at a movie theater or at work. Attention is Voluntary when you choose to give it, as in watching television.
The Four Quadrants. Through the use of different sizes and shading of shapes, the Attentionscape presents four dimensions of information in a 2 × 2 format. Although this makes the model complex, it rewards careful study. Mindfulness is on the vertical axis, Choice on the horizontal. The third dimension, Aversion versus Attractiveness, is illustrated by the shading of the circles. An issue is considered Aversion based when we are afraid of the consequences of not paying attention to it. Many health and disease issues might fall in this area. Attraction-based attention is given to those things that fascinate and please us. Attractiveness is indicated by the darkness of the circles—the darker the circle, the more attractive the subject is. Amount of attention, the fourth dimension, is communicated by the size of the circles. The framework is illustrated here with a hypothetical survey of executives at a single company:
Upper left: Front of Mind, Captive. The attention paid to clients, teamwork, and competitors is Captive. In this case, the Attentionscape reveals what may be a problem. As the size and shading of the circles indicate, employees appear to be paying more attention to competitors than to clients.
Lower left: Back of Mind, Captive. Issues such as leadership and teamwork are not usually given conscious attention by this group. Furthermore, the attention paid to teamwork is mildly aversive. It indicates this is an area where executives have to pay attention but probably don't want to. The company may need to adjust incentives if it wants to improve performance in these areas.
Lower right: Back of Mind, Voluntary. Some issues are highly attractive but may not be as pressing as captive issues. The danger here is that important, voluntary priorities may not get their share of attention without support and encouragement from the company.
Upper right: Front of Mind, Voluntary. In this case, innovation is highly attractive and receives voluntary and conscious attention. It may be that innovation is one of the firm's key values and that the need for attention is reinforced by company policy, compensation, and other factors. The attention paid to interpersonal issues may indicate unresolved issues among executives.
Method. The authors have created an Attentionscape software program to score survey respondents' answers to questions about attention. Here is a modified method that you can use to create a personal Attentionscape:
Step 1: Define. Create a list of items that occupied your attention in the past day. Include both work and home.
Step 2: Diagnose. Qualify the type of attention that is paid to each item. Determine where it falls between Front of Mind or Back of Mind, Captive or Voluntary, and Aversive or Attractive.
Step 3: Quantify. Rank the degree and amount of attention each item receives from 1 to 5, with 5 being the highest score.
Step 4: Score. Place each item on the matrix, using larger circles for items that received the most attention and darker colors for those that are most attractive.
Step 5: Adjust. Consider the implications of the analysis, and identify desirable changes.
Davenport, T. H., and Beck, J. C. The Attention Economy: Understanding the New Currency of Business. Boston: Harvard Business School Press, 2002.
No company should ever take for granted the idea that managing customers for loyalty is the same as managing them for profits. The only way to strengthen the link between profits and loyalty is to manage both at the same time.
The assumption that loyal customers are good customers is worth questioning. This advice is the result of the authors' study of the relationship between customer loyalty and profits. They investigated three common beliefs about loyal customers: (1) it costs less to serve loyal customers, (2) loyal customers are willing to pay more for bundled services, and (3) loyal customers provide good word-of-mouth marketing—they evangelize.
Reinartz and Kumar found that the link between loyalty and profit was often tenuous at best. In studies of four industries (grocery, mail order sales, brokerage, and corporate service providers), they found that 15 to 20 percent of a company's typical customers fall into the categories of loyal and unprofitable or highly profitable but not loyal. Their conclusion was that companies spend too much money managing relationships and marketing to customers who are not worth the investment. Figure 6.31 graphically illustrates the relationship between these two factors and the four possible outcomes.
The matrix explores two key dimensions: Customer Profitability and Customer Relationship:
Customer Profitability. Individual Customer Profitability depends on the frequency and quality of their purchasing, as well as the costs of selling to and servicing them.
Customer Relationship. Long-term customers are those who make frequent purchases over a period of one or two years.
The Four Quadrants. The matrix helps to identify four types of customers based on their profitability and purchasing patterns:
Upper left: Butterflies. These are customers who are profitable but disloyal. In some industries, such as brokerage, it is common for large customers to shop around, spreading large deals among several firms. Businesses naturally want to invest time in reselling to profitable customers but not to butterflies, which is a waste of money.
Lower left: Strangers. Strangers are customers who appear one time and are gone. From a customer relationship management standpoint, the best thing to do is invest as little as possible in strangers.
Lower right: Barnacles. Barnacles are customers who continue to order but do not order enough of the right things frequently enough to be profitable. In a retail or Web environment, these may be customers who shop only during sales; in business, they may be customers who require a lot of attention but purchase only the least profitable offerings. The challenge with Barnacles is figuring out how to get them to buy more, more often, or cut them loose.
Upper right: True Friends. The best customers are defined as those who buy a lot from you and are repeat customers. In addition, they display attitudinal loyalty: they provide testimonials to your firm, opt in to your e-mail offerings, and identify your business positively on surveys. True friends respond well to gentle treatment. Hard selling and too much attention can turn off even good customers, according to research.

Method. Analysis depends on your ability to measure customer profitability and loyalty. Profitability is driven by many factors, including the costs of informing, transacting, supplying, and servicing customers. Reinhart and Kumar are skeptical of approaches that emphasize recency and total revenue in analyzing customers, because too many Butterflies and Barnacles are included. They have developed a method based on event history modeling that looks at the period of time over which a customer has made purchases and the frequency of those purchases. A simplified version of this method provides a sense of how it might be used:
Step 1: Define profitability. Establish measures and methods for tracking account profitability.
Step 2: Assess loyalty. Sample existing customer data in order to come up with a rough formulation of the percentage of your customers who fall into the Butterfly, Barnacle, Stranger, and True Friends categories.
Step 3: Eliminate unnecessary expense. Determine in a general way how much you spend on unnecessary services for all quadrants. Are you making expensive sales calls on Barnacles that will never generate enough profit to cover the costs? Are you sending gifts to Butterflies whose activity pattern makes it clear they will never return? Are you inundating True Friends with too many catalogue mailings? Generate a list of ways you are expending money and time needlessly.
Step 4: Plan. Select three customer retention expense areas to investigate further for change or elimination.
Reinartz, W., and Kumar, V. "The Mismanaging of Customer Loyalty." Harvard Business Review, July 2002.
A strong brand brings reassurance to customers by providing a perception of permanence and quality.
Companies are wise to invest in establishing solid, trusted, highly recognizable brands. On occasion, the company itself assumes brand-like characteristics, where customers associate positive attributes to any products they introduce. Companies benefiting from this effect include IBM, Procter & Gamble, and Cisco Systems, to name a few. A company that is not well known and trusted faces a tougher marketing challenge, and this should be factored into plans. Simon Majaro frames the branding and competitive marketing task as a mix of company recognition and the uniqueness of the offering (Figure 6.32).
The Two Dimensions and Their Extremes. The Likelihood to Buy matrix explores two key dimensions: Supplying Company reputation and Product uniqueness:
Supplying Company reputation. Supplier companies vary in the extent to which they are well known and trusted.
Product uniqueness. Products can offer unique features that differentiate them, or they can be common and widely available.
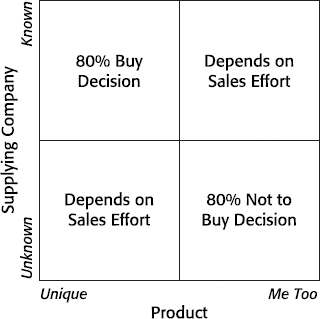
The Four Quadrants. The combination of the two factors contained in the matrix determines the likelihood of customers to buy and the investment that will be needed in marketing and sales:
Upper left: Known and Unique. This is the most powerful combination of factors, making it easy for customers to decide to buy. Assuming that the product is well designed to meet a need, it is likely to be a hit.
Lower left: Unknown and Unique. The product is well differentiated, but the customer is left needing to work out whether he or she trusts the supplier. Marketing and sales efforts are needed to bridge the gulf.
Lower right: Unknown and Me Too. This is the weakest combination of factors, making it highly unlikely that customers will decide to buy. Realizing this early in the process can save a lot of heartache and investment.
Upper right: Known and Me Too. The supplier is well known and trusted, but there is little to differentiate and recommend the product to buyers. This is not always an insurmountable problem; it depends on such factors as price, the degree of competition, and the amount of risk customers associate with the product experience in question. Once again, investment in marketing and sales is required.
Method. Companies can apply this framework in developing the strategic marketing plan for a product or line of business:
Step 1: Define. Describe the product, and define the target market.
Step 2: Diagnose. Locate the product on the Likelihood to Buy matrix.
Step 3: Evaluate. Assess the implications of step 2 for the product strategy.
What business risks do we face? How grave are these? How much is the opportunity worth to us? Will we be able to pull it off?
Risk represents the distance between vision and viability. No business decision is more central than the calculation of risk. Risk is never eliminated, but it is mitigated by careful assembly of all the critical elements: a powerful and timely idea, a plan, funding, and the competencies to execute the plan.
Risk is ultimately about making the right trade-offs. Many goals are attainable, but at what cost? The frameworks in this section present a range of ways to determine whether to proceed with a plan.
Profitability is an extraordinarily complex phenomenon. Without a clear understanding of how profit happens and how businesses must be designed to capture it, there will not be any profit.
Businesses need to be profitable if they are to survive. At its simplest, profit is what returns to owners and shareholders after all expenses have been paid, or total revenues minus total costs. The precise definition and measurement of these factors is a subject of great concern to economists and accountants, sometimes leading to confusion, financial crisis, and even scandal.
Arguably, there is no more basic and central business question: Are we trying to increase sales as is reflected in revenues, or do we want to make a profit? By lowering price and increasing marketing, we can boost sales and the business. Or we can raise prices, improving our profit margin per unit, and risk a reduction in overall revenues. The resolution of this dynamic tension resides in the goals and assumptions that underlie the business.
Through most of the twentieth century, growth and profitability were treated as synonymous. Companies were encouraged to win market share, culminating in the type of thinking reflected in the now famous GE strategy of withdrawing from markets where it could not be among the top two or three players. The drive to grow at any cost became more intense through the 1990s as companies competed for dominant positions in the Internet economy where network effects added even more advantage to the traditional economies of scale available to larger companies.
In their book The Profit Zone, Adrian Slywotzky and David Morrison describe how market share ceased to ensure profitability in the mid-1980s. New technologies, global production and market contexts, and more informed and proactive consumers were altering the nature of competition and profit. Profit was increasingly tied to customer value, which was becoming harder to predict and control. Companies needed to build profitability directly into their business models. Growth and market dominance were no longer sufficient; DEC, GM, Kodak, and a host of other companies saw their profitability erode even as they maintained a number one or two position in their industries.
As profit zones shift, companies need to ask themselves, Where will I be allowed to make a profit? and What unique value do we deliver? Slywotzky and Morrison present twenty-two profit models, drawing on the practices of profitability masters like Andy Grove at Intel, Robert Goizueta at Coke, and Nicolas Hayek at Swatch. These leaders focus simultaneously on the customer and on profit. They constantly ask where the profit zone is today and where it will be tomorrow. Their companies accurately identified the shift out of the product era to a market constructed around customers and profit and modified their businesses to avoid being mired in no-profit zones.
The modeling of Revenue and Profit in Figure 6.33 is our own summary of key ideas, offering a starting point to a fuller consideration of the planned pursuit of profitability.[75] For a detailed exploration of profit modeling, we recommend reading The Profit Zone.
The Two Dimensions and Their Extremes. Businesses have two primary measures of financial performance: top-line revenues and bottom-line profits. Application of the terms varies, and there is considerable debate as to the most valid and useful form of measurement and reporting. Purpose, strategy, and law influence whether EBITDA (earnings before interest, taxes, depreciation and amortization), free cash, or retained earnings is the profit measure of choice in a given situation. The financial manipulations and irregularities leading to the demise of companies like Enron and Arthur Andersen in 2002 tested the elasticity of permissible practices and definitions, pointing to a need for standards and oversight.

Revenue. Revenue is the total amount of money paid to a company for products and services delivered to the market. Revenue is reflective of market acceptance and appreciation for what a company offers.
Profit. Profit is the money that a company earns after all costs are paid out. Profit is reflective of the amount of added value created, as well as a measure of discipline and efficiency in operations.
The Four Quadrants. The relationship between Revenues and Profitability can be viewed from three useful perspectives:
Life cycle. Businesses progress through a predictable series of developmental phases. They begin in the lower left quadrant as start-ups requiring investment and then proceed to a marketing phase (upper left), where sales increase ahead of profit. Following this, depending on conditions and the nature of the business, they advance to either the upper or lower right quadrants as they mature and become profitable. The cycle ends with a return to the left side of the matrix as the business wanes.
Portfolio. In multibusiness companies, there is a need for offerings at different stages of maturity and profitability. While profitable lines are essential, it is equally important to invest in future capabilities. And some parts of a business may themselves be unprofitable while being essential for the success of other parts of the enterprise. Each quadrant is legitimate, and planners need to consider current and future needs carefully.
Performance status. The Revenue and Profitability of a business is or is not acceptable. Performance targets should be set at the beginning of a period and monitored.
The Revenue and Profitability matrix describes four primary types of relationship between the two dimensions:
Upper left: Growth. High revenues do not always equate with profitability, no matter which measure is applied. In the 1990s, AOL and many high-tech firms reported major bottom-line losses while maintaining top-line growth. Price wars led to unsustainable margins over the long run. The old joke of "losing on each item but making it up in volume" is increasingly suspect. For several years, GM reported losing over $100 per car just to maintain market share.
Nevertheless, this can be a legitimate component of a larger integrated competitive strategy. Maintaining a strong market brand in consumer goods often demands living with high-volume sales at low margin. In this way, the product can dominate its category. Consider Coke. When it is purchased in the grocery store, price and margin are low. By maintaining high brand value, the company is able to charge a higher price for alternative channels such as vending machines, raising overall profit.
Lower left: Investment. Low revenues and profits typify start-up and R&D initiatives. Investment is geared to developing future capability. This is the positive view. It also describes unhealthy businesses unable to gain meaningful sales traction. Any business falling into this quadrant should be there by design, with a plausible plan for adding value within a reasonable time frame.
Lower right: Boutique. Not all businesses need to grow larger to be successful. This approach is consistent with what Michael Porter calls the focused differentiation strategy.[76] In addition, certain value propositions depend on scarcity (of a skill, material, or experience) for a good amount of their profit. Take as examples clothing design and high-end vacation packages. Boutique profit models often depend on relatively rare resources, creating natural barriers to entry by competitors.
Upper right: Maturity. The most profitable businesses are able to increase their top and bottom lines, expanding scale while preserving margin. Established brands like Coke and Shell have achieved this, as have global powerhouses like GE and Procter & Gamble. Managing High Revenue–High Profit businesses is a balancing act demanding discipline and agility. As soon as a large profit zone is established, it becomes a target. The biggest danger for these companies is becoming complacent as value migrates away from them. This can happen to entire industry ecosystems, as it has recently with recorded music and long-distance telephony.
Example: Three Paths: General Electric, Apple Computers, and Intel. Three well-known company histories illustrate the explanatory power of the Revenue and Profitability matrix. Each of these companies has faced challenges and achieved success by pursuing profitability in its own way (Figure 6.34):
General Electric. When Jack Welch took the helm in 1981, GE was a large manufacturing firm with a market value of $13 billion. When he left in 2001, the company was a diversified global solutions provider worth $125.9 billion. Welch inherited leadership of a company in the upper left quadrant: High Revenues and Low Profitability. Through a series of interventions, the company refocused on high-value areas and improved efficiency. First was Welch's "Be No. 1 or No. 2 or Get Out" strategy. Over a two-year period, the company learned to be self-critical about the businesses most worth being in. Second was the Work-Out program, doubling the organization's rate of productivity. With a keen focus on customers and profitability, Welch moved GE into the upper right quadrant.
Intel. Intel was founded in 1968 to build semiconductor memory products. By the late 1970s, it was a world leader in the manufacture of DRAMS (dynamic random access memory chips), and the market was growing fast. By the mid-1980s, an inflated U.S. dollar and high-quality, low-cost Japanese competition took the profit out of the business, and by 1985 Intel was losing money. This part of the business had slipped from the upper right quadrant to the upper left.
In 1971, Intel had introduced the world's first microprocessor. Intel executives Andy Grove and Gordon Moore made the tough decision to exit from the memory chip business and place all resources behind microprocessors. A pattern of extensive investment in R&D and passionate customer service has taken Intel from the lower left to the upper right quadrant several times. The pattern continues to this day, with 2002 investment in R&D being over $4 billion, representing 15 percent of net revenues. Projected R&D spending in 2004 is $4.8 billion.
Apple Computers. From its earliest days, Apple has been a leader in user-friendly, innovative design. Created by Steve Wozniak and Steve Jobs in 1976 and inspired by the playful, user-oriented science of Xerox's PARC, the company has released a series of well-loved products, perhaps best epitomized by the Macintosh 128.

Rather than take the Apple operating system and graphical user interface public, Apple chose to restrict use to its own products, and it enjoyed many profitable years (the lower right quadrant). The decision differentiated Apple computers from the more clunky PC types, drawing a devoted following of designers and students. But the decision not to pursue a more open licensing strategy has been questioned by many over the years, as the bulk of the computing world has moved to standardize around the Microsoft and Intel platform.
Context. Modeling of Revenue and Profit is relevant for both steady-state and new business planning. It is useful at the start of business cycles for forecasting capital needs and expectation setting and at the end of cycles to evaluate success. As a portfolio planning aid, the framework is helpful in ensuring there are adequate initiatives in each of the target quadrants.
Method. The focus of this matrix is on profitability, providing a mechanism to make goals and critical factors more explicit. As a result, performance monitoring, intervention, and decision making become easier. Two primary applications are outlined below.
Here are the steps for profitability tracking in a single business:
Step 1: At the start of a business cycle, forecast target revenue and profitability. Locate this point on the matrix.
Step 2: Identify several other possible scenarios, comprising different combinations of revenue and profit. Describe factors that might lead to these outcomes. Are there steps that can be taken to prevent the more negative scenarios?
Step 3: Monitor progress on a quarterly or monthly basis to measure success. Implement corrective actions if results are unacceptable.
These are the steps for portfolio modeling:
Step 1: Define. Place each of the businesses on the matrix, positioning them in the appropriate quadrant.
Step 2: Diagnose. Stepping back from the matrix, reflect on the current mix, considering such factors as overall balance, profitability and return on capital, diversity, interdependencies, competency development, and investment in new, future sources of profit.
Step 3: Envision. Adjust the mix to reflect a strong current and future set of businesses.
Step 4: Follow up. Monitor to ensure that the businesses perform as planned and continue to represent the values ascribed to them.
Slywotzky, A., and Morrison, D. The Profit Zone: How Strategic Business Design Will Lead You to Tomorrow's Profit. New York: Times Business, 1997.
The framework is simple on the surface, but has a lot of hidden depth. It's when you get into the depth that you discover both its power and flexibility.
Mention "2 × 2 matrix" to someone in a business context, and more often than not, that person will think of the BCG Grid. The names of the four quadrants—Dogs, Stars, Problem Children, and Cash Cows—have become standard popular terms and a convenient shorthand in strategic discussions. What has made the framework so powerful and enduring is its amazing breadth; not only is it a method for structuring strategic priority-setting discussions, it also represents a business typology, making it possible for planners to think about a portfolio of holdings from an investment perspective.
BCG founder Bruce Hendersen created the Product Portfolio matrix (Figure 6.35) in the early 1970s to assist conglomerate organizations to analyze the relative worth of their different business units, subsidiaries, and products. Not only did it help to establish BCG as a leader in the strategy consulting domain, it played an important role in defining and legitimizing strategy as a management discipline practiced by professionals and consultants.

The Two Dimensions and Their Extremes. The framework combines quantitative and intuitive features to produce an accurate and consensual picture of the investment worthiness of different business holdings. Each business unit is assessed with respect to its market (Market Growth) and then compared to the other business units owned by the conglomerate firm (Relative Market Share). Relative Market Share and Market Growth form the basis for analysis:
Market Growth. Market Growth serves as a proxy for cash requirement. A market that is expanding rapidly requires more investment to maintain a competitive position.
Relative Market Share. Relative Market Share is a proxy for cost competitiveness and is derived from an essential BCG concept, the Experience Curve, which calculates the costs of production as a function of learning and size. Relative Market Share is determined by dividing the percentage of market held by a firm by the percentage held by its largest competitor.
The Four Quadrants. The portfolio approach brings rationality to the business investment process. Business units and markets proceed through a predictable cycle of maturation, which needs to be factored into decision making:
Upper left: Stars. These are the high fliers—businesses with a high relative market share in a growing market. However, they still require investment to maintain market share, so they might not be as profitable as Cash Cows. They might even need more investment than they return in profit (resulting in a short-term net loss). But these will be tomorrow's Cash Cows providing market share is maintained.
Lower left: Cash Cows. The darling of the aging executive and owner alike, these businesses have high market share in a market with low growth. Maintaining current operations becomes the main cash requirements for this mature business. Like a great wine or cheese, it has cellared sufficiently and is ready to be harvested for profits as cash flow remains positive.
Lower right: Dogs. Dogs are businesses with low market share in low-growth markets. The market may or may not be in decline. Despite the temptation to divest, dogs can have significant advantages, depending on market conditions. For example, the market might be positioned to grow, redefining potential worth. Or the business might be cash flow positive and capable of being restructured to maintain positive cash flow for a significant length of time. The business might also have significant strategic or brand importance, meriting retention to fend off competitors as a "guard dog."
Upper right: Question Marks (or Problem Children). These businesses compete in high-growth markets, but they have a relatively low market share and may need significant investment to improve their position. Consultants tend to like clients who own a few of these (and the pockets to pay fees), as careful analysis is needed to determine if it is best to invest more, sell the business, or reposition to focus on a specific market niche (among other options).
Example: Dow versus Monsanto. "In the 1960s and early 1970s," write George Stalk and Thomas Hout, "a classic portfolio battle was waged by Dow Chemical against Monsanto. In this battle, Dow actively managed its portfolio for advantage, and Monsanto did not."[78]
Firms that reinvest based on profitability alone risk overspending on mature business lines while under-funding those in early stages of growth. It was not uncommon in the 1960s, however, for large multi-business companies to approach the market with a profit center orientation that did exactly this. Companies like GE and Westinghouse were leading practitioners of the strategy, promoting business unit accountability and rewarding financial results with independence and growth capital. During this period, Dow approached the market with the portfolio strategy reflected by the BCG Grid, while rival Monsanto pursued the prevailing profit center approach (Figure 6.36).
Monsanto began the period with the stronger portfolio. Seven of its businesses were facing growth in demand greater than 20 percent, as compared with Dow, which had only two businesses in this position. Following a course of reinvesting based principally on proven success and profitability, Monsanto overlooked emerging trends and opportunities. Of fourteen businesses growing at an annual rate of 15 percent or greater, it expanded only three of those businesses faster than demand. It lost ground to competitors in eleven of fourteen growing areas. Dow, in contrast, pursued strategic growth in the portfolio-based manner, investing boldly according to plan. Of the twenty-three growing businesses in its portfolio, twenty of them were expanding faster than demand. Confident in its business direction, Dow borrowed to grow, secure in the belief that well-planned debt constituted less risk than underinvestment. Dow's debt-to-equity ratio stood at 1.1:1 as compared with the much smaller 0.46:1 ratio at Monsanto.

Through this period, Dow's business grew steadily, while Monsanto's stagnated. In portfolio management terms, Monsanto overspent on nongrowth businesses and failed to invest in launching a robust set of new Stars for future profitability. It wasn't until 1981 and the efforts of CEO Dick Mahoney that Monsanto tackled its portfolio imbalances, leading the company back to a path of strategic growth and more respectable returns on equity.
Context. The BCG matrix is used for analysis and to support strategic decision making. Because of the need for data-based calculations to map the locations of each business onto the 2 × 2 grid, it is seldom used during workshops for brainstorming new ideas and concepts. This is a persuasive tool that can be used to gain group consensus around the findings of an analysis.
Method. The following steps provide a high-level blueprint for conducting Product-Portfolio analysis:
Step 1: Set the scope. Determine the unit of analysis by deciding whether business units, subsidiaries, product categories, or products are to be analyzed.
Step 2: Define the portfolio. Collect the list of businesses held by the company in question for the agreed-upon units of analysis.
Step 3: Calculate revenues. For each business within the list, gather the following pieces of information:
Sales (revenue) numbers for the current year and for the past several years (two years minimum).
For every competitor being analyzed, calculate sales (revenue) numbers for the current year and for the past several years (two years minimum).
Step 4: Calculate Market Growth and Relative Market Share. Find or calculate the Market Growth rates for each business being analyzed: This year's industry revenues - Last year's industry revenues/Last year's industry revenues × 100 percent. Calculate the Relative Market Share by dividing the firm's (or business unit's) market share (revenues may be compared) by that of its largest rival.
Step 5: Complete the grid. Plot each item on the grid based on the calculated values for Market Share and Market Growth, and analyze the results.
Stalk, G. Jr., and Hout, T. M. Competing Against Time. New York: Free Press, 1990.
Stern, C. W., and Stalk, G. Jr. Perspectives on Strategy. New York: Wiley, 1998.
The quest for certainty blocks the search for meaning. Uncertainty is the very condition to impel man to unfold his powers.
For the past thirty years, the Impact-Uncertainty matrix (Figure 6.37) has been one of SRI Consulting Business Intelligence's (SRIC-BI) most widely used and effective tools for analyzing the external environment. It is applied in scenario planning, strategy management, issues scanning, and technology planning. The tool's key benefit is that it focuses management's attention on the most important external issues that drive future threats and opportunities.
An Impact-Uncertainty exercise begins by focusing on corporate decisions that may be greatly affected by changes in the external environment. These external forces can include a wide range of shifts and trends in areas such as industry demand and supply, demographics, the natural environment, social attitudes, business practices, and technological innovation. Specific external forces or drivers are identified that could influence the decisions in question. The potential impact of each issue on future threats and opportunities for the organization is assessed, and then the uncertainty of future outcomes for the issue is described.
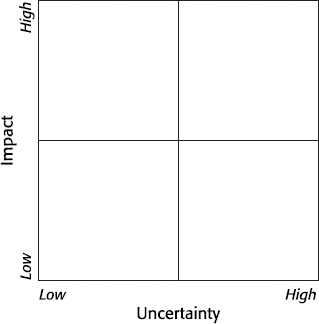
The Two Dimensions and Their Extremes. The Impact-Uncertainty matrix explores two key dimensions: Impact and Uncertainty:
Impact. External factors range from high to low in their likely impact on the success of a decision.
Uncertainty. External factors vary to the extent that their occurrence and outcome are predictable, ranging from high to low.
The Four Quadrants. The Impact-Uncertainty matrix quickly sorts factors according to their relative priority:
Upper left: High Impact, Low Uncertainty. Sometimes trends warn you of things that will happen with a high degree of certainty. Demographic changes, for example, can have a huge impact on strategic decisions, and companies can plan for them years in advance. Identifying these highly probable, high-impact factors is basic to planning, and the impact of items in this quadrant must be factored into current plans.
Lower left: Low Impact, Low Uncertainty. External factors that fall into this quadrant are relatively unimportant. We know what their outcomes will be, and their impact is minimal. These items should receive a low level of attention.
Lower right: High Uncertainty, Low Impact. Things that fall into this quadrant are not worth too much executive focus; they tend to be long term and relatively unimportant to the decisions at hand. Over time, these peripheral issues should be monitored because they could move into other quadrants.
Upper right: High Impact, High Uncertainty. Our greatest concern is with the forces and decisions that fall into the high impact–high uncertainty category. These are the forces for which you should delay decisions as much as possible in order to get better future information. These are also the issues that will form the basis for full-blown scenario analysis.
Example: Petrochemical Industry. Representatives from three oil and petrochemical companies and three consulting firms were brought together by SRIC-BI consultants to identify and discuss issues that affect the future of the world's energy business.[80] High-level results of the discussion on global warming are displayed in Figure 6.38.

Subsequent discussion by the participants highlighted a series of key interlocking issues to monitor in the future, including these:
Taxes: Governments are torn between their desire to preserve oil-based tax revenue and the need to respond to public pressures on environmental and supply issues. Government policy will drive investment in new technologies.
Technology: Uncertainty around climate change and taxes creates uncertainty regarding alternative energy investments and where future competitors will come from.
Temperature: The timing and goals of government policy and investments will modify as perceptions of temperature change evolves. Potential new technologies could greatly extend the use of fossil fuels or have just the opposite effect, allowing competing or new sources of energy to eliminate the need for oil altogether.
Context. Impact and Uncertainty are relevant to any strategy development, technology planning, or issues management exercise. This framework is ideal for determining which issues to pay attention to and identifying strategic actions.
Method. The following process is suggested for assessing the values of the issues and placing them on the matrix:
Step 1: Focus. Select an important strategic decision to examine.
Step 2: Scan. Identify the full set of external issues and forces that could have an impact on the decision's success.
Step 3: Assess the impact. Estimate the future impact of each issue on the decision's success or failure.
Step 4: Assess likelihood. Decide what the degree of uncertainty is or how well future outcomes can be predicted. (It's important to make the step 3 and step 4 assessments in this order.)
Step 5: Score. Based on assessments in steps 3 and 4, place the issues on the matrix. Direct most attention to the items on the top half of the matrix. The High Impact, Low Uncertainty issues are considered predetermined, and decisions must work under the expected outcomes. The High Impact, High Uncertainty issues represent the forces that will drive future threats and opportunities for the organization.
And all the men and women merely players.
They have their exits and their entrances.
Often in life, victory belongs not to those who are best at the game, but rather to those who know when to play and when to walk away. Baseball coaches face this classic dilemma many times over with pitchers. Should a fading hurler be pulled even if he is only three strikes away from the end of the game? Should a defensive player be put in the field in the late innings of a big game in order to protect a lead? The coach needs to make these choices based primarily on the abilities of the players, but sometimes other factors are more important, like the match of pitcher to batter or the momentary need for a shake-up. A gambler walks into a casino and has a choice: play an empty table or a hot one. When she is up several thousand dollars, is it time to walk away or play another hand? Making money on the stock market is as much about selling at the right time as it is choosing sound investments.
The Entrance and Exit Strategies framework (Figure 6.39) helps managers confront entrance and exit options in a planned and informed way. It quickly reveals the capabilities and culture of the organization in relation to the competitive landscape of an industry and helps to identify hurdles the strategy must overcome.

The Two Dimensions and Their Extremes. The Entrance and Exit Strategies matrix explores two key dimensions: Entrance Strategy and Exit Strategy:[82]
Entrance Strategy. One can join a market in either the Start-Up phase, when demand is primarily from early adopters, or during the later Rapid Growth phase, after initial risk is removed.
Exit Strategy. Ultimately, the choice is whether to leave the game when the market is maturing and attracting big competitors, or at some later date. Each departure point has its unique benefits and requirements.
The Four Quadrants. Companies need to choose a strategy that complements their natural strengths and avoid adopting a strategy better suited to a different sort of competitor:
Upper left: Follow and Fade. These firms attempt to jump in and control the industry but are beaten by the competition and forced to leave early. In most cases, they fail to recover their investment.
Lower left: Invent. These are visionaries who enter markets early, striving to prove the value of their offerings and establish customer demand. With their goal achieved and profit margins narrowing with the entrance of major players, these companies exit to develop their next idea. Venture-oriented private firms often fall into this quadrant.
Lower right: Invent and Lead. These innovators hope to establish and dominate a niche throughout an entire product life cycle. To succeed, they need to restructure business processes and develop operating competencies such as commodity production and selling. The redirection is often difficult; these companies struggle to maintain their entrepreneurial cultures and ability to invent.
Upper right: Follow and Compete. These large firms have capital and the desire to extend their brand into the given product category or industry. They wait until the product stabilizes and the market is predictable, and then they bring a quality offering to market at a highly competitive price. With core competencies in production, advertising, and customer service, they aim to own the market.
Method. Follow these steps to conduct a high-level Entrance and Exit Strategy analysis:
Step 1: Define. Identify the market you are considering entering.
Step 2: Assess. Determine your entrance and exit approach and those of all competitors you expect to face over a two- to five-year period. Place them on the matrix.
Step 3: Design. Integrate the impact of competing entrance and exit strategies into your strategic and financial plans. Create a high-level mitigation plan for those who will compete directly in your quadrant.