Good to Great Matrix of Creative Discipline
Employee Motivation
Alliance Drivers
Team Types
Leadership and Culture Frameworks
Situational Leadership
The Four Power Players in Knowledge Organizations
T-Group Leadership
Learning and Change Frameworks
SECI
Human Capital
Differentiation and Integration
Means and Ends
The Change Grid
Learning and Change
Similarities and Differences
The Four Realms of Experience
Make versus Buy
Four Square Model
Product and Supply Chain Architecture
Telematics Framework
The Virtue Matrix
The prime organizational challenge has shifted from efficiency to agility (Figure 7.1). It's not that efficient operations are no longer important; they simply are not enough, and businesses are building structures and processes that ensure rapid sense-and-response ability.
To maintain pace with dynamic external environments, firms are flattening their vertical structures, empowering front-line staff, and forming external partnerships that provide access to necessary but noncore capabilities. With each move in this direction, some formal power is forfeited. Control is being replaced with knowledge as firms tap the resources of three critical constituencies: employees, strategic partners, and customers. Business leadership today consists of directing and aligning the efforts, creativity, and goodwill of numerous disparate parties without the luxury of formal authority to set goals and enforce compliance.
Note
The Archetypal Organizational Dilemma
Core Question: How can our organization be more effective?
Key Issues: Design and management of structure, jobs, and processes

The modern business organization was born during the industrial revolution in the processing and manufacturing industries of England, Europe, and the United States. Masses of people migrated from rural farming communities to work in the new factories, using processes that were tightly defined and left little room for creativity or initiative.
Built to leverage the power of machine technology, early organizational models were mechanistic and rational, the primary goal being to maintain efficient and reliable operations. It was all about the machine and the assembly line, finding economies of scale through technical design and efficient management.
The human relations school of organizational management grew in reaction to the impersonal and often exploitative aspects of the scientific approach. Supported by parallel developments in individual and social psychology, proponents focused on human potential, feelings, and job designs that led to work that was fulfilling as well as efficient. Work innovations like GE's Hawthorne experiment, MacGregor's Theory X and Y, and Frederick Herzberg's Job Enrichment demonstrated that happy, engaged workers were more productive: treat someone like a gear, and the person will think like one; treat her with respect, and she will seize the opportunity to perform responsibly and professionally.
In dialectical terms, a tension had set up between the two philosophies, which eventually gave rise to integrative approaches drawing on the best of both schools of thought. Socio-technical systems, like the original form of the corporation, first appeared in England, in the coal mines shortly after World War II. A blend of the two approaches, it captured the interest of two types of companies: those where social problems engendered by the technical-rational approach were creating motivational or labor problems, and progressive companies with visionary and adventurous leaders interested in establishing ideal, high-performance working conditions. Two well-known examples were GM's Saturn plants and Shell's redesign of its chemical processing facilities.
As in the case of strategy, traditional approaches to achieving organizational effectiveness are being challenged by the forces of complexity (faster, more dynamic contexts make agility a necessary core competency), technology (digital technologies enable better, cheaper work production, and communications make technology a core competency), and globalization (redefinition of the location of workers and available markets sets wider boundaries for firms).
The result of these factors is a reconceptualization of the firm, work, and day-to-day operating challenges. The contemporary self-organizing, complexity-managing, risk-mitigating, constantly learning business organization is different. Prime skills now include sensing the environment; recognizing and resolving dilemmas; creating and sharing knowledge; retaining, motivating, and training talented employees; and partnering with suppliers and customers.
This chapter explores a rich assortment of organizational frameworks in the following four categories:
Structure: The way we design jobs and business processes either helps or hinders effectiveness. These frameworks assist us to define and structure work in ways that improve performance.
Leadership and culture: Organizations are communities bound by shared values and rules. Some of these are formal; many are implicit. Leadership is provided by a variety of individuals, some drawing on formal authority and others calling on their ability to influence through expertise, seniority, or relationships.
Learning and change: Managing change may well be the new norm, however it remains a challenging and often painful process. Learning is viewed as a key enabler of healthy and successful change processes.
Process: Systems can be greatly improved by applying a process design orientation. We do this by treating each process step and transaction as modular components that may or may not be ideal or even necessary. Working with prescribed tools and principles, existing sequences can be upgraded and whole new steps created.

How do we organize work and people?
Organization design is meant to facilitate productivity through engineering individual and collaborative efforts. It would be hard enough to do this right if we all agreed on goals and design principles and if technologies and conditions didn't constantly change.
We sometimes overlook structural problems because structure is difficult to design and painful to change. At other times, we mistakenly turn to structure to fix interpersonal, process, or competitive problems. The frameworks in this chapter offer a variety of ways to approach the design of work and organizations sensitively, carefully, and creatively.
The question of "Why greatness" is almost a nonsense question. If you're engaged in work that you love and care about, for whatever reason, then the question needs no answer.
The Good to Great matrix (Figure 7.2) comes from the book of the same name by Jim Collins of Stanford University. Collins examined the financial performance of 1,435 Fortune 500 companies over three decades to find those capable of lifting their financial performance above the market and above the averages for their industry. His intent was to identify the special qualities that enabled organizations to ascend from sustained good performance to sustained great performance.

Collins's methodology included exhaustive secondary research, long-term financial analysis, and extensive interviews with company executives. One of his key findings was that good to great companies were successful on two cultural dimensions: Discipline (the ability to set goals and enforce accountability) and Entrepreneurialism (a culture of freedom, innovation, and risk taking). The tension between creativity and innovation, on the one hand, and discipline and financial control, on the other, is well known to CEOs. Synthesizing the two forces over the long term is surprisingly rare: only 11 of 1,435 companies were able to make it through Collins's research filter and qualify as good to great.
Most successful start-ups do not go on to become great companies. As a business becomes successful, it grows in complexity. In time, the characteristic easygoing informality of the start-up becomes a liability rather than an asset. Many firms flounder when it becomes necessary to impose tighter discipline on the organization. As professional managers replace the entrepreneurs who started the firm, the culture undergoes changes. If left unchecked, it becomes increasingly hierarchical, internally focused, and ultimately a place where creative innovators no longer want to be.
The Two Dimensions and Their Extremes. The Good to Great matrix explores two key dimensions: Culture of Discipline and Entrepreneurial Ethic:
Culture of Discipline. Firms with a Culture of Discipline excel at setting and achieving business goals. They institute mechanisms for planning, measuring, and changing course as needed, and have trained managers to use them.
Entrepreneurial Ethic. Entrepreneurial Ethic means that a firm has maintained a start-up kind of enthusiasm for customers and products. These organizations encourage innovative thinking and reward action over analysis.
The Four Quadrants. Firms may start out as Entrepreneurial ventures; however, Discipline is eventually needed to sustain operational effectiveness. Collins describes four outcomes of the trade-offs between these two factors:
Upper left: Hierarchical Organization. The hierarchical firm is effective at setting goals and managing to meet objectives. However, it has become focused on the wrong attribute at the core of the organization. In the Good to Great view of the world, discipline is a means to enabling more innovation and creativity, not an end in itself. In Hierarchical Organizations, leaders overvalue order and control, and drive innovative rule breakers out of the firm.
Lower left: Bureaucratic Organization. In the Bureaucratic Organization, goals are set but not met. Accountability is diffuse. Failure may not be rewarded, but it is tolerated. Many firms develop this type of culture at some point in their life cycle. For a recent example, consider the national telephone companies prior to privatization.
Lower right: Start-Up Organization. In the start-up phase, firms depend almost solely on innovation for success. Entrepreneurial activity is rewarded, and risk takers who succeed become stars. The few start-ups that become great firms build on their innovations to create methods for repeating that success and nurturing freedom in the firm.
Upper right: Greatness Organization. Great organizations build a culture of freedom and innovation, and then introduce enough discipline to ensure cooperation without creating unnecessary bureaucracy. Their cultures are inclusive and forgiving—employees have no fear of bringing bad, but realistic news to executives—and open to innovation.
Example: Kroger and A&P. In 1950, A&P was the world's largest retailer, and Kroger was a midsized competitor.[84] Around 1970, Kroger research determined that market demand was shifting. Customers wanted superstores: well-lit, clean outlets with lots of services and much wider selection than traditional grocery stores. Through the 1970s, Kroger remade the company in response to changing customer demand (Figure 7.3).
Up to that point, both A&P and Kroger tended to have older, smaller stores in slow-growing parts of the country. Kroger rebuilt itself from the ground up, store by store, going so far as to pull out of regions where its new superstores were unlikely to succeed.

In contrast, A&P stayed mired in the past. The CEO conducted himself as if he were the caretaker representative of the founders, often wondering, "What would Mr. Hartford [the founder of A&P] do?" in response to strategic questions. Attempts to change the existing supermarket model were regularly shot down, and promising new store experiments were nixed. It is no wonder that customers increasingly overlooked its stores. As sales fell, the company engaged in ruinous price wars, which sucked up profits that could have been used to improve stores, as competitors were doing. Over three decades, the once-great Atlantic & Pacific Company fell apart, as Kroger's stock outperformed it eighty times over. In 1999, Kroger became the nation's largest grocery chain.
Context. The Good to Great matrix invites sobering comparisons between a firm and its competitors on two vital dimensions. And, it poses a question: Is your firm settling for merely being good when it could be great?
Method. Follow the steps below to conduct a high-level analysis of your organization's adequacy regarding discipline and entrepreneurialism:
Step 1: Assess the culture of discipline. Rank yourself and three competitors (from highest to lowest) in terms of discipline. How consistent are the firms at hitting their financial performance targets? Are employees focused on internal politics or on listening to the market and customers? Are processes in place to manage and track performance properly?
Step 2: Assess entrepreneurialism. Rank yourself and competitors in terms of entrepreneurialism. Ask the following questions: Are new ideas encouraged? Is failure tolerated within the culture as long as people take responsibility for their actions? Is the organization making strategic moves that indicate a keen sense of how the industry is changing and evolving? Is it an innovation leader within its field?
Step 3: Determine your current state. Using what you have learned, place your firm and competitors on the matrix.
Step 4: Create an improvement plan. Consider implications of the current state, and identify areas needing improvement.
If only a small percentage of the time and money that is now devoted to hygiene, however, were given to job enrichment efforts, the return in human satisfaction and economic gain would be one of the largest dividends that industry and society have reaped through their efforts at better personnel management.
If we remove the dissatisfaction from a job, we do not necessarily end up with a motivated employee.[86] Job satisfaction and dissatisfaction are not opposites; rather, they describe two different, and critical, aspects of work. Fulfilling, motivating work derives from the design of the work itself—Motivators—while dissatisfaction results from poor work conditions—Hygiene (Figure 7.4). Better lighting, for example, removes a problem but does not make a job more interesting or meaningful. This was the insight that Frederick Herzberg introduced in his 1966 book, Work and Nature of Man, and classic 1968 Harvard Business Review article, "One More Time: How Do You Motivate Employees?" Too often, efforts to motivate concentrate on Hygiene factors. Applying Herzberg's framework gave birth to the job enrichment movement of the 1970s and continues to influence current approaches to job design and high performance.
The Two Dimensions and Their Extremes. The Motivating Employees matrix explores two key dimensions: Motivators and Hygiene:

Motivators. These are factors that are intrinsic to the job, such as achievement, recognition, the work itself, responsibility, growth, and advancement.
Hygiene. These are factors that are extrinsic to the job, such as company policy, administration, supervision, interpersonal relationships, working conditions, status, salary, and security.
The Four Quadrants. The effective design of work recognizes the need to address both Motivator and Hygiene factors. Inattention to either one places a drag on overall job satisfaction and organizational performance effectiveness:
Upper left: Fulfilling But Frustrating. The work itself is interesting and worth doing; however, environmental conditions get in the way. People would do great work if only the barriers were removed.
Lower left: Total Job Dissatisfaction. Both the job and working conditions are poor. Performance effectiveness is low and motivation is highly unlikely without serious efforts at improvement.
Lower right: Comfortable But Unfulfilling. Working conditions are excellent, but the work lacks sufficient challenge or opportunity to achieve something meaningful. Employees could do great work if they wanted to, but they won't because they are not motivated.
Upper right: Total Job Satisfaction. The ideal situation exists when both Hygiene and Motivator factors are addressed. Employees feel good about the working environment, there are no unnecessary barriers to performance, and the work is highly motivating.
Method. Herzberg proposes a ten-step process for applying these ideas for job enrichment. The core of the approach is contained in three steps:
Step 1: Identify the target job.
Step 2: Conduct a Hygiene audit. Ask, "What is frustrating about this job?" Address key issues.
Step 3: Conduct a Motivator brainstorm session. Ask, "What would make the job a richer and more meaningful experience?" Consider the core Motivator factors: achievement, recognition, the work itself, responsibility, and growth or advancement.
Herzberg, F. Work and Nature of Man. New York: World Publishing Company, 1966.
Herzberg, F. "One More Time: How Do You Motivate Employees?" Harvard Business Review, Sept. Oct. 1987, pp. 53–62.
Herzberg, F., Mausner, B., and Snyderman, B. B. The Motivation to Work. New Brunswick, N.J.: Transaction Publishers, 1993.
The companies that are most successful with alliances have learned the importance of embedding the capability to create alliances in the corporate structure.
The Alliance Drivers matrix (Figure 7.5) is based on long-term research into more than five hundred major firms and six thousand strategic alliances. In their book Smart Alliances, Harbison and Pekar document how alliances have grown in importance as drivers of corporate revenue growth and as a source of strategic advantage. (They defined strategic alliances as partnerships among relatively equal firms that involve long-term commitments with shared resources, funding or equity.)
The research demonstrates that two factors, Globalization pressures and Capability Gaps, have played a major role in determining the need for corporate alliances in recent years. The degree to which these drivers are present varies greatly by industry. In some sectors, firms must establish a worldwide presence if they are to stay competitive. In others, the need to continually update and acquire new capabilities drives alliances. Although there is little direct tension between Globalization and Capability Gaps, the dialectical conflict is implicit and important. Alliances are inherently risky and involve complex issues of dependency and control.
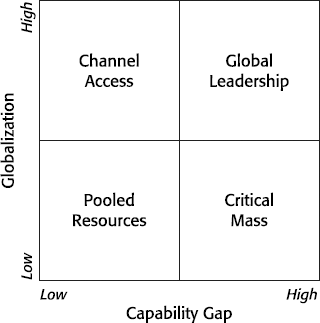
The Two Dimensions and Their Extremes. The Alliance Drivers matrix explores two key dimensions: Globalization and Capability Gap:
Globalization. Globalization refers to the pressure to establish an international presence and succeed in foreign markets. Industries with high levels of global consolidation (autos, telecommunications) fit this definition.
Capability Gap. Capability gaps arise when companies lack the skills, knowledge, or scale to meet fast-changing market demands. Increasingly, firms are turning to partners to fill those gaps.
The Four Quadrants. The degree to which Globalization and Capability Gap drive the need for an alliance defines four strategic approaches:
Upper left: Channel Access. Some foreign markets require a large retail and wholesale distribution network in order to compete effectively. In such cases, firms need to seek local partners with a significant footprint in their home territory.
Lower left: Pooled Resources. In industries such as steel, paper, and utilities, products have high weight-to-value ratio, creating transportation difficulties or other barriers that insulate firms against foreign competition. Companies in these businesses should ally in order to reduce risk and exploit economies of scale.
Lower right: Critical Mass. In industries such as health care and entertainment, firms find themselves facing new market demands as industry boundaries blur. They should consider partnering with firms outside their traditional business domain to build a critical mass of skills and audience. Such was the case with Microsoft and NBC, which coinvested to create MSNBC.
Upper right: Global Leadership. Firms in industries characterized by rapid technological innovation, like computers, telecom, and electronics, should seek partners that can fill in capability gaps that provide an immediate technological edge. The Sony-Ericsson partnership to produce mobile phones is one such alliance.
Method. Harbison and Pekar include a robust alliance planning method and a detailed matrix for analyzing alliance needs and opportunities. We suggest the following exercise as a way to initiate a review process:
Step 1: Scan. Make a list of recent or planned strategic alliances at your firm.
Step 2: Assess. List the technologies, capabilities, access to markets, and other assets you hope to acquire through strategic alliances. Check whether the drivers in Table 7.1 are present.
Step 3: Diagnose. Using the information you've gathered, plot your strategic alliances on the matrix. Consider the implications of the matrix. Are alliances addressing the globalization forces and capability gaps you face?
Harbison, J. R., and Pekar, P. Jr. Smart Alliances. San Francisco: Jossey-Bass, 1998.
Teams should be set up to elicit not the compliance of the workforce, but its commitment.
Collaboration is increasingly important in the knowledge era. Team effectiveness is a prime forum for collaboration and thus an important driver of high performance. Yet we tend to approach the vast assortment of work teams in the same way, rather than recognizing structural and contextual differences. Kimball Fisher has written extensively on the subject of teams and has helped many organizations to improve their team practices. The effort begins with getting clear about business and organizational requirements and the type of teams that are needed. Teams differ in their Duration and Scope. Each of the four team types resulting from this model has unique performance properties and development needs (Figure 7.6).
The Two Dimensions and Their Extremes. The Team Types matrix explores two key dimensions: Duration and Scope:
Duration. Teams are created to tackle a short-term need, or they are ongoing.
Scope. Teams perform within a single, defined area, or they are tasked with outputs that touch multiple operations.

The Four Quadrants. Team structure needs to align with task requirements and organizational values:
Upper left: Natural Work Teams. The most common types of teams are those formed around business functions and processes in organization, like the radiology department in a hospital or the R&D group in a midsized software company. These teams have ongoing responsibilities to deliver defined outputs.
Lower left: Small Project Teams. Temporary teams are created within business units to solve a specific problem or assist in the design of new methods. Examples include resolving equipment problems and scheduling vacations.
Lower right: Special-Purpose Teams. When a short-term task cuts across a larger portion of the organization, an interfunctional team is required. Participants bring technical knowledge as well as the ability to represent the interests of their colleagues.
Upper right: Cross-Functional Teams. Communication and coordination across organizational boundaries are often achieved with cross-functional teams. These typically meet on a regular basis to review systemwide issues and provide representative input. Examples are safety, training, and quality improvement.
Method. Team form should be guided by task function and organizational culture:
Step 1: Diagnose. Determine if a team is required by considering such issues as interdependence, need for communication, and ability to influence.
Step 2: Envision. If there is a need for a team, identify which of the four types is required.
Step 3: Design. Recruit team members, orient them, and operate with clear expectations, role, authorities, and processes.
What leadership and culture are needed? How do we diagnose the current state, and how do we improve it?
Most observers agree that culture and leadership are key factors in attaining organizational health and productivity. Defining these qualities and the methods for strengthening them, however, is a more elusive undertaking. Fortunately, we have numerous examples of excellence in both areas to draw on. The frameworks in this section tend to reflect best practices, emphasizing balance and adjustment to situational requirements.
The leader needs to match their leadership behaviors to the performance level of the individual or group. This is really a follower-driven model, not a leader-driven model.
This helps people figure out if organizational leadership needs to be more like Genghis Khan or Mr. Rogers; we find that pretty important!
After spending years trying to prove otherwise, the preeminent leadership researcher Ralph Stogdill concluded in 1948, "A person does not become a leader by virtue of the possession of some combination of traits."[90] This acknowledgment gave rise to a procession of multifactored, contingency-based leadership models. The best-known and most widely used of these is Situational Leadership, formulated in 1969 by Paul Hersey and Ken Blanchard (Figure 7.7). Situational Leadership maintains that leader effectiveness depends on matching style with task requirements and follower maturity level. The model focuses on behavior rather than attitude.

The Two Dimensions and Their Extremes. The Situational Leadership matrix explores two key dimensions: Relationship Behavior and Task Behavior:
Relationship Behavior. Relationship behavior refers to the extent to which leaders are concerned with the socioemotional needs of staff, encourage progress, and actively listen.
Task Behavior. Task behavior refers to the extent to which leaders initiate, define, plan, and organize work.
The Four Quadrants. The Situational Leadership model allows leaders to quickly map followers' task-specific performance into four readiness levels, each demanding a different leadership style. It can also be used by external parties such as recruitment firms and human resource departments to identify hiring priorities when filling management vacancies. The action required of the leader defines each quadrant as a uniquely different leadership style.
What sets this model apart is its recognition of differences among those who are to be led. Staff exhibit varying degrees of readiness, and this determines which of the four leadership styles will be most appropriate. If followers are unwilling or unable to take responsibility, the Telling style of leadership is most appropriate. If they are fully capable of doing the work and willing to accept responsibility for the task, the Delegating style of leadership is the best fit:
Upper left: Participating. Followers are able but unwilling to be responsible. Participating and development are needed to coach and reassure the person whose motivation and focus are flagging.
Lower left: Delegating. Followers are willing and able to take responsibility. The leader recognizes their ability by showing trust and maintains a less active role and relationship with them. Delegating works for both parties, increasing scope for development and job satisfaction for the employee, while freeing the leader to focus on other tasks.
Lower right: Telling. Followers are unable and unwilling to take responsibility. A strong, directive leadership style is needed. Intimidating or overwhelming tasks are two examples where a Telling approach is recommended.
Upper right: Selling. Followers are unable but willing to take responsibility. Task direction is coupled with socioemotional support and rationale for why work needs to be completed in a particular way.
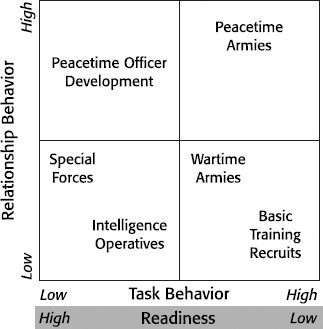
Example: U.S. Army. The U.S. Army recruited approximately 79,500 young men and women in 2002, creating a standing force of 475,000 soldiers. Recruits enter untrained and unskilled, and over a period of several years they progress from this state of relative ignorance to readiness for the two basic situations the army must face: war and peace. These different contexts present a challenging set of demands, calling on sensitivity, awareness, and leadership competencies at the highest level.
The years following the Vietnam War and the Persian Gulf Conflict were extended periods of peace. During these eras, retention and development of talent depended on offering meaningful growth and interesting assignments without the looming threat and the experience of waging war.
Conflicts in Yugoslavia and the Middle East have once again forced a return to the primary war role and capability. But turning on a dime from peace to war is not easy.
Situational Leadership helps to determine the appropriate leadership style for different contexts and to define the leadership competencies most required by army officers (Figure 7.8). In peacetime, recruits move quickly from the Telling style of being led to the Selling mode, where a primary goal is to retain the motivation and loyalty of troops in the face of minimal external danger and demand. In the case of high-potential officers, the Participative style is needed to tailor development opportunities to the individual.
In wartime, it is essential that soldiers can operate in the Telling mode, where command and control direction is often mandatory. There isn't much time for Selling, except when will is flagging and troops need inspiration; think of Churchill in the most trying periods of World War II and, more recently, Norman Schwarzkopf in Desert Storm. For certain high-risk missions, total Delegation is necessary as teams operate independently.
Context. Situational Leadership is used by managers to plan how to approach a given subordinate and by executives and human resource specialists when determining how to hire managers and leaders for a team.
Method. An early version of the Situational Leadership questionnaire was published in the May 1976 issue of Training and Development Journal. Twelve multiple-choice questions help to identify one's preferred leadership style and the level of staff readiness. The object of the exercise is to match leadership style with the unique needs of each staff member.
Since that time, Hersey has continued to update the original work and published new versions of diagnostic survey tools. At its most basic, here is how to apply the Situational Leadership framework:
Step 1: Assess. Assess the readiness of each member of a work group for specific tasks. Readiness refers to the Ability to complete the required task assignment and Willingness. Assessment can be done with the help of a Situational Leadership survey tool or by carefully and systematically appraising the readiness of each individual.
Step 2: Evaluate. Locate all the workers on the grid to reflect their relative Readiness.
Step 3: Assess. Assess the manager's style of leadership. The first step in being able to vary your leadership approach is gaining awareness of what you are currently doing to succeed. The manager may be generalizing this method across all staff and situations, meeting with the greatest success where his or her natural talents and inclinations are well suited to the situational needs.
Step 4: Design. Review each of the staff relationships, and construct a plan to address situational needs. Recognize that some cases may place role pressures on the leader or even the larger work system. Performing a variety of leadership functions depends on several things: awareness of staff needs and one's preferred style, agreement by both parties to play reciprocal roles in a respectful and sincere way, and competency on the part of the leader to provide different forms of leadership. Leadership coaching and training may be required to help the manager successfully behave differently.
Step 5: Review. Before implementing leadership plans, it is important to step back to regard the larger leadership and organizational landscape you have created. A solution at one level can create organizational or work design problems elsewhere. For example, a manager can support a wide span of control if most work is delegated to mature professionals who operate independently. If the leadership solution involves lots of coaching, a new level of supervision may be required to relieve the time burden being placed on the manager.
Many putative "leaders" fondly imagine they are running their organizations when all they are doing is allowing them to run themselves. They do not understand the power play at work and are measuring the wrong things.
Formal roles and processes often take a back seat as organizations become increasingly dependent on knowledge.[92] Resentments and misunderstandings can easily occur in such environments, as individuals perform their tasks with only limited awareness of their impact on the firm and those in other positions. Karl-Erik Sveiby, one of the founders of the Knowledge Management movement, argues for higher awareness and conscious management of the interchange between the four fundamental roles that tend to arise in such contexts. Both Professional (content) and Organizational (process) Competencies are necessary and in the right balance (Figure 7.9).
The Two Dimensions and Their Extremes. The Four Power Players matrix explores two key dimensions: Professional Competence and Organizational Competence:
Professional Competence. This refers to the content of the business, the company's core value proposition.
Organizational Competence. This consists of administrative, communications, and related maintenance functions.
The Four Quadrants. The dimensions represent the two knowledge traditions that can be found in most organizations. These traditions must find a way to coexist constructively and respectfully:
Upper left: The Professional. Knowledge businesses as typified by the consulting firm are built around this role. Customers demand their expertise. They represent the essential value of the business in the marketplace. Professionals thrive on solving thorny problems. They dislike routine and solving problems the same way over and over. This tendency creates tension with the administration and those trying to increase productivity: the managers. Professionals often appear to be self-absorbed and thoughtless about administrative needs. Operating with a different sense of urgency and purpose, they are however capable of higher levels of consideration and collaboration when informed and appropriately motivated.
Lower left: The Support Staff. Success in professional firms often depends on freeing up front-line staff from administrative and detail work. Support staff play the crucial role of handling the many tasks that are not dependent on professional expertise but are nonetheless critical. There is a tendency for these people to fall out of the communication loop and resent others, principally the professionals, who often display little sensitivity to organizational rules and needs.
Lower right: The Manager. Managers have designated authority to make sure work is coordinated and completed in a sustainable and acceptable way. They are responsible primarily for the organizational priorities of the firm, making it possible for others to be creative and client centered. Managers work through other people, in contrast to professionals, who work with other people. Managers therefore often find themselves at loggerheads with the professionals.
Upper right: The Leader. Leadership provides direction and passion that defines and drives the business. In knowledge-based firms, leadership does not always come from formally designated leader roles, and it can be more difficult to assert. Nonetheless, it is essential. A prime task of formal leadership is to provide professionals with the conditions to exercise their creativity for the benefit of customers. Because of the enormous and often conflicting demands, some successful companies split this role. For example, one person may be in charge of professionals, while someone else is responsible for marketing and administration. Leadership in a newspaper, for example, is divided between the editor and the publisher.

Method. The framework is useful for diagnosing and clarifying individual roles and organizational balance. Problems arise when roles are missing or are not being well executed:
Step 1: Assess the need for the four primary functions (more, less, or okay as is)?
Step 2: Identify who is in each role.
Step 3: Assess the effectiveness of each function.
Step 4: Assess the health of the relationship between the roles.
Step 5: Make adjustments to improve within the four functions or between the functions.
Sveiby, K.-E. The New Organizational Wealth: Managing and Measuring Knowledge Based Assets. San Francisco: Berrett-Koehler, 1997.
Plotting the way that a leader works on a simple two-dimensional continuum like the following (Didactic
Training groups are settings where participants improve life skills of a primarily social and leadership nature.[94] Effective leadership of such groups calls for a balance of intellectual content—didactic instruction—and participatory self-discovery—facilitation (Figure 7.10). Leaders need to develop both of these skills and learn when each is most appropriate.
The Two Dimensions and Their Extremes. The T-Group Leadership matrix explores two key dimensions: Didactic and Facilitative:
Didactic. This is a content-oriented, telling orientation. The teacher is the expert who imparts a predefined body of knowledge to students.
Facilitative. This is an experiential, helping orientation based in observation, process, and sharing of responsibility. The agenda is generated in a here-and-now manner, and the way solutions are achieved is often more important than the solution itself.

The Four Quadrants. Leaders need to match their role with what is required in the situation. In any training group, a certain amount of tension between the didactic and facilitative emphasis is inevitable:
Upper left: Content Leadership. Content leadership employs a traditional teacher-student approach. The teacher is in control and responsible for defining and imparting knowledge. This approach is appropriate for phases of learning and under certain circumstances, such as large classes.
Lower left: Leadership Abdication. Leaders who are too invisible add little, frustrating the group and wasting time that could be spent productively. Leaders need to take responsibility for their role and contributions.
Lower right: Process Leadership. Process leaders focus on the moment, with the group interaction setting the agenda. This approach is most useful when working with small, intact work teams where the goal is performance effectiveness.
Upper right: Balanced Leadership. Learning needs change dynamically in training groups. At one moment, the priority is making sense of an incident, calling on high facilitiative skills; at the next moment, it is acquiring a deeper understanding of a concept like trust or interpersonal conflict, calling on didactic mastery. Excellent training group leaders have developed both competencies.
Method. Leaders increase their effectiveness by matching their approach to situational requirements:
Step 1: Diagnose. Consider the learning needs and capabilities of team members.
Step 2: Design. Prepare experiential design and materials in accordance with needs.
Step 3: Deliver. Deliver the training, monitoring success and adjusting as necessary.
What new competencies are needed? What change is required? How do we manage the change?
The old saying, "If it ain't broke, don't fix it," has been replaced with the metaphor of "perpetual whitewater." At times, it really does appear that the only constant left is change. Adjusting to this state of affairs, organizations are building more flexible roles and structures and designing business processes that deliver just-in-time value to minimize waste and excess inventory.
Learning is a key enabler of change. In some businesses, training and development is a fully integrated function, preparing staff well in advance of change initiatives. Too often, though, it is an afterthought, competing with other tasks for scarce time and attention.
Frameworks in this section address the two topics of learning and change as an integrated whole, underscoring their interdependency.
In an economy where the only certainty is uncertainty, the one sure source of lasting competitive advantage is knowledge.
The notion of tacit knowledge in the SECI model (named for the four forms of knowledge conversion identified in the matrix: Socialization, Externalization, Combination, and Internalization) is based on the work of philosopher Michael Polanyi, who in 1966 classified knowledge into two categories: tacit and explicit. For Polanyi, knowledge that could be expressed and stored in words and numbers represented a small portion of human knowledge. The greater part represented hunches, intuition, values, images, beliefs, principles, and mental models of the world that enable us to work and socialize effectively. In 1995, Ikujiro Nonaka and Hirotaka Takeuchi published the SECI model (Figure 7.11) to help people understand how tacit and explicit knowledge interact within organizations and how the management of those interactions, which they called knowledge conversions, could be a source of competitive advantage. Their subsequent publications expanded on this model, and their insights have had a profound effect on how corporations now think about knowledge assets and knowledge management.[96]
Corporations have been receptive to this message, and for good reason. Over the past fifty years, the balance of value within firms has shifted from physical assets to intangible knowledge assets. When combined with the impact of increasing global competition, this has forced a fundamental change in organizational structure, from vertical, hierarchically integrated firms to ones that are increasingly horizontal, flat, and modular.
In the traditional model, work was conceived at the top of the hierarchy and executed at the bottom. Information flowed quickly down and not so quickly back and forth and up the chain of command. It is increasingly clear now that the knowledge that management seeks to control is created and leveraged daily by personnel throughout the organization, including unskilled, manual, and clerical workers.
In order to get their jobs done, workers continually create new knowledge. When they hit roadblocks, they invent solutions: they figure out how to operate equipment more efficiently, work around technology problems and design flaws, solve customer issues, and coax productivity out of informal organizational networks. Nonaka and Takeuchi's SECI matrix provides a systematic way of viewing the life cycle of knowledge development and transfer among workers within the firm.

The Two Dimensions and Their Extremes. The SECI matrix explores two key dimensions: Tacit Knowledge and Explicit Knowledge:
Tacit Knowledge. Tacit knowledge is highly personal and difficult to share. How do you communicate physical skills like becoming a master glass blower or learning how a second baseman makes a double play? How does a mother sense the needs of her child before they are expressed? And how does your most skilled computer technician diagnose problems in seconds that might take others hours? As Larry Prusak, executive director of IBM's Institute for Knowledge Management, says, "Knowledge is sticky, staying close to individuals and contexts."[97] Most of these kinds of knowledge don't translate quickly through books and computers. They are embedded in us as a result of our life experiences and the skills we practice on the job.
Nonaka and Takeuchi define two aspects of Tacit Knowledge: the cognitive and the technical. In the cognitive dimensions are the beliefs, ideals, and views of the world that are so deeply ingrained in us that we are frequently unaware of them. By shaping the way we see ourselves and the world around us, the cognitive dimension provides a foundation for all our interactions. The technical dimension refers to skills and know-how and personal ability to get our jobs done that have been set in place through long experience and practice.
Explicit Knowledge. Explicit Knowledge consists of knowledge that we communicate in formal language. It is discrete and can be captured and transmitted digitally. It can be encoded in a wide range of forms, such as books, manuals, and electronic databases.
The Four Quadrants. Each type of knowledge can be converted. When viewed as a learning process, the SECI matrix takes the form of a spiral. The four stages of knowledge conversion describe how organizations create, manage, and transfer knowledge. In the upper left, the process starts with Tacit "sympathized" Knowledge, hard-won worker skills that must be shared and socialized to become Explicit "conceptual" Knowledge (upper right). Once converted to Explicit Knowledge, it can be combined and integrated into explicit forms that can be shared throughout the organization. As workers reinternalize what they learn, it becomes Organizational Knowledge (lower left), part of the shared knowledge of the firm. Ultimately, newly trained workers begin to practice their skills on the job, slowly turning Explicit into new Tacit Knowledge over time (upper left):
Upper left: Socialization (Tacit to Tacit). Socialization involves capturing knowledge through physical proximity and direct interaction with people. It is a Tacit-to-Tacit exchange. For example, people who work with mentors learn by observing, children watching their parents learn through imitation, and students watching an artist or craftsman at work learn by practicing what they have seen done by others. When we share physical space, activities, and experiences, we find numerous ways to learn from one another.
Lower left: Internalization (Explicit to Tacit). Internalization refers to the conversion of Explicit Knowledge into the organization's Tacit Knowledge. In this stage, workers learn by doing and by training, turning the organization's wisdom into skill and knowledge of their own. They internalize the knowledge and increasingly rely on their own skills and judgment.
Lower right: Combination (Explicit to Explicit). Combination is the conversion of Explicit Knowledge to new Explicit Knowledge. There are three main elements: combination, dissemination, and processing. First, Explicit Knowledge is captured and combined with other knowledge to create deeper, more complex levels of understanding. For example, a strategist who purchases an outside research report and integrates it into a strategy document she is writing is creating new Explicit Knowledge from two prior sets of explicit information. In the dissemination phase, the organization attempts to disperse the new knowledge through internal publications, meetings, and other processes. Finally, in the processing stage, new knowledge is edited internally into strategies, plans, and reports that make it easier to share and apply within the organization.
Upper right: Externalization (Tacit to Explicit). Externalization is the stage of Tacit-to-Explicit information conversion. Articulating Tacit Knowledge in forms that others can understand—words, concepts, instructions, figurative language, and pictures—externalizes it. In practice, this often occurs though dialogue with others (work groups) and creative techniques such as hypothesis development using metaphors and analogies.
Example: Communities of Practice at Xerox. Many firms today face the complex challenge of maximizing the long-term value of Tacit Knowledge. Operational knowledge, as in processes such as check cashing and auto assembly, can be codified, reengineered, and taught to others. But how do you transfer craft skills and insights? For example, if you wanted to become a master consultant, the best way to do that would be to work with one. In fact, this is exactly the approach taken by firms such as McKinsey, which believe that young recruits must spend lots of time with top consultants in order to learn the client management and creative conceptual skills that lead to success in their business.
Companies such as Buckman Laboratories, Xerox, and Johnson & Johnson are among the leaders in the emerging field of knowledge management. At these companies, a great deal of effort goes into supporting communities of practice: groups of people who share similar goals and interests and employ common tools and language in performing their work. The problems they experience are common, and they work together to learn and create solutions. In reality, a community of practice may be a far-flung virtual group of programmers or an in-house marketing team drawn from many disciplines. The output of communities of practice is knowledge as well as social capital—norms of trust, reciprocity, and citizen participation. As workers come together in an organic fashion to solve problems, they improve the overall efficiency of the organization. As the technology for global cooperation has improved, firms are finding it easier to foster collaboration that serves customers and empowers employees to take the lead in creating and converting new kinds of knowledge.
John Seely Brown, chief scientist of Xerox, relates the story of how communities of practice were developed among the company's repair technicians beginning in the early 1990s. When he was asked to design knowledge systems for technicians, he began by asking anthropologists to study the activities of the people in the field. He wanted to know how they learned and shared information. The main finding was that when a problem was encountered, a technician would call another technician and tell him the "story" of the machine (Figure 7.12). They would then share story "fragments" about other repair experiences, weaving a narrative together until they arrived at a solution for how to fix the machine. Storytelling continued when technicians got together for coffee and doughnuts in the morning before going into the field, serving as an informal method through which best practices were shared.[98]
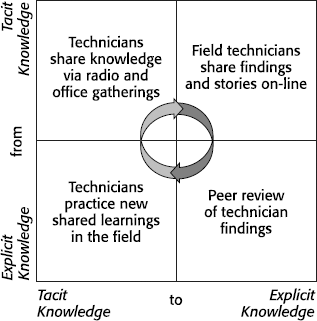
To leverage this knowledge further, Brown created a community of practice by providing field technicians with two-way radios. These were always on, so the reps remained connected to their own instantaneous community of experts. Although this helped individual technicians improve their work in the field, it did nothing to improve the learning of technicians across the rest of the firm.
Brown was challenged to create a system that tapped the minds of the community of practice, not just the mind of one expert technician. In response, he and his team deployed a system they called Eureka, which enabled technical reps to share their stories over the Web. Periodically, specialists would validate the stories. In this way, individuals with specific knowledge became known to the whole community, and answers to very specific questions became available globally as soon as they were discovered. Brown estimates that learning increased 300 percent and saved Xerox up to $100 million per year.
Context. The SECI matrix is useful for raising awareness of how knowledge is managed in an organization. This awareness can be factored into the design of knowledge-sharing strategies and systems to improve knowledge creation, storage, and exchange practices. Each of the quadrants represents a diagnostic category and improvement opportunity to explore.
Method. Try the method that follows to examine an area of practice in your organization:
Step 1: Define. Identify an aspect of organizational performance where there is a knowledge issue or gap.
Steps 2–5: Diagnose. Examine and improve by tracing the handling of knowledge in this area through the knowledge life cycle by following the four phases of the SECI:
Upper left: Who has the knowledge? How is it shared or socialized?
Upper right: What mechanisms exist to make the knowledge explicit in the firm? Who is responsible for that?
Lower right: How is knowledge about this aspect of organizational performance synthesized with knowledge from other sources outside the firm? Where and how does that happen?
Lower left: What processes are in place to train and support further internalization of this new knowledge?
Step 6: Envision the payoff. Answer the question: How would the improvement in knowledge capture and transfer lead to higher levels of performance within the firm? Cost reductions? Time savings? Quality improvements?
Brown, J. S., and Duguid, P. "Organizational Learning and Communities-of-Practice: Toward a Unified View of Working, Learning, and Innovation." Organization Science, 1991, 2(1), 40–57.
Nonaka, I., and H. Takeuchi, H. The Knowledge-Creating Company: How Japanese Companies Create the Dynamics of Innovation. New York: Oxford University Press, 1995.
Nonaka, I., and Toyama, R. "A Firm as a Dialectical Being: Towards a Dynamic Theory of a Firm." Industrial and Corporate Change, 2002, 11, 995–1009.
Random hiring of Ph.D.'s won't cut it. What are you going to do with them? Human capital needs its customer and structural siblings to make a difference.
Thomas Stewart, executive editor of the Harvard Business Review, is one of the pioneers of the Knowledge Management movement and the author of two of its most important books, Intellectual Capital (1997), and The Wealth of Knowledge (2001). Intellectual capital, comprising human, structural, and customer components, is the new driver of competitiveness. The year 1991 was pivotal: worldwide investment in intangible information technologies (such as computers, telephones, and personal digital assistants) overtook money spent on machines (farm machinery, factories, metal, and plastics, for example) involved in the production of tangible products. As the "weight of value" continues to decline, it becomes increasingly important to create meaningful ways to define, identify, develop, manage, and measure these intangible assets.
Stewart makes the argument for strategic management of three primary forms of intellectual capital: human, structural, and customer. In the domain of human capital, certain types of knowledge assets hold much higher value to firms than others. By focusing on two criteria, Difficult to Replace versus Important to Customer, businesses can determine the relative importance and difficulty of the replacement of its business functions and the competencies they depend on. The Human Capital framework (Figure 7.13) offers a clear and useful method for organizations to assess operations and determine the best treatment of divisions and positions throughout the company.
The Two Dimensions and Their Extremes. The Human Capital matrix explores two key dimensions: Difficult to Replace and Important to Customer:

Difficult to Replace. Some skill sets are more difficult to replace than others. Jobs based on scarce competencies (such as cardiac surgery) or unique knowledge about the business (such as auditing and communications) are higher in this regard than those consisting of repetitive, procedural work (for example, assembly line worker, cleaning staff). This dimension is primarily indicative of the importance of a role within the organization as opposed to representing a customer perspective.
Important to Customer. Certain competencies in the firm are more directly tied to customer value creation than others. Those aspects of value that attract and reinforce customer loyalty are central to a firm's identity and competitiveness.
The Four Quadrants. "A company's human capital," writes Stewart, "is in the upper-right quadrant, embodied in the people whose talent and experience create the products and services that are the reason customers come to it and not to a competitor. That's an asset. The rest—the other three quadrants—is merely labor cost."[100]
By considering Human Capital in the same way we treat other corporate assets, firms can make better strategic choices about organizational structure, recruiting, and training. Difficult to Replace and Important to Customer are two defining characteristics of all the roles and employees in an organization. Applying this framework demands a degree of analytic dispassion, favoring the needs of the business over those of individuals. As Stewart points out, it doesn't really matter if your employees are all brilliant or extremely hard working if they are producing nonessential results. The Human Capital framework places the focus on organization design and strategic deployment of staff, increasing the value of their output. As the framework indicates, the goal is to upgrade the value of the firm's Human Capital by directing it either up and to the right or out of the organization through options such as outsourcing or automation:
Upper left: Informate. Businesses rely on the contributions of staff functions that are complex, nuanced, and take time to learn. Although it is difficult to replace these individuals, their work is often underleveraged and invisible to customers. Customers don't really care about internal audit, billing, or complex factory process work unless they are done wrong. The strategic interest in this quadrant is to derive additional benefit from a functional activity. Informating a task means enriching it with added-value education or service. This is what GE did a few years ago when it redefined and augmented its internal audit process, changing it from mere numbers checking to a consultative service providing useful feedback and best practices advice. Another example is the move to equip call center staff with better customer intelligence tools, allowing them to target and deliver personalized value to callers based on their characteristics and likely needs.
Lower left: Automate. Many businesses find themselves somewhat dependent on low-complexity, semiskilled workers. Although the success of the business may indeed depend on the contributions of these employees, the individuals hired to do the work are interchangeable and easy to find. McDonald's and most of its competitors have designed their outlets with this in mind. The most basic repetitive work is automated out of the process. The remaining tasks, like food preparation and order taking, are routinized so that low-salary staff can be quickly trained and deployed as required. McDonald's, for example, is able to function smoothly in spite of annual turnover rates ranging geographically from 50 to 300 percent.
Lower right: Differentiate or Outsource. Some work is extremely high in value yet not identified directly with specific individuals. Consider the cover design of a book or quick technical support provided to users of a piece of computer hardware or software. Although these services are vital to the success of a business, they can be found fairly easily. Firms can consider two actions to increase the value of this category. The first is Outsourcing such a service, which can be economical while permitting the company to focus its energies on other more essential and differentiating activities. Firms can afford to be world class in specialized areas like logistics and product assembly by moving the function to a trusted strategic partner like UPS or Solectron.
Differentiating occurs when a set of generic capabilities is organized and packaged as an integrated offering at a higher level of perceived value. A clear example is the migration of computer hardware and software companies to the consulting and information technology systems solutions business.
Upper right: Capitalize. The upper right quadrant is the target zone where companies should concentrate their Human Capital. These are the prime innovators, leaders, and service providers working at jobs that differentiate the firm and delight customers. They span roles like research chemist, top sales representatives, and movie stars. As the percentage of a firm represented by this category increases, its competitiveness and relative value rise.
Example: The Metamorphosis of the Automotive Industry. Early in the twentieth century, the Ford Motor Company became the dominant global automobile manufacturer when it introduced its famous moving assembly line. A rope would pull the vehicle along, making it possible for fifty employees to remain in fixed positions and add their defined contribution in a controlled and efficient manner. The time it took to build one Model T dropped from twelve hours to one and a half, and the cost fell from $850 to $250.
With this amount of improvement, the vertically integrated business firm model became standard in the industry. Ford's Rouge River manufacturing plant was famous for the depth of its value chain, ranging from rubber plantations in South America for tires to glass manufacturing facilities. While General Motors offered a wider set of product selections than its main competitor did, it followed a similar business architecture and vertical culture. When GM president Charles Wilson was being considered for the position of secretary of defense for the United States in 1953, he was asked if he thought his position with GM might cause some conflict of interest. He replied, "I cannot conceive of any because for years I thought what was good for our country was good for GM and vice versa."[101]
The tightly integrated philosophy and business structure that made this response possible continued to dominate the industry well into the second half of the century. Improved communications and collaboration technologies eventually transformed this. Today, all the major auto companies are global; they are sourcing, manufacturing, and selling around the world. A well-established system of suppliers and the movement toward standardized parts and communications has resulted in a much more open and horizontal industry model.
The automotive industry took on a whole new shape as production technologies and communications systems improved (Figure 7.14). Companies and whole subindustry groups formed to offload portions of value creation at attractive prices and terms.
Repetitive manual work and mindless reminders and tracking functions have been automated out of the human part of the system. Most modern auto plants make extensive use of robotics and smart quality process control technology.
Internet-based problem-solving systems make the best company experts' knowledge available to customers, informating talent that was previously hidden inside the organization. Other services, like leasing and sales information, have undergone a similar change.

Probably the greatest amount of change has occurred in the work falling in the lower right quadrant. Outsourcing and strategic partnering now account for a significant share of the automotive value chain. The creation of Covisint in 2000 by GM, Ford, and Daimler Chrysler as a common electronic trading environment has accelerated the growth of partnering within the industry. Daimler Chrysler estimates that close to 70 percent of its suppliers are now on-line via Covisint and applying a common quality management tool called Powerplay.com. EDS, at one time owned by GM, still provides the vast majority of its information technology services.
Increasingly, the role played by the automotive company itself is of a knowledge-intensive and strategic nature. Customer relationship management and positioning and caring for the brand are core assets carefully comanaged with the dedicated dealer networks. Design and marketing of the vehicles is central to differentiation, as is business and pricing strategy. As in other manufacturing industries, increasing amounts of production are treated as a commodity service that can be outsourced, leaving the company free to concentrate on planning and coordinating the inputs of low-cost specialist partners and suppliers.
Contexts. The framework is useful for firms engaged in strategic improvement exercises or when they are considering outsourcing functions.
Method. A Human Capital review and design process helps a company to understand and improve its deployment of talent. Each of the steps here can be completed in a variety of ways, depending on who does the work and how extensive the redesign needs to be. For example, in step 2, a single person can deliver a high-level set of recommendations, or one work group can be established for each of the four quadrants to conduct a fuller set of reviews and proposals:
Step 1: Analyze work. Analyze work done within the organization, placing all functions and roles in question into one of the four quadrants.
Step 2: Identify improvement opportunities. Explore opportunities to improve the deployment of Human Capital within each of the three suboptimal quadrants. For example, how can work falling into the upper left quadrant be informated, or that in the lower left be automated?
Step 3: Create improvement plans. Prepare a set of recommendations and plans for Human Capital improvements, and prioritize these for desirability and feasibility.
Step 4: Enhance key assets. Consider how the human capital in the upper right quadrant can be enhanced as well as protected.
Stewart, T. Intellectual Capital: The New Wealth of Organizations. New York: Currency, 1997.
Stewart, T. The Wealth of Knowledge. New York: Currency, 2001.
Development of an organization is a purposeful transformation toward higher levels of integration and differentiation at the same time.
Systems thinkers see organizational and cultural development as a balancing act between the proliferation of new ideas, entities, and behaviors and the effective integration and management of these things. The corollary is simple: as the rate of change and differentiation increases, the need for integration rises in kind (Figure 7.15).
Healthy organizations and societies encourage individual initiative and development, while ensuring coordination of efforts and sharing of knowledge. Social systems of all varieties are in a constant process of change, slight or extreme. In times of greater turbulence, both positive and negative, more change is called for. Recall the economic and political upheaval in the former Soviet Union or the rush of creative competition in Silicon Valley during the 1990s. When the rate of change outstrips a system's ability to integrate it, the effect can be overwhelming and destructive, leading to failure and dysfunctionality. When both forces are working together, progress can be exhilarating, as occurred in Europe during the Rennaisance and in the operation of excellent companies like Dell and GE.
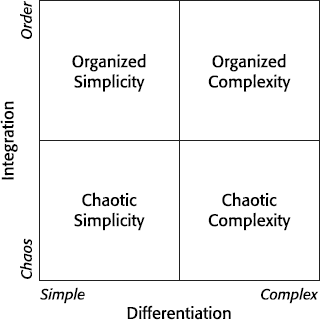
The Two Dimensions and Their Extremes. The matrix explores two key dimensions: Differentiation and Integration:
Differentiation. Differentiation is the pursuit of new and diverse directions for growth and development. This is essentially artistic in nature, leading toward greater complexity and autonomy for the parts of a system.
Integration. Integration efforts establish order and stability by creating meaningful trade-offs and links between diverse system elements. The orientation is more scientific, emphasizing rationality, instrumentality, and conformity.
The Four Quadrants. With the introduction of energy and intention, systems evolve from simple to complex and from chaos to order. This process, called negentropy, is a prime feature of living systems and assumes a reasonable amount of balance between creative (Differentiation) and synthesizing (Integration) forces. The not uncommon tendency to emphasize one or the other in isolation creates extreme environments in ways that are self-reinforcing. In the worst of cases, the system must approach complete destruction before a reversal of direction can be initiated:
Upper left: Organized Simplicity. This state dominates when forces for control and order prevail at the cost of new ideas and approaches. A form of stability is attained, but it tends to be rigid and authoritarian. Although efficiencies are often realized, energy is lost, and long-term viability is jeopardized.
Lower left: Chaotic Simplicity. This quadrant describes a relatively simple condition with low levels of organization. This might be the case during a period of low demand or, conversely, a system that is at a point of giving up efforts to cope effectively.
Lower right: Chaotic Complexity. Chaotic Complexity prevails when innovation and experimentation are pursued without restraint and accountability. Diversity can overload the system, depleting it of resources and focus. Duplication of efforts, errors, and conflicts are real dangers.
Upper right: Organized Complexity. Healthy progress through experimentation, learning, and integration is achieved by moving concurrently toward higher levels of complexity and order. Innovations are supported in ways that contribute to overall system improvement; knowledge is shared, and self-correction is ongoing.
Example: Health Care Cost Crisis: Butterworth A viable and affordable health care system is arguably a cornerstone of a successful society and a fair measure of its performance. An aging population in the United States is placing increasing demands on an already fragile and overburdened health care infrastructure. As Gharajedaghi observes, "The present health care system has its origin in sickness care."[103] People expect access to adequate care in a reasonable time frame at a price they can afford.
A series of payment and service delivery options have been spawned, including fee for service, health maintenance organizations (HMOs), independent (self-insured) companies, Medicare (for those over age sixty-five), and Medicaid (for those lacking means). Although these are helpful measures, the combined effect of these approaches has been an escalation in patients' expectations, with little countervailing pressure to limit demand.
Butterworth Health Systems is an HMO operating in the Grand Rapids, Michigan, area. Recognizing the symptoms of an accelerating gap between patient expectations and the affordability of care, a search for new alternatives based on an understanding of needs and limits was initiated. The four quadrants in Figure 7.16 describe the evolution of responses that Butterworth and other HMOs have attempted.[104]
The lower left quadrant, Streaming, describes the early years of operation. In this phase of its existence, the facility served a defined segment of the population. The lower right quadrant, Overwhelming Reactive, describes unsuccessful efforts to creatively accommodate a multitude of expectations and payment mechanisms. It was clear that order needed to be achieved to maintain system viability, pushing the organization to the upper left quadrant, Enforced Compliance.

Added pressures on the system led to efforts to Enforced Compliance as a way to control and manage demand. The system was becoming at once increasingly bureaucratic and mechanistic, while remaining incapable of meeting expectations with the existing resources and funding arrangements. Gharajedaghi writes, "HMOs have been forced to use a bureaucratic system and a mechanistic mode of operation to manage the most emotional and sensitive behavior of a human system of health care."[105]
Option 4, Preventive Proactivity, came about through a design exercise in 1996 led by INTERACT (a Pennsylvania-based consultancy where Jamshid Gharajedaghi is managing partner and CEO). The distancing of patient need from payment responsibility was driving expectations beyond the service ability of the company within funding levels set by payment bodies like insurance companies and governments. By promoting health and illness prevention, Butterworth was able to reduce the volume of higher-cost acute care demand from patients. The solution (in reality more complex than this description) helped to transcend the stuck place where all options appeared to be unworkable by appealing to a more primary aspect of self-interest of the system beneficiaries, the patients.
Context. Differentiation and Integration is part of a design approach that offers a powerful and intuitive method for social system redesign. It is effective as a timely and nonthreatening intervention to prevent excessive chaotic or bureaucratic buildup. Due to its structure, it scales easily from serving as a convenient context for reflecting on a situation to a more structured and systematic program approach.
Method. The systems approach to organizational improvement models the whole and all its parts in dynamic relationship. A systems intervention is sensitive to balancing degrees of Differentiation and Integration, proceeding in a series of iterations toward a more desirable state that is feasible and supported. INTERACT's approach has the following characteristics:
Problem definition and solution building are distinct and separate processes.
Stakeholder buy-in is important.
Design occurs at three interdependent system levels: structure (inputs, means, causes), function (outputs, ends, efforts), and process (know-how, sequence of activities).
The output of an intervention is a new architecture that enables desired performance and benefits and resolves or eliminates defined problems.[106] Guided by an understanding of systems principles, an intervention follows a three-phase sequence:
Step 1: Understand the context.
Step 2: Define the problem.
Step 3: Design the solution.
Gharajedaghi, J. Systems Thinking: Managing Chaos and Complexity. Boston: Butterworth Heinemann, 1999.
Put another way, one cannot impose cooperation on another without a fight, or at least so it seems.
Conflict is inherent in living systems and is not always a problem needing to be solved. Healthy, adaptive systems effectively harness the knowledge and energy of diverse parties. Russell Ackoff first modeled the dynamics of Means and Ends (Figure 7.17) in his 1972 book, On Purposeful Systems. Interdependent parties are motivated by the Ends they pursue, with conflicts resulting where Ends are or appear to be incompatible with those of others. The Means whereby Ends are achieved may also be more or less compatible with those of other interested parties. By addressing these issues, negative conflict can be better understood and reframed into more constructive forms of relationship.

The Two Dimensions and Their Extremes. The matrix explores two key dimensions: Means and Ends:
Means. These are the methods we employ to achieve desired outcomes.
Ends. These are the goals and objectives that we value.
The Four Quadrants. Problem solving and design occur in a series of iterative waves, calling on four sets of activity, each with an associated skill set:
Upper left: Coalition. Coalitions are formed by competitors to address common, usually short-term problems or adversaries. We find these arrangements in wars, industry, and interpersonal dynamics. A truce is called to focus on the shared threat, after which the parties may well return to conflict.
Lower left: Conflict. Parties that disagree about both Ends and Means are stuck in Conflict. These situations can become increasingly polarized, resulting in zero-sum, win-lose outcomes. Communication and reframing help improve conflicts. In On Purposeful Systems, Ackoff suggests three ways to address Conflict: solve, resolve, and dissolve.
Lower right: Competition. In Competition, lower-level conflicts provide a useful context for realization of the interests of different parties. Companies within an industry compete against each other for customers yet share the need to educate the public about their collective value proposition. Healthy Competition often creates the most positive conditions for growth and mutual success.
Upper right: Cooperation. Parties Cooperate when both Ends and Means are compatible. In Cooperation, it is assumed that each party contributes positively to the success of the other.
Method. The framework is useful in transforming unhealthy Conflict situations through dialogue, awareness, and reframing:
Step 1: Identify the Ends and Means of the parties involved.
Step 2: Identify the quadrant that best describes the situation.
Step 3: Creatively investigate the possibility of redefining the Means or Ends of either or both parties to improve the relationship and likelihood of a positive outcome.
Ackoff, R. L. On Purposeful Systems. Seaside, Calif.: Intersystems Publishers, 1972.
Ackoff, R. L. The Art of Problem Solving. New York: Wiley, 1978.
Gharajedaghi, J. Systems Thinking: Managing Chaos and Complexity. Boston: Butterworth Heinemann 1999.
It is not the strongest of the species that survives, nor the most intelligent, but rather the one most responsive to change.
As individuals and as members of groups within organizations, we all experience losses and need to cope with change. Elizabeth Kübler-Ross provided the basic model for understanding and dealing with such change in her seminal 1965 book, On Death and Dying. Drawing on interviews with terminally ill patients, she identified a series of five common stages of grieving and adaptation: denial, anger, depression, negotiation, and acceptance. These insights are applied in the Change Grid model (Figure 7.18) by various change management experts.[109]
The Two Dimensions and Their Extremes. The Change Grid explores two key dimensions: Focus and Time:

Focus. Attention is placed primarily on the External world of relationships, events, and things or on the Internal world of feelings and ideas.
Time. Attention is directed primarily to Past events or Future possibilities.
The Four Quadrants. Adjusting to change as we move from Denial to Commitment takes time. The severity of the change and individual differences affect how quickly one will move through the cycle and return to normal balance. Resiliency is improved by focus, positive outlook, flexibility, organization, and proactivity:
Upper left: Denial. Our first reaction to negative news is disbelief and rejection. It may simply be too much to absorb. Recognition makes it somehow more real. Virginia Satir, author of Conjoint Family Therapy, describes this as a disruption of the status quo, which is uncomfortable and threatening. Anger is often expressed at this stage.
Lower left: Resistance. We go through a period of experiencing the loss more fully, feeling hopeless and powerless. Often this causes feelings of depression as we resist moving on to building new hopes and plans.
Lower right: Exploring. With the passage of time, we begin to think about the future again, exploring options for what can be. As William Bridges, author of Transitions: Making Sense of Life's Changes, has pointed out, we need to let go of the past and deal with endings before we are ready to start building a new future.
Upper right: Commitment. Commitment can occur only when grieving is complete and we emerge once again to participate more fully in the external world. This phase is both exciting and somewhat scary, making it wise to proceed incrementally and build in social support.
Method. The framework is useful for planning the introduction of change in human systems. It is also helpful for understanding and coping with the experience of change and adjustment:
Step 1: Diagnose. What stage are we at now?
Step 2: Understand. In the early phases, people need support and space to experience their fears and loss.
Step 3: Provide challenging support. At the appropriate moment, friendly challenge is often important as people prepare to experiment and explore somewhat risky thoughts and changes.
Step 4: Provide recognition. As people establish plans and invest in new activities, they need encouragement and recognition.
Kübler-Ross, E. On Death and Dying. New York: Scribner, 1997.
Satir, V. Conjoint Family Therapy. Science and Behaviour Books, 1983.
Bridges, W. Transitions: Making Sense of Life's Changes. New York: Perseus, 1980.
Learning must equal or exceed the level of change in a system for change to succeed.
An explosion in technology-driven organizational transformation has made change the new constant. The redesign of strategy, structures, and processes is only the first step in implementing change. Staff, partners, and customers must adapt to new approaches, methods, cultural norms, and equipment. This requires learning and practice. In many instances, unlearning is also necessary, as people must let go of habitual patterns and dependencies. Leaders need to anticipate the learning requirements when introducing change, and ensure that systems and support are adequate to ensure success (Figure 7.19).
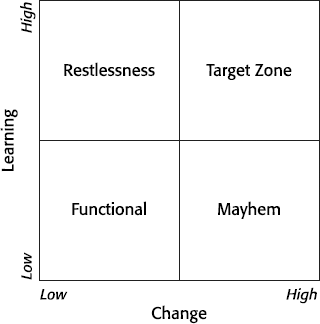
The Two Dimensions and Their Extremes. The Learning and Change matrix explores two key dimensions: Learning and Change:
Learning. This is the development of understanding and skills that enable new behavior and processes.
Change. This is the amount and rate of shifting in the organization that creates a demand for adjustment. Factors affecting change include competition, technology, structure, and process innovation.
The Four Quadrants. Change implies Learning. The ability to implement changes is restricted by the amount of learning you can generate. Each quadrant paints a different balance point with predictable consequences:
Upper left: Restlessness. When Learning outpaces Change, people become frustrated. They have invested time and effort to gain additional knowledge and skill, but they are not given the opportunity to put them to use. Organizations with this profile often lack strategic intent and the sense of purpose needed to provide meaning and urgency.
Lower left: Functional. There are few markets left where it is business as usual year after year. Change can be postponed but not avoided. By the time Change needs are recognized, the gap may be too large to bridge. Organizations in this quadrant are usually in some form of denial, representing a crisis waiting to happen.
Lower right: Mayhem. Chaos results when Change outstrips Learning. Sadly, this is an all-too-frequent organizational scenario. Adjustment needs and skill gaps are underestimated, and leaders naively hope that a plan and good intentions will carry the day. Learning takes time and commitment and needs to be included as part of the overall Change design.
Upper right: Target Zone. High levels of Learning and Change are characteristic of organizations with momentum and direction. These are often organizations in dynamic markets that are making the necessary adjustments and investing in future capabilities. The result is strategic preparedness and the ability to execute on plans.
Method. The framework is useful when considering changes to business strategy or operations. It quickly raises a helpful set of questions about the degree and nature of Change and Learning needed and the balance between these two processes:
Step 1: Conduct a Change audit. Determine the amount of Change needed and planned. Is it sufficient and well thought out?
Step 2: Conduct a Learning audit. Review existing plans and commitments for Learning. Are they adequate?
Step 3: Conduct a Learning and Change assessment. Locate the current situation on the Learning and Change matrix.
Step 4: Engage in preparedness planning. Make necessary adjustments to increase the likelihood of success of Change initiatives.
Saint-Onge, H., and Wallace, D. Leveraging Communities of Practice for Strategic Advantage. Boston: Butterworth-Heinemann, 2002.
Interactive methodology deliberately separates the process of defining a problem from the process of designing a solution.
The systems approach to organizational improvement consists of an iterative series of design and application cycles. In parallel with the changing phases of activity, a range of different orientations and skill sets is required to ensure that proper problem definition, design, and implementation occur. The four contributor types described here (Figure 7.20) are usually found in different process participants; however, flexible individuals are capable of adapting style to multiple requirements when necessary.

The Two Dimensions and Their Extremes. The Similarities and Differences matrix explores two key dimensions: Tendency to Find Similarities and Tendency to Find Differences:
Tendency to Find Similarities. This is a natural leaning toward integrating diverse elements, drawing on an ability to recognize similarities between seemingly unrelated matters. This is essentially a scientific orientation.
Tendency to Find Differences. This is the ability to see differences between apparently similar objects. It is an artistic orientation involved in creating structures, methods, and boundaries.
The Four Quadrants. Problem solving and design occur in a series of waves, calling on four sets of activity:
Upper left: Problem Solvers. Problem Solvers are integrative thinkers who find the commonality needed among issues and participants to achieve successful solutions.
Lower left: Doers. Doers are the practically minded practitioners who will carry out the visionaries' plans. They are pragmatic and pay attention to details, schedules, and reality constraints.
Lower right: Problem Formulators. Problem Formulators help to explore and expand on the situation, raising important questions leading to a well-defined and useful definition of the problem.
Upper right: Pathfinders. These are the leaders who are capable of seeing the big picture and putting situations into their proper perspective. They are holistic thinkers driven by a clear sense of purpose.
Method. Follow the steps below to deploy different kinds of individuals optimally in solving business problems and implementing solutions:
Step 1: Establish the problem-solving context, engaging the Pathfinders.
Step 2: Define the problem, engaging the Problem Formulators.
Step 3: Pursue an effective solution, engaging the Problem Solvers.
Step 4: Effectively implement the solution, engaging the Doers.
What processes are needed? How are they designed?
Process design is both a discipline and a perspective. As a discipline, it represents an approach and set of tools for mapping the steps in a value creation sequence. A talented and well-trained operations research specialist can identify inefficiencies in most systems and suggest process improvements that will save time and money. As a perspective, it converts social and business processes into sets of definable and measurable transactions, any of which can be adjusted or removed.
While commodities are fungible, goods tangible, and services intangible, experiences are memorable.
Why do a few dozen coffee beans cost roughly three dollars a cup at Starbucks, a dollar at a diner, ten cents if you buy a large can in the supermarket, and one penny if you purchase them from a grower in Colombia? It's the experience. Certainly Starbucks tries very hard to make sure its product is high in quality and to provide great service, but those reasons don't adequately explain why customers happily pay their prices. They're also buying a great coffee-consuming experience. In their book The Experience Economy, Pine and Gilmore delineate how experiences have become a fundamentally new type of offering in the marketplace, taking their place alongside traditional commodities, products, and services.
The history of economic development traces the evolution of value into higher, less tangible forms. In agricultural societies, value resided in the ownership of land. People toiled long hours to produce their own goods, food, and clothing from raw materials. During the industrial revolution, manufacturing defined economic value, and ownership of the means of production became the source of personal wealth. In the 1960s to 1980s, services emerged as the new engine of economic value. Far fewer people were employed in farming, raw material production, or manufacturing. Service businesses such as restaurants, retail, transportation, leisure, financial services, and health care now drove economic growth.
At each stage in this progression, the dominant output from the previous era is commoditized as the basic value and feature set become more readily available and harder to differentiate. In industry after industry today, the traditional product or service has become the platform for an owning or consuming experience that is pleasurable, memorable, and highly valued. Examples include experiential restaurants such as the Hard Rock Café, casinos such as New York, New York in Las Vegas, car brands such as Saturn and BMW, and Barnes and Noble bookstores. These businesses still deliver products and services to customers. However, their value extends well beyond the core offering to include customized, fulfilling, and memorable experiences. In Starbucks' terms, the coffee bean is the commodity, the can of coffee in the grocery store is a product, the cup of coffee at the diner is a service, and an orange and white chocolate frappucino at Starbucks, paid for with a Starbucks debit card and served up by a Starbucks barista with Louis Armstrong singing "What a Wonderful World" in the background, is the experience.
Experience is not the mere addition of entertainment value to a product or service. It means deeply engaging the customer in ways that are uniquely meaningful. Whereas raw materials, products, and services are all transactions that occur outside the buyer, experiences occur within the customer. When businesses talk of "delighting customers," they are describing a sensation they want customers to experience. The business payoff occurs when customers are willing to pay a premium for a product or service because of the experience associated with it. Figure 7.21 maps the different forms of customer experience.
The Two Dimensions and Their Extremes. The Four Realms of Experience matrix explores two key dimensions: Environmental Relationship and Guest Participation:
Environmental Relationship. Environmental Relationship describes the degree to which the guest unites with the experience. If the experience goes "into" the guest, as when watching TV, then the relationship is Absorptive. The experience is being brought into the mind. If the guest physically or virtually goes into the experience, as is the case with playing a video game, the relationship is Immersive.
Guest Participation. Guest Participation ranges from Passive to Active. Symphony or theater attendees are passive participants; they don't influence the performance. By comparison, skiers pay to be entertained and are active participants in their own entertainment.

The Four Quadrants. Consumers increasingly expect rich and engaging experiences to accompany their purchase of goods and services. In many cases, the experience itself is the thing being purchased. The Four Realms framework describes the various basic forms of experience:
Upper left: Entertainment. Passive and Absorptive experiences, such as hearing a story told around a campfire, are as ancient as civilization itself. These types of experiences still make up the bulk of the entertainment industry today. But increasingly, technology and affluence are opening up the opportunity to include other types of experiences.
Lower left: Esthetic. Esthetic experiences provide us with a deep, appreciative sense of the real, whether it is visiting a planetarium or a restaurant such as Rainforest Café where guests dine among tropical birds, waterfalls, thunder, and lightning. These businesses don't merely imitate the real world; they seek to provide an authentic experience of what it is like to be out under a nighttime sky or trekking through a tropical rain forest. They want guests to sense and feel deeply.
Lower right: Escapist. Escapist entertainments completely immerse the guest in the experience. Early examples include motion-ride simulators, games such as paintball, resort casinos, and on-line chatrooms.
Upper right: Educational. Unlike entertainment, learning and training require the active participation of students. Their minds or bodies must be engaged for learning to take place. Traditional education focused on the teacher as giver and the student as receiver. But that model is being supplanted in many instances by more user-centered, technology-enabled learning activities. Computer edutainment is merely the latest effort to tap into the inherently fun aspects of active learning. At for-profit learning centers and children's museums around the country, education is dispensed interactively as children try their hands at various exercises, games, and technologies in upbeat, information-rich environments.
The four realms of experience are not mutually exclusive. Indeed, employing several together is a recipe for creating more interesting and complete experiences. Cruise lines offer active, immersive sports as part of an escapist experience, Elderhostel offers education at the core of an esthetic vacation, and Land Rover educates customers on wilderness driving techniques with esthetic and escapist off-road expeditions.
Example: Experiential Retail. Many North American consumers have lots of money and not enough time, and they already own too much stuff. For them, the traditional mall is no longer the shopping mecca it once was. Its artificial environments and themed stores seem unnecessary and dated. The Galleria in Sherman Oaks, California, was a highly popular shopping destination in the 1970s and 1980s, but by the early 1990s, changing consumer tastes and a poor economy were taking their toll. The company that owned the property tore it down and replaced the enclosed mall with an open-air "downtown" that was the antithesis of mall artifice (Figure 7.22). Public plazas, street musicians, open-air cafés, trees, and fountains create a place for people to dine, stroll, and connect with one another. The amount of space devoted to food has increased (no time to cook!), and the space given to retail has shrunk (too much stuff!) as giant department stores, all selling essentially the same goods, are replaced by boutiques offering customized items and personalized experience. This trend is being repeated in dozens of shopping venues across the country. Rather than promise great product selection or bargains, the new "downtowns" offer experiences.
Another example is from the small town of Atchison, Kansas (population eleven thousand), where Mary Carol Garrity has designed one of the nation's most experiential retail stores. Called Nell Hill's, it offers home furnishings for upscale, discerning customers. People regularly drive two to three hours from Omaha, Kansas City, Topeka, and other towns to shop at Nell Hill's despite the inconvenience.
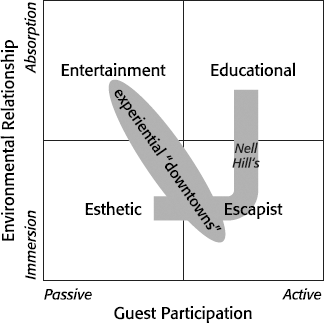
Why would anyone drive so far to visit a furniture store? For the experience. "If they are going to drive all the way from out of town to get here, then I'm going to make sure they're happy and see something they haven't seen before," says Garrity. Every eight weeks, the store is completely overhauled with new merchandise and displays of furnishings, antiques, paintings, and accessories. Garrity views the staff as "resources," there to help customers develop and achieve an interior design vision. It's common for customers to bring photographs of rooms in their home so Nell Hill's team can advise them on all aspects of design. Customers return again and again not merely to shop but to learn, to see great design, and to imagine. By staging a great experience with esthetic and educational elements and surprising "guests" with new things on each visit, Nell Hill's has transcended the limits of location to establish rewarding relationships with its clientele.
Context. The framework offers a method for envisioning how experiential components might enrich and extend an offering by adding a mix of Entertaining, Escapist, Esthetic, and Educational elements. The authors provide four sets of questions to help you start thinking in this direction.
Method. Consider the following questions, and place your answers in the appropriate quadrants:[113]
Step 1: Consider Esthetic features. Esthetics make your guests want to come in and spend time with your product or service. What can be done to make your environment more inviting and comfortable for guests?
Step 2: Consider Escapist features. Escapist elements draw your guests further into your experience. What could you offer to encourage them to become active participants in the experience?
Step 3: Consider Educational features. Education is active. What do you want your guests to learn from the experience? What information and skill acquisition opportunities attract them?
Step 4: Consider Entertainment features. Entertainment holds your attention with humor, drama, and surprise. What amusing or narrative elements can you add that would encourage your guests to stay? How can you make their experience more fun?
Pine, B. J. II, and Gilmore, J. H. The Experience Economy. Boston: Harvard Business School Press, 1999.
Supply chain design is the process of choosing which capabilities in the chain a given firm will try to control and which it will outsource.
Make-versus-buy decisions are a key dilemma for modern manufacturers. Keeping all production activities in-house typically requires too much time, space, money, and management attention to be an effective strategy. Firms often lack the internal capability to make certain components of a product, or they discover that outside suppliers offer superior pricing or quality. This is particularly true when the components in question are standardized or available from a large number of suppliers. The key forces that drive firms to outsource the production of components or entire products are a lack of capability, lack of competitiveness, and need for quality.
Companies should also retain some activities within the boundaries of the firm, particularly those that have to do with important competitive knowledge and customer visibility. In the book Clockspeed, Charles H. Fine presents a Make-versus-Buy decision matrix that boils this decision down to two key considerations: Dependency (on suppliers) and the relative modularity of the components (Supply Items) that go into the product (Figure 7.23).
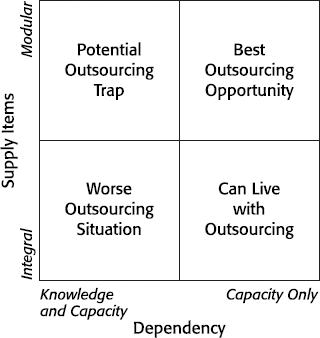
The Two Dimensions and Their Extremes. The Make versus Buy matrix explores two key dimensions: Supply Items and Dependency:
Supply Items. Supply Items are the components that go into a finished good. A supply item is Modular if is not indispensable to the overall performance of the product and can be produced at an acceptable cost and level of quality by other firms. For automobiles, Modular products include such items as door handles and light bulbs. Integral products, by contrast, are those in which elements are specifically designed to work with other pieces. Integral products in automobiles might include interiors and drivetrain components. Engine parts from a Chevrolet V-8 won't work in a Toyota 4-cylinder motor. Products in which many components are Modular and interchangeable, such as personal computers, have a Modular product architecture. Products in which most of the components are specifically designed to work with all of the other components to achieve performance goals, such as racing motorcycles, are said to have an Integral product architecture.
Dependency. One can be dependent on suppliers for Production Capacity or for Knowledge and Capacity. In the case of Capacity, the firm knows how to make the product but saves money or time through outsourcing. Knowledge refers to specialized abilities in design, manufacturing, or integration of components. In the case of Knowledge Dependence, the firm lacks the skill to design or make the product.
The Four Quadrants. The Make versus Buy matrix helps to evaluate opportunities and costs of outsourcing in a structured and systematic way:
Upper left: Potential Outsourcing Trap. Being dependent on partners for Knowledge and Capacity is dangerous in situations where suppliers can obtain the same modular parts available to the manufacturer. This happened to IBM with the personal computer, and the result was loss of a market that IBM created.
Lower left: Worse Outsourcing Situation. In this case, the product is Integral to performance, but the company has little understanding of its design or manufacture. Generally, companies should avoid this level of supplier dependency.
Lower right: Can Live with Outsourcing. In this situation, the components are ones that are Integral to performance but may be outsourced. Ideally, the component can be obtained from several sources so that the company is not locked into a single supplier. If it is a component that does not offer a specific competitive advantage by itself, then outsourcing may save time and resources. Toyota, for example, outsources some of its manufacture of transmissions even though it clearly has the knowledge and resources to perform this function in-house.
Upper right: Best Outsourcing Opportunity. The best manufacturing components to outsource are those that do not offer any competitive advantage by themselves. Ideally, these are non-Integral items that are available from multiple sources. Outsourcing in this instance enables the company to devote more resources to other areas of competitive advantage.
Method. The object is to determine where the best outsourcing opportunities lie and where the current supply strategy may be vulnerable:
Step 1: Analyze supply products and services. Separate key components of production into two groups: Modular and Integral.
Step 2: Assess dependencies. Examine the items you currently outsource. For each one, ask if you are dependent on the supplier for Capacity or for Knowledge and Capacity. Place each item in the proper quadrant of the matrix.
Step 3: Draw conclusions about your current outsourcing decisions. Which components that you now manufacture represent good outsourcing opportunities? Which components that you outsource now represent supplier dependency risks?
Fine, C. H. Clockspeed: Winning Industry Control in an Age of Temporary Advantage. Boston: Perseus Books, 1998.
[Groupware] is a co-evolving human-tool system.
Two facts are clear in today's economy. First, the ability to create and manage knowledge is any organization's main source of competitive advantage. Second, almost all value is created collaboratively; very few of us are individual actors on the economic stage. The Four Square Model (Figure 7.24) is a taxonomy of collaboration and communication technologies that inspires us to deeper thinking about the tools that support collaborative value creation.[116]
The term groupware typically describes multiuser software that enables computer-supported cooperative work. In his Four Square Model, Bob Johansen, president of the Institute for the Future in Menlo Park, California, takes an expansive view of groupware as the set of physical, technological, and cultural tools that help collections of individuals become high-performing teams. This includes not only software but also the design of work spaces and the overall company culture and approach to teamwork. The model has proven helpful in considering the design of other computer-enabled communication activities, such as long-distance learning.

The Two Dimensions and Their Extremes. Time and Space are two basic dimensions all teams must work around:
Time. Individuals may occupy the Same or Different points in time.
Space. Individuals may share the Same physical space or be in Different locations.
The Four Quadrants. Some taxonomic matrices include a fifth cell that is a hybrid of the other four types. In this case, the Anytime Anyplace option is a superset that integrates collaborative knowledge and communication approaches from the four main quadrants:
Upper left: Different Time, Same Place. People are collaborating in the same spaces in the office but at different times during the day. Examples are team meeting rooms and bulletin and message boards.
Lower left: Same Time, Same Place. This includes traditional face-to-face meetings using tools such as conference rooms, white boards, and video equipment, as well as what might be called informal groupware—unscheduled communications that take place in hallways and common areas.
Lower right: Same Time, Different Place. Electronic meetings using presentation technologies such as shared presentations, conference calls, and videoconferences fall into this category. It also includes impromptu communications technologies such as instant messaging.
Upper right: Different Time, Different Place. Asynchronous communications such as e-mail, voice mail, shared calendaring, and scheduling enable different time and place collaboration. These create new opportunities for collaboration, speeding decision cycles and organizational responsiveness.
Center: Any Time, Any Place. Firms need to shorten the time between identifying and meeting customer needs. Many corporations are beginning to support staff and customers around the world on a 24–7 basis to do this. Computer technologies are key to coordinating and integrating all four modes of groupware. Organizational cultures that empower teams are equally important.
Method. The Four Square Model suggests methods for evaluating and improving groupware fitness. As a test, try the following exercises:
Step 1: Describe. In each quadrant, write up to three examples of the kind of groupware your department uses. Include reference to office layouts or corporate cultural practices as well as technologies.
Step 2: Assess. To what degree are each of the four groupware options being well or poorly deployed?
Step 3: Improve. What opportunities exist to support more effective collaboration?
Johansen, R., Charles, J., Mittman, R., and Saffo, P. Groupware: Computer Support for Business Teams. New York: Free Press, 1988.
All competitive advantage is temporary.... The shorter the industry clockspeed, the shorter the halflife of competitive advantage.
Clockspeed refers to the rate at which companies and industries evolve. An industry's clockspeed is somewhat analagous to an organism's metabolism. Inspired by the way biologists study fast-reproducing fruit flies in order to understand genetics better, Charles Fine studied high-clockspeed industries to learn how products and processes mutate and competitive advantage evolves over time. His findings are presented in the book Clockspeed.
Fine's research focused mainly on three dimensions of clockspeed: process, product, and organization. Fast process clockspeeds are found in industries such as medicine and semiconductors, where new manufacturing processes are introduced as frequently as every eighteen to twenty-four months. Product quality is highly dependent on a firm's ability to master and implement expensive new production processes quickly. By contrast, slower process clockspeeds are found in areas such as automotive manufacturing, where a particular engine-building process may stay in place for decades.
Fast product clockspeeds are common to fields such as entertainment, publishing, and on-line media, where the product literally can change daily. Contrast this with aircraft manufacturing, where designs that are three decades old continue to be built. Organizational clockspeeds reflect the overall pace of change and decision making in organizations. Clockspeeds typically speed up as one gets closer to the customer. Manufacturing plans must be made years in advance. Decisions in retail are made daily, weekly, and monthly. Fine calls this "clockspeed amplification" (Figure 7.25).

The notion of clockspeeds can be applied to more than product and process architectures. One can think of one's distribution channel or customer base as having clockspeeds as well. The film industry has witnessed major changes in distribution channels over the past three decades; small local theaters were eclipsed by regional megaplexes; the broadcast networks were augmented by cable, satellite, and now the Internet; and new storage technologies created a retail distribution network for movies that never existed before videotape. Each change eroded a previous competitive advantage and created new winners and losers. The distribution of film seems to operate on a clockspeed of major changes once every decade or two.
Through his study of fruit flies, as well as large firms in automotive, high-tech, and other fields, Fine developed rules of industrial evolution. Both products and supply chains evolve over time, cycling between periods of vertical integration and horizontal modularization. However, unlike natural organisms, businesses evolve intentionally. Managers must choose which competitive threats to meet, which new knowledge and capabilities to add to their organization, and which to forgo. The double helix models how industries oscillate between these two states (Figure 7.26).

During periods of high integration, industries tend toward a few dominant firms with vertically integrated supply chains. The product architectures are integral, meaning the components are not interchangeable with products from other competitors. Think of the early computer industry. Most products were integral (DEC's software wouldn't run on IBM computers, for example), and the companies were vertically integrated. IBM and each of its competitors made the bulk of their own products and components: chips, computers, operating systems, applications, storage.
On a highly integral product like a military aircraft, every part and system has been designed to perform a specific task. By comparison, today's PC circuit board is built with mostly off-the-shelf modular components.
Many industries start out in the horizontal-modular mode and switch to vertical-integral as the product category matures. In the automotive field, there were hundreds of producers in the late 1800s. Few companies made complete engines and drivetrains, and it was common for many builders to buy these components from other manufacturers. But innovations in design, manufacture, and financing led to rapid consolidation. By the 1920s, it was clear that vertically integrated firms would rule the industry. Today, Fine suggests, the industry may be at the beginning of a new horizontal-modular stage.
This cycle is repeated again and again, pushed along by industry clockspeeds. Once an industry is vertically integrated, pressure to disintegrate builds as niche players create increasing competition, and the organizational rigidity associated with long market dominance sets in. At that point, an industry switches to a horizontal-modular structure. Modular product architectures with standardized interfaces enable many competitors to supply components. This leads rapidly to product commoditization and further horizontalization.
Once an industry is fully horizontal and modular, pressures for reintegration begin to build. New technical advances give power to companies that control crucial supply chain components. Since even major subsystems are decomposable into commodity components, suppliers begin to exert power by bundling, snatching profits from other levels of the supply chain. Enormous profits earned by the larger players are reinvested to fund consolidation. Forces for reintegration are in evidence today in many areas of computer hardware and software, as well as telecommunications.
Fine urges business leaders to think in terms of designing capability chains—managing the competencies underlying all of the organizations in a supply chain. In this way, executives can create the flexibility and skills needed to exploit one temporary competitive advantage after another.
The Two Dimensions and Their Extremes. The Product and Supply Chain Architecture matrix (Figure 7.27) explores two key dimensions: Product Architecture and Supply Chain Architecture:

Product Architecture. Product architectures may be Modular or Integral. Integral product architectures, typified by autos, racing motorcycles, and medical equipment, are those in which each component contributes directly and specifically to overall performance. Parts and interfaces tend to be proprietary. Modular product architectures use standard interfaces and can employ off-the-shelf components for much of assembly. Personal computers, clothing, and many other products employ modular architectures.
Supply Chain Architecture. Integral supply chains require vertical integration within a primary firm or tight coupling of several firms in order to meet demanding, proprietary design specifications. Modular supply chain architectures are horizontal, with many competing firms specializing in aspects of the overall product.
The Four Quadrants. Integral Product architectures and Integral Supply Chain architectures are a natural fit, as are Modular-Modular combinations. Mixed Product and Supply Chain architectures are less frequent but still occur:
Upper left: Integral-Integral. Products and components are specifically designed to work with the each other to enhance overall performance. In businesses such as automotive, medical equipment, and furniture, products follow Integral architecture. Toyota has been the premier manufacturer in automobiles for two decades. It tightly controls the manufacture of integral components, outsourcing only when products become commoditized, and then sparingly.
Lower left: Modular-Integral. Mixed Product and Supply architectures are less likely than matched ones for a good reason. If your Product is highly Integral, there is less likely to be a vigorous market of suppliers. However, as one moves closer to customers, the need for Integral Supply Architectures increases, sometimes forcing an Integral Supply Architecture on products that are modular. The Zara clothing chain responds to trends quickly by making many of its clothes at its factory in Spain, enabling it to deliver new styles in days rather than months. Most of the apparel industry in North America and Europe outsources manufacturing, frequently to overseas firms.
Lower right: Modular-Modular. Apparel, telephones, and personal computers are products with modular architectures and modular supply chains. However, hybrid architectures abound. The automotive business is highly vertical but has always had a strong Modular aspect in its after-market business, where thousands of suppliers vie to deliver parts with relatively standardized interfaces such as lights, tires, wheels, and spoilers. Dell's Modular supply chain relies partly on suppliers situated very close to its Texas assembly plants, mimicking some of the communications advantages of a tightly coupled, vertical, integral architecture.
Upper right: Integral-Modular. Fine suggests that integral products with modular supply architectures are rare. When BMW started building cars in the United States, it found that its suppliers were not used to the tight integration and rapid design iterations that it practiced in Germany. It had to alter its processes, creating a more modular supply chain in the United States.
Example: Schwinn Bicycle Company. The transition from horizontal to vertical to horizontal product and supply architectures has occurred many times in many industries (Figure 7.28). In the mid-nineteenth century, bicycles were hand-built by small craft shops in Europe and the United States. Hundreds, if not thousands, of firms supplied parts to bike builders. In the early twentieth century, the industry started to consolidate. By World War II, Schwinn, the dominant firm, began making more and more of its own components, completing the vertical integration of the industry. Schwinn dominated until the 1970s, when mountain bikers and long-distance cyclists began making their own performance parts. As dozens of small firms pushed the envelope of bicycle performance, Schwinn began falling behind in product innovation. The company completely missed the significance of new trends in biking that would end the vertical-integral structure of the market. Today, the industry is highly modular, with a wide variety of parts suppliers and a fragmented retail market. The Schwinn company, which once dominated 70 percent of the North American market, rode into bankruptcy in 1992.

Context. Products, processes, and capabilities should be designed in concert to optimize customer responsiveness and agility throughout the capability chain. Product and Supply Chain Architectures need to be analyzed within the context of the clockspeed and double helix concepts.
Method. Follow the steps below to conduct a high-level analysis of Product and Supply Chain architecture compatibility:
Step 1: Assess Product Architecture. Is your product designed with a modular or integral architecture? How does it compare to similar products in your industry?
Step 2: Assess Supply Chain Architecture. Is your Supply Chain Architecture modular or integral? Is it more or less modular or integral than competitors?
Step 3: Consider design implications. Is the trend within your industry toward more Integral products and architectures or toward more Modularity? Review the implications of your Product and Supply Chain Architectures in the light of industry trends.
Fine, C. H. Clockspeed: Winning Industry Control in an Age of Temporary Advantage. Boston: Perseus Books, 1998.
Visible design is a failure. The only good computer is an invisible computer.
As the former chief scientist for Alias Software and SGI and a computer sciences professor at the University of Toronto, Bill Buxton has devoted much of his life to solving thorny problems related to human-computer interaction. Over the years, he has published extensively on interface design, collaboration, and the social impacts of ubiquitous computing. His Telematics matrix (Figure 7.29) is a usage-based taxonomy of human-to-human and human-to-machine communications. The software industry has devoted most of its effort to overt foreground communications, tasks such as document creation and e-mail, and ignored the deeper and equally important background processing that accounts for the majority of communications. By examining communication activities in this way, the framework provides a new strategic context for making research and design decisions.
Buxton calls himself an inveterate taxonomist. His Telematics matrix has a virtue that he says is common to all great models: it reveals with "surprising obviousness" what we feel we've known all along.[119]
The Two Dimensions and Their Extremes. The Telematics matrix explores two key dimensions: Object of Communication and Ground of Communication:

Object of Communication. Human-Human Communication includes all the direct, indirect, formal, and informal methods we use to share and glean information from one another. Human-Computer Communication includes the kind of document creation work we do at the computer, as well as entertainment.
Ground of Communication. Foreground Communication is that in which we consciously engage. In the Background are all communications that occur without our direct attention. Examples include news that a coworker overhears from an adjoining workstation or the awareness of a parent who is watching TV but keeping one ear tuned to the children's room.
The Four Quadrants. The Telematics framework helps us to identify and improve four different classes of communication:
Upper left: Direct Communication. Most computer and communications technology extends our reach and removes the barrier of distance in human-to-human communications. This category includes conscious, front-of-mind activities such as dialogue or attending a lecture.
Lower left: Graphical User Interfaces. Text or graphical user interfaces are the traditional interface design for personal computers, games, and other communications machines. Many software products today directly facilitate this type of communications.
Lower right: Smart Homes and Environments. Smart houses and network-connected medical monitoring devices are two examples of environmental communications technology. Designing machines so that they respond to our state and not just our conscious input is an enormous challenge.
Upper right: Portholes and Glances. Humans are great at simultaneous background processing. We can listen to the radio, cook dinner, and coo at the baby all at the same time. Computers are slow by comparison, often needing to focus on foreground tasks to make headway. This type of computing is largely ignored by today's software, but that will change in the future.
For several years, researchers at Xerox have been experimenting with software for background human-to-human communications. Group awareness tools called Portholes and Glances provide useful real-time information and cues about the availability of colleagues to members of physically distributed work groups.[120] Portholes consist of small, still images of team members in a corner of one's computer screen. Images are refreshed every five minutes. Glances are more active, providing users with an electronic analogue of strolling down a hallway and glancing into other people's offices.
Method. The ideas in the Telematics matrix require us to rethink how software addresses human communications. The framework is helpful in the context of improving collaboration or customer experience. Try this experiment:
Step 1: Diagnose. List up to three types of communications activities that occur inside your business today for each quadrant of the matrix.
Step 2: Envision. Could collaboration be enhanced by software that more closely resembled natural human communications? Pay special attention to the two styles of background communications.
Step 3: Plan. Select the best opportunities to improve communication, and discuss the related software requirements.
Buxton, W. "Integrating the Periphery and Context: A New Model of Telematics." In Proceedings of Graphics Interface. San Francisco: Morgan Kaufmann, 1995.
Executives who wish to make their organizations better corporate citizens face significant obstacles.
Social responsibility is defined as the obligation of management to engage in activities that improve social welfare and the interests of organizations. Corporate social responsibility (CSR) activities typically include compliance with laws and regulations, innovative employee benefits, handling of ethical issues, and charitable projects that may add to social as well as corporate value.
Most corporations and executives would like their corporations to be good citizens; however, they face structural obstacles to implementing initiatives. Companies that spend on activities that rivals forgo risk undermining their competitive position (see "The Prisoner's Dilemma" in Chapter Eight). By cooperating too closely with government, they may inadvertently invite more government oversight, limiting strategic options. If they pay too much in employee salaries and benefits, they may end up driving jobs to competitors or countries with lower wages and fewer employee protections.
The Virtue matrix (Figure 7.30) was developed at the Aspen Institute in Colorado as part of its Initiative for Social Innovation Through Business.[122] It both explains the drivers of CSR and the dilemmas that arise when firms undertake socially responsible behavior. We have adapted the model to fit the format of this book.
The Two Dimensions and Their Extremes. The Virtue matrix explores two dimensions: Degree of Normalization and Corporate Social Responsibility Behavior:

Degree of Normalization. Socially responsible behavior can be predicated on widely accepted norms, such as providing health benefits or a safe working environment, or it can represent emerging concerns for which there are no defined norms. Examples of emerging issues include more transparent corporate reporting and support for nontraditional family arrangements. An example where there are no set norms is the issue of how companies handle corruption and bribery in developing countries.
Corporate Social Responsibility Behavior. CSR behavior may be mostly Voluntary, or it may be Prescribed to the extent that it is mandated, defined, or limited by structural, legal, or regulatory barriers.
The Four Quadrants. Tension in this framework resides not only between the two axes but also between the upper and lower halves of the matrix. The lower half is called the Civil Foundation of CSR, which comprises common practices, such as providing employee benefits, and mandated behaviors, such as laws to protect workers. The upper half is the Frontier, where innovations in social responsibility occur. The line between the Civil Foundation and the Frontier is a fluid boundary, changing in response to economic conditions, social norms, and government regulation. In developed societies, for example, the scope of Civil Foundation has moved steadily upward as corporations and governments have become responsible for providing an array of basic social benefits. Countering this, many critics contend that the globalization of work creates pressure pushing the Civil Foundation threshold downward, as economic activities migrate to countries with lower wages and fewer environmental protections.
CSR adds intrinsic value when it benefits employees, customers, and the public at large. It may also enhance corporate performance, as in the case of the Body Shop, which turned socially responsible practices into its main marketing message. Its promise is that when you buy products at the Body Shop, you are helping the environment and the economies of developing nations. CSR adds instrumental value when it clearly benefits shareholders.
Upper left: Strategic Frontier. These are innovations in social responsibility—new categories of socially responsible behavior that arise due to changing social needs. Providing benefits to domestic partners of homosexual employees is an example of an activity in the Strategic Frontier. It is not yet a social norm in North America but is becoming more widespread. Its main benefit is intrinsic, extending coverage to loved ones in a way that suggests fairness to all employees. A growing number of companies have decided that the benefits of such actions outweigh the costs. As more companies adopt the practice, it becomes a recruiting and retention tool that generates goodwill and over time may migrate downward to the Civil Foundation.
Lower left: Civil Foundation/Choice. Most socially responsible actions are undertaken by corporations because the benefits outweigh the costs. Activities that are widely practiced become the norm. Examples include support for local charities, which engenders goodwill in the community.
Lower right: Civil Foundation/Compliance. Compliance includes all of the mandatory regulations and laws that govern socially responsible behavior. Shareholder interests as well as social interests are served when companies abide by laws governing such issues as worker safety, financial reporting, and sexual harassment. Although a single company might gain temporary advantage through occasional noncompliance, as when environmental regulations are skirted, such behavior usually carries enormous costs for shareholders if it comes to the light.
Upper right: Structural Frontier. Some activities clearly benefit society more than shareholders. For example, if a firm decided to install equipment that exceeded required environmental standards, it might create a higher cost basis than competitors, with no offsetting revenue gain. Since CEOs report to shareholders, there are structural barriers to engaging in this type of intrinsically valuable behavior. In one celebrated case, Aaron Feuerstein of Malden Mills in Lowell, Massachusetts, paid his workers for months after a fire destroyed his textile factory, even though he had no legal obligation to do so. Then he rebuilt the factory in the same location rather than moving abroad, as most financial advisers suggested. However, Feuerstein controlled a closely held corporation. Few public CEOs could afford to be so generous. Feuerstein's efforts came to naught as the firm eventually went bankrupt. It has since been revived, with Feuerstein owning a tiny minority of stock.
Issues in the Structural Frontier typically become norms only if and when behavior is made mandatory through laws or regulations. For example, countries ratifying the Kyoto Protocol on environmental standards will likely trigger mandates for new corporate behavior.
Context. The Virtue matrix provokes us to think more deeply about what should and does generate socially responsible conduct. It is useful for improving discussion and clarity of CSR issues, and for finding better ways to integrate shareholder and social benefits.
Method. Follow the steps below to conduct a high-level analysis of your organization's social responsibility agenda:
Step 1: Diagnose. Make a list of the main areas of socially responsible activities within the firm, and place them in the appropriate quadrants of the matrix. Include such areas as employee benefits, environmental protection, government-mandated reporting, and charitable activities.
Step 2: Envision. Identify any new or proposed CSR activities that the firm is contemplating. Place these on the matrix using a different color.
Step 3: Examine implications. Consider implications for your business of the following two questions. How would undertaking proposed CSR activities ultimately benefit the firm? Are the main drivers of CSR coming from the Strategic or Structural Frontier?