
Chapter 10
Multimodal Interaction in Biometrics: Technological and Usability Challenges
Norman Poh1, Phillip A. Tresadern2 and Rita Wong3
1Department of Computing, University of Surrey, UK
2University of Manchester, UK
3University of Surrey, UK
10.1 Introduction
In our increasingly interconnected society, the need to establish a person's identity is becoming critical. Traditional authentication, based on what one possesses (e.g., token/access card) or what one knows (password), no longer suffices. Biometrics, described as the science of recognizing an individual based on his/her physiological or behavioral traits, which is effectively based on what one is, offers an important solution to identity security. Since unimodal biometric systems have their own limitations, a multimodal biometric system is often needed. This provides an excellent case study for multimodal interaction.
In this chapter, we report the technological design and usability issues related to the use of multimodal biometrics in various applications, ranging from their use in large-scale multi-site border controls to securing personal portable devices.
In the context of the Mobile Biometric project (MOBIO), we combine face and voice biometrics for secure, yet rapid, user verification, to ensure that someone who requests access to data is entitled to it. In addition, we also report our experience of empowering blind users to use the face as biometrics on their mobile device. In order to help them capture good quality face images, we designed an audio feedback mechanism that is driven by an estimate of their facial quality and usability of the technology by blind users.
10.1.1 Motivations for Identity Assurance
Questions of the following sorts are posed everyday and everywhere: “Is (s)he really whom (s)he claims to be?”; “Is (s)he authorized to access this premise/resources/information?”; and “Is (s)he a person that the authority seeks?” Traditionally, a person's identity is routinely verified using a driver's license, passport, or national identity document. Access to guarded resources is granted if the person knows his/her password or PIN number. A token- or password-based means of authentication can be easily compromised through increasingly sophisticated techniques deployed by criminals. This has caused significant economic loss, as well as loss of trust in our modern society. For instance, according to the Javelin Strategy & Research report1 in the US, identity fraud caused a lost of USD 21 billion in 2012, while in the UK, this is estimated to be GBP 1.3 billion. Business across the world could lose USD 221 billion per year due to identity fraud. The need for reliable user authentication techniques is paramount.
10.1.2 Biometrics
Increasingly, biometrics has gained widespread acceptance as a legitimate method for determining an individual's identity. Today, the security of border controls are enhanced by using iris, face, and/or fingerprint alongside travel documents. However, using one biometric system alone is often not sufficient. Unimodal biometric systems have to contend with a variety of problems such as noisy data, intra-subject variations, restricted degrees of freedom imposed during the acquisition process, non-universality (i.e., not everyone can provide fingerprints with clear ridges), spoof attacks, and unacceptable error rates for some users [1]. The noise is due to altered appearance of the biometric trait (e.g., voice modified by a cold), imperfection of the sensor (e.g., dirty sensor) or the environment in which the sensor acquires a biometric trait (e.g., face images affected by the lighting conditions).
One way to improve the robustness of the system is to use multimodal biometrics. Because different biometric modalities are affected by different sources of noise, the use of multimodal biometrics often result in a significant gain in performance, compared to any unimodal biometric systems.
10.1.3 Application Characteristics of Multimodal Biometrics
There are a number of application-related criteria that require a multimodal biometrics solution; these are listed below.
- Enrolment requirements: When a biometric technology is rolled out in a large scale – for instance, at the population level – one has to consider multiple biometric modalities. This is because a small fraction of the population of users may not be able to provide usable fingerprints, due to work or health-related reasons or handicap. For example, people who do not have a right arm cannot provide the fingerprint of any of the right fingers. For this reason, large-scale biometric projects such as United States Visitor and Immigrant Status Indicator Technology (US-VISIT) and Unique Identity (UID) project have to consider multiple biometric modalities to ensure that the technology can be used by all users in the target population. The US-VISIT program requires that every visitor to the United States must provide fingerprint images of left and right index fingers and a facial image at their port of entry, whereas the UID project uses fingerprint, iris, and face biometrics [2].
- Risk and viability of spoofing: In applications involving critical infrastructures, where the risk of intrusion is significant, multimodal biometrics may be used. Because several biometric traits are involved, spoofing or forging all the biometric modalities of a victim in order to gain illegitimate access to the facilities will be very difficult. Biometric modalities such as finger vein and iris are difficult to collect and, hence, harder to spoof. Incorporating these modalities, along with other biometric modalities, could deter spoof attacks aiming at the biometric sensors. However, recent studies [3, 4] show that, even though the risk of spoof attack is reduced, a multimodal biometric system can still be vulnerable to spoof attacks. This is because if one or more biometric sub-systems are compromised, then the performance of a multimodal system will be adversely affected.
- Integrity requirements: Once a user has been successfully authenticated and granted access to a secure resource, it is often desirable to ensure that the same user actually uses the system. For this reason, a continuous, non-intrusive authentication solution is often required after the initial authentication. For instance, in logical access control, where the end-user logs on to a secure resource, the terminal which the user uses will attempt to continuously authenticate the user. This prevents an attacker from accessing the system while the genuine user is momentarily absent. This line of research was reported in Altinok and Turk (2003) [5] using face, voice, and fingerprint; and in Azzini et al. (2008) [6] and Sim et al. (2007) [7] using face and fingerprint modalities. Niinuma and Jain (2010) [8] used the face modality as well as the color of the clothing to enable continuous authentication. The latter information is most useful when the face is not observable.
- Accuracy requirements: One of the most demanding applications that justifies the use of a multimodal biometric system is negative identification or record deduplication. The objective here is to prevent duplicate entries of identities. Unlike positive identification, negative identification ensures that a person does not exist in a database. Examples of the application are to prevent a person claiming social benefits twice under different two different identities; or to prevent blacklisted workers from entering into a country. While ten finger biometric and photographs can ensure de-duplication accuracy higher than 95%, depending upon quality of data collection, adding the iris modality could boost the accuracy to as high as 99% [2].
-
Uncontrolled environment: While most biometric applications require user cooperation, there is a niche application where the cooperation of the users is not required nor desirable. The line of biometric research addressing this problem is called non-cooperative biometrics. Typically, the subjects can be several meters away from the sensor and may not be aware that they are under surveillance. The biometric sensor continuously tracks and recognizes all subjects passing by a strategic location. For this application, several biometric modalities or visual cues are often required, but the actual recognition mechanism may rely only on one or two biometric modalities that are usable. Li et al. (2008) [9] used a wide field-of-view (FOV) camera coupled with two narrow FOV cameras to track a subject for maritime surveillance. If the wide FOV camera detects a human silhouette, one narrow FOV will be activated to zoom into the person's face and the another will attempt to acquire the person's iris.
In a forensic application, Nixon et al. (2010) [10] proposed to combine gait and ear to recognize a criminal. Because criminals often attempt to evade their identity by disguise or concealment, gait is often the natural biometric candidate that is available. At the same time, the ear shape hardly changes over time, thus making the combination of gait and ear a potentially useful forensic tool for identity recognition under a non-cooperative scenario such as forensics surveillance.
In our own research, we addressed the issue of biometric authentication using general-purpose mobile devices equipped with a microphone and a camera. This field, referred to as “mobile biometry”, has a significant practical application, because the biometric system can prevent other people from accessing potentially highly private and highly sensitive data such as that stored in a mobile phone. Furthermore, the biometric system can also be used as an authentication mechanism for electronic transactions. This would add significantly value and trust to transaction services.Our own study [11] shows that combining talking face images with speech recorded simultaneously lead to a better authentication performance than using any biometric modality alone. All the three examples above show that multimodal biometrics is instrumental in enabling identity recognition in uncontrolled environments.
10.1.4 2D and 3D Face Recognition
One of the most ubiquitous biometric modalities is arguably the face. Even before photography became common, drawn facial portraits had already been used for wanted criminals. Alphonse Bertillon invented a criminal identification system in 1882, now, known as the Bertillion system, that takes anthropometric measures, as well as a mugshot of face images.
Today, cameras are already equipped with face detection capability. Facebook provides a face-tagging service which automatically recognizes the face of a person in an uploaded photograph. Its face recognition engine, formally provided by Face.com but now is part of Facebook, can recognize images in highly unconstrained environments [12]. For this reason, and the fact that most mobile devices are installed with face recognition software, we also provide a brief discussion of automatic 2D and 3D face recognition in this section.
The process of face recognition normally involves three main stages: detection, feature extraction (dimensionality reduction) and classification (storage). The detection stage typically involves facial localization and normalization in order to handle viewpoint and lighting changes.
The face recognition technology can be categorized by the type of sensor used, which can be based on image sensors, video cameras, and depth sensors. 2D face recognition is by far the most common type of face recognition. Image sensors such as digital charge-coupled device (CCD) or complementary metal-oxide-semiconductor (CMOS) active pixel sensors can be produced cheaply and are small enough to fit inside every personal device.
Early 2D facial recognition algorithms are based on holistic approaches such as principal component analysis (PCA) – the image representation of which is known as Eigenfaces; or, linear discriminant analysis (LDA) – the resultant facial representation of which is known as Fisherfaces. Although the results are satisfactory, they lack robustness, since they all suffer from the common 2D drawbacks due to high variation in images.
Consequently, parts-based methods are consequently used [13]. These methods break up images into local regions or components, so that recognition is done by parts. The component-wise results are then subsequently combined to form the final output hypothesis.
Video-based face recognition research [14, 15] extends 2D face recognition by considering multiple images taken consecutively in time, in order to eliminate the uncertainty that is present in a single 2D face image. Although frame-based face recognition methods using temporal voting schemes is common, more powerful methods aim either at combining hypothesis derived from the image frame level, or at obtaining images with a higher resolution than any of the single images. The latter technique is called superresolution for face recognition [16].
Another attempt to overcome geometric distortion due to head pose is to warp an off-frontal image to a frontal view via image warping. An advanced approach to do so is the Active Appearance Model (AAM). An AAM composes an image of interest into a shape and textual (appearance) model. When applied to facial images, interest points are often manually marked around a face image, so that the facial features are tracked over time. Facial images that are not frontal can be warped to a frontal one, thanks to the tracked points. The resultant warped image often produces better recognition performance than an original off-frontal one.
Inspired by AAM, this line of research exploits 3D models for 2D face recognition. The pioneering work of Blanz and Vetter (1999) [17] proposes a 3D morphable model that enables a 3D model to be fitted on a 2D image, so that a face image can be re-rendered in any viewpoint. This has vastly improved unconstrained 2D face recognition. A variant of this method was reported by Face.comTM (now part of ![]() ) which makes it possible to recognize faces from any arbitrary viewpoint.
) which makes it possible to recognize faces from any arbitrary viewpoint.
The recent introduction on the market of the ‘2.5D’ ![]() sensor opens a new era for human-computer interaction and, implicitly, for face recognition. Its software development kit, known as Kinect Identity, enables instantaneous face recognition of the players in real time. The sensor provides both depth information and also a visible image that are always aligned and synchronized. This makes it possible to implement 4D unconstrained face recognition [18] that involves 3D data along with time.
sensor opens a new era for human-computer interaction and, implicitly, for face recognition. Its software development kit, known as Kinect Identity, enables instantaneous face recognition of the players in real time. The sensor provides both depth information and also a visible image that are always aligned and synchronized. This makes it possible to implement 4D unconstrained face recognition [18] that involves 3D data along with time.
10.1.5 A Multimodal Case Study
For the rest of this chapter, we will present an in-depth case study on mobile biometry. A mobile device is ubiquitous; it is user-friendly for personal communication, anytime and anywhere.
There are several potential use cases of biometrics when implemented on a mobile device. Firstly, biometrics can prevent a mobile device from being used illegitimately if lost or stolen. Secondly, it can be used to digitally sign audio, text or image files, providing proof of their origin and authenticity [19]. We shall refer to biometric authentication on mobile device as “mobile biometry”, or MoBio.
The MoBio project provides a software verification layer that uses your face and voice, captured by a mobile device, to ensure that you are who you claim to be (Figure 10.1). The software layer not only authenticates the face and voice, but also combines them to make the system more robust. It also updates system models in order to allow for changing conditions over time – all within the hardware limitations of a consumer-grade mobile platform. Though other studies have investigated face and voice authentication [20, 21], MoBio is the first to assess bimodal authentication under the challenging conditions imposed by a mobile architecture (e.g., limited processing power, shaking of the handheld camera).
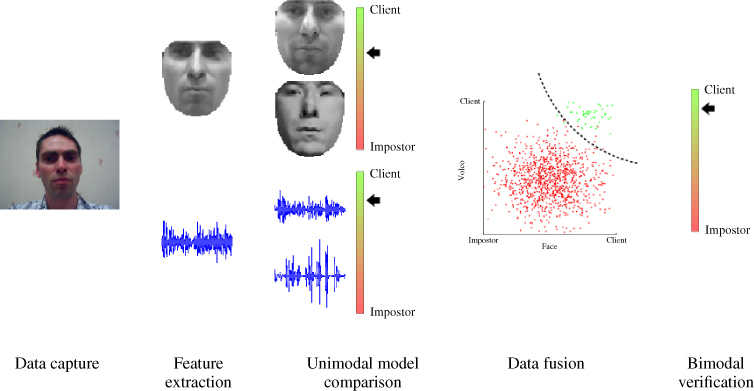
Figure 10.1 The MoBio identity verification system computes feature vectors from the captured and normalized face and voice, compares the features to stored models, fuses the scores for improved robustness, and performs a bimodal verification.
The key-enabling technological components of the project include:
- Rapid face detection with an exponential reduction in false positives [22].
- Highly efficient facial feature localization algorithm implemented on the Nokia N900 mobile device, operating at frame-rate performance [23].
- Image descriptors for improved face verification [24, 25].
- Efficient speaker verification using a novel features based on the i-vector approach [26], combined with a method to decouple core speaker recognition from session variability with limited training data [27].
- A score-level classifier fusion algorithm EER by accommodating a wider range of capture based on [28].
10.1.6 Adaptation to Blind Subjects
There are several engineering, as well as user-interaction, challenges related to mobile biometry. From the engineering viewpoint, the realization of mobile biometry is made difficult mainly due to reduced computation capability (i.e., smaller memory, computation power, limited support for floating-point calculation), compared to that of a desktop computer. Due to the portability of the device and the way it is being used – any time and anywhere, the captured biometric data can, potentially, be of poor quality. For instance, it is well known that the performance of speech recognition can be severely degraded when recorded under a noisy environment [29].
From the user-interaction perspective, the mobile biometry problem is made difficult by the following factors:
- Dependency on the skill of the user: The entire process of capturing the face and speech biometrics relies on the skill of the user.
- Physical disability of the user: Users with visual impairment are likely to be excluded from the use of mobile devices for biometric identity verification.
Concerning the last point, according to the World Health Organization, there are over 161 million visually impaired globally and most of them are older people2. Considering that a potentially large population of users may be affected by visual impairment, we will address this issue in the second part of this chapter.
Therefore, in parallel to the development of MoBio, we also explored how the platform might be used by blind users. From the outset, we identified that the facial biometrics would be extremely challenging, because blind users cannot make use of the visual cue about how well the camera has captured their face images.
Although advancements in face recognition suggest that bad illumination can be corrected [30, 31], and non-frontal pose can be rectified [32], the image restoration process is nevertheless not satisfactory.
Furthermore, variation in facial expression can also negatively impact on the recognition performance. Among these factors, head pose is arguably the most difficult to rectify since a perfect restoration procedure is very complex and computationally expensive [33].
Figure 10.2 gives an intuitive explanation of why head pose can severely impact on a face recognition system. Referring to this figure, under a perfect frontal pose, the system can give a high likelihood that a processed face image belongs to the genuine person claiming to be that individual. However, as soon as there is a change in pose, the likelihood score values decrease and move closer to those of impostors (low likelihood scores imply that an image belongs to an impostor). As can be observed, the change of head pose in two axes (pan and tilt) affects the scores more severely than the head pose change in one axis (tilt, in this example).
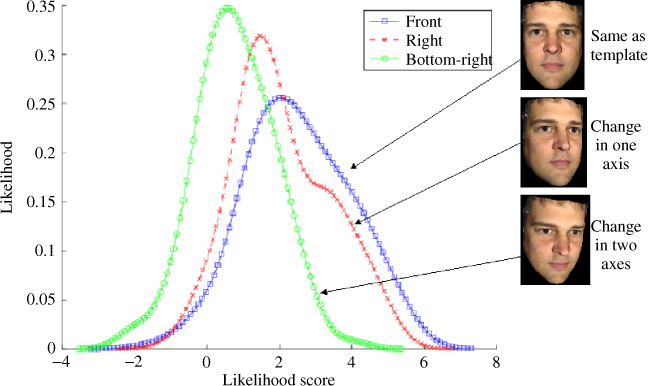
Figure 10.2 Effect of head pose on the face recognition system. Higher likelihood score implies more resemblance to the true identity. As the head pose changes, thus increasing in degrees of freedom, the likelihood score is likely to decrease, ultimately causing false rejection of the identity claim.
10.1.7 Chapter Organization
We will present the design challenges of the Mobio platform in Section 10.2, and then address the usability issue of the platform for use by blind subjects through audio feedback in Section 10.3. This is followed by discussions and conclusions in Section 10.4.
10.2 Anatomy of the Mobile Biometry Platform
10.2.1 Face Analysis
10.2.1.1 Face Detection
To capture the user's appearance, we begin with an image that contains (somewhere) the user's face, and localize the face in the image to get a rough estimate of its position and size (Figure 10.3). This is difficult, because appearance varies in the image, and our system must detect faces regardless of shape and size, identity, skin color, expression and lighting. Ideally, it should handle different orientations and occlusion but, in mobile verification, we assume the person is looking almost directly into the camera most of the time.
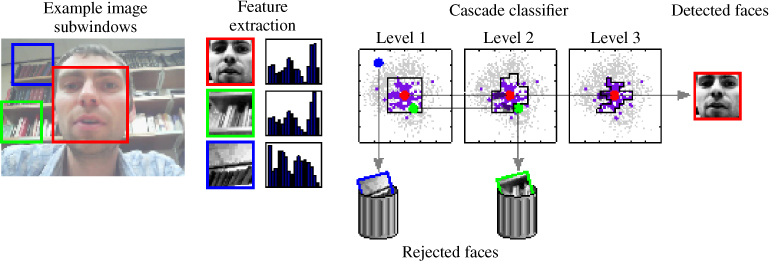
Figure 10.3 A “window” slides across the image, and the underlying region is sampled and reduced to a feature vector. This feature vector feeds into a simple classifier that rejects obvious non-faces; subwindows that are accepted then feed into a succession of more complex classifiers until all non-faces have been rejected, leaving only the true faces.
We approached this problem by classifying every region of the image as either face or not face, using modern pattern recognition methods to learn the image characteristics that differentiate faces from non-faces. Two considerations were how to summarize the image region in a compact form (i.e., compute its feature vector) and how to classify the image region based on its features.
When searching an image, there are many thousands of possible locations for the face and it is important that every image region be summarized quickly. Using a variant of the Local Binary Pattern [34], we summarized local image statistics around each pixel with a binary code indicating the image gradient direction with respect to its eight neighbors (Figure 10.5). We then computed the histogram over transformed values for each patch, and fed this into a classifier to decide whether the patch was ‘face’ or ‘not face’. In practice, we used a cascade of increasingly complex classifiers [35] to reject most image regions (ones that look nothing like a face) using simple but efficient classifiers in the early stages. The more accurate but computationally demanding classifiers were reserved for the more challenging image regions that look most face-like.
Our experiments on standard datasets (e.g., BANCA and XM2VTS) suggested that these methods detect over 97% of the true faces. In our application, however, we also prompted the user to keep their face in the centre of the image, so that we could restrict the search to a smaller region, thus reducing false positives and permitting more discriminative image representations that increase detection rates further.
To extend this baseline system, we developed a principled system that exponentially reduced false positives (background regions wrongly labeled as ‘face’) and clusters of several detections around the same true face, with little or no reduction in the true acceptance rate [21].
10.2.1.2 Face Normalization
Though we could try to recognize the user from the rectangular image region approximately surrounding the face in the image, performance will be impaired by factors such as background clutter, lighting, and facial expression. We therefore remove as many of these effects as possible, by normalizing the face so that it has similar properties (with respect to shape and texture) to the stored model of the user (Figure 10.4). First, we localize individual facial features such as the eyes, nose, mouth and jawline, and use these to remove any irrelevant background. Next, we stretch the face to fit a pre-defined shape, thus compensating for differences due to the direction in which the person is facing, their expression, and the shape of their face (a weak cue for verification). Finally, we normalize lighting by adjusting brightness and contrast to some fixed values. The resulting image can then be directly compared with a similarly normalized model image for accurate verification.
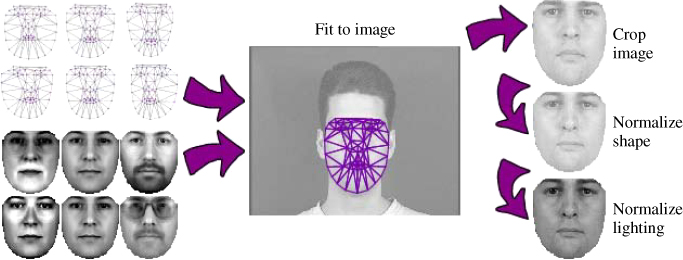
Figure 10.4 Statistical models of shape and texture are estimated from training data and fit to a new image using the Active Appearance Model. The underlying image can then be sampled to remove background information, warped to remove irrelevant shape information (e.g., due to expression), and normalized to standardized brightness and contrast levels.
To locate facial features, we fitted a deformable model to the image using a novel version of the Active Appearance Model (AAM) that we developed specifically for a mobile architecture using modern machine learning techniques [23]. The AAM uses statistical models of shape and texture variation – learned from a set of training images with hand-labeled feature locations – to describe the face using only a few parameters. It also learns to detect when the model is in the wrong place, and to correct parameters to align the model with the image. To predict these corrections, we trained a linear regressor to learn the relationship between sampled image data and true parameter values, using image samples with known misalignments.
When fitting the model to a new image, we initially aligned the model with the coarse face detection result, then sampled and normalized the corresponding part of the image (Figure 10.4). Our method then predicted and applied a correction to the shape and pose parameters to align the model more closely to the image. By repeating this sample-predict-correct cycle several times, we converged on the true feature locations, giving a normalized texture sample for verification.
Compared with the AAM, our approach achieved similar or better accuracy (typically within 6% of the distance between the eyes), while achieving a threefold speedup on a Nokia N900, reducing processing time from 44.6 ms to 13.8 ms and therefore reaching frame-rate performance [23]. Though this performance was achieved using a model that was trained from publicly available datasets, and which could be adapted to a specific user by retraining the predictor (online or offline), our results suggest that performance would improve little in return for the added computational cost.
10.2.1.3 Face Verification
Given a normalized image of the face, the final step is to assign a score describing how well it matches the stored model for the claimed identity, and to use that score to decide whether to accept or reject that person's claim (Figure 10.5). Again, we treat this is a classification problem, but here we want to label that person as a client or an impostor, based on their appearance as summarized by their image features. Clients are given access to the resource they need; impostors are not.
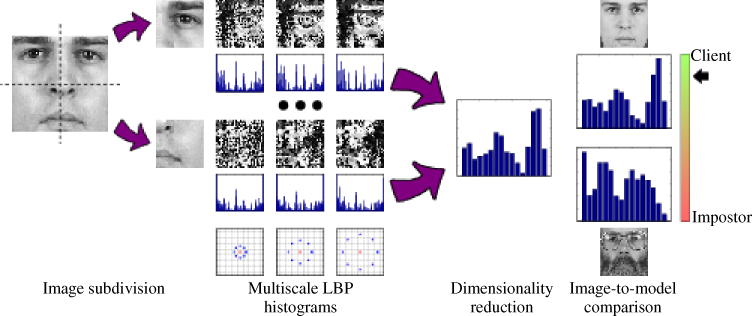
Figure 10.5 A cropped face window is subdivided into blocks, each of which is processed with a Local Binary Pattern operator at several scales. We then capture the distributions of LBP values in histograms that we concatenate and reduce in dimensionality (e.g., via Principal Component Analysis) before comparing with the stored model.
Since illumination conditions affect appearance, we applied gamma correction, difference of Gaussian filtering, and variance equalization to remove as many lighting effects as possible. For added robustness, we then subdivided the processed images into non-overlapping subwindows to make the descriptor more robust to occlusion, and computed the Local Binary Pattern (LBP) value for every pixel over three scales. We then summarized every window by its LBP histogram, and used the concatenated histograms as a feature vector for the whole image (Figure 10.5).
To classify an observed feature vector, we computed its distance to the stored model of the claimed identity. Although we could make a decision based on this similarity measure alone, we instead used a robust likelihood ratio, whereby the distance to a background model provided a reference that expressed how much more than average the observation matched the claimed identity, thus indicating our confidence in the classification. Using this method, we were able to achieve half total error rates (where false acceptances are as likely as false rejections) of around 5% on the BANCA dataset.
We also developed a number of novel image descriptors that improved recognition performance. One based on Local Phase Quantization was designed for out-of-focus images and achieved a recognition rate of 93.5% (compared with 70.1% for Local Binary Patterns) on a face image that had been blurred [24]. Developing this descriptor further to include information at multiple scales, we improved recognition rates in some cases from 66% to 80% on a more challenging dataset with widely varying illumination [25].
10.2.2 Voice Analysis
Though face verification technology is maturing, we also exploit the fact that we have a microphone at our disposal by including voice-based speaker verification in our system.
10.2.2.1 Voice Activity Detection
Given a sound sample that was captured using the mobile's microphone, our first step is to separate speech (which is useful for speaker recognition) from background noise (which is not). As in face detection, however, speech detection is complicated by variation from speaker to speaker (e.g., due to characteristics of the vocal tract, learned habits and language) and from session to session for the same speaker (e.g., as a result of having a cold).
To summarize someone's voice, we represented the variation in the shape of the vocal tract by a feature vector summarizing frequency characteristics over a small window (on the order of a few tens of milliseconds) around any given time. More specifically, we used cepstral analysis to compute this spectrum via a Fourier Transform and decompose its logarithm by a second Fourier Transform, mapping the spectrum into the mel scale (where distances more closely match perceived differences in pitch) before the second decomposition to give mel-frequency cepstral coefficients (MFCCs).
We then used a Gaussian Mixture Model (GMM) to classify a feature vector as speech or non-speech, discarding the temporal ordering of feature vectors and low-pass smoothing the output. Though this proved to be an effective technique for examples with a high signal-to-noise ratio, environments with a lot of background noise demanded more complex methods that use more than the signal energies.
We therefore used an Artificial Neural Network to classify MFCC vectors, derived from a longer temporal context of around 300 ms, as either one of 29 phonemes or as non-speech, to give an output vector of posterior probabilities corresponding to the 30 classes. These vectors were smoothed over time using a Hidden Markov Model to account for the (language-dependent) known frequency of phoneme orderings learnt from training data, and the 29 phoneme classes were merged to form the ‘speech’ samples.
Because this approach was computationally demanding (and therefore not well suited to an embedded implementation) we also proposed a simpler feature set, denoted Boosted Binary Features [Roy et al. (2011b)], that was based on the relationship between pairs of filter responses and that achieved performance at least as good as existing methods (![]() correct classification over 40 possible phonemes) while requiring only modest computation.
correct classification over 40 possible phonemes) while requiring only modest computation.
10.2.2.2 Speaker Verification
Having discarded background noise, we can then use the useful segments of speech to compute how well the person's voice matches that of the claimed identity, and decide whether to accept or reject their claim.
To describe the voice, we used 19 MFCCs (computed over a 20 ms window) plus an energy coefficient, each augmented with its first and second derivatives. After removing silence frames via voice activity detection, we applied a short-time cepstral mean and variance normalization over 300 frames.
As a baseline, to classify the claimant's feature vector, we used Joint Factor Analysis based on a parametric Gaussian Mixture Model, where the weights and covariances of the mixture components were optimized at the outset, but the centers were specified as a function of the data. These weights, covariances and means were learned using a large cohort of individuals, and the subject-subspace was learned using a database of known speakers, pooling over sessions to reduce inter-session variability. The session-subspace was then learned from what was left.
When testing, we used every training example to estimate the speaker and session, and adapted a generic model to be user-specific. We then discarded the session estimate (since we were not interested in whether the sessions matched, only the speaker) and computed the likelihood of the test example, given the speaker-specific model. Score normalization then gave a measure to use for classification.
On the BANCA dataset, this baseline system achieved equal error rates of around 3–4% for speaker verification. We showed, however, that we could improve the related ![]() -vector estimation approach (the current state of the art in speaker recognition) to make speaker modeling 25–50 times faster using only 10–15% of the memory, with only a small penalty in performance (typically increasing Equal Error Rate from
-vector estimation approach (the current state of the art in speaker recognition) to make speaker modeling 25–50 times faster using only 10–15% of the memory, with only a small penalty in performance (typically increasing Equal Error Rate from ![]() to
to ![]() [26]).
[26]).
We also demonstrated that decoupling the core speaker recognition model from the session variability model – thus allowing us to optimize the two models independently and giving a more stable system with limited training data – resulted in little or no penalty in performance [27]. Finally, we showed that using pairwise features achieved a Half Total Error Rate (HTER) of 17.2%, compared with a mean HTER of 15.4% across 17 alternative systems, despite being 100–1000 times more efficient [37].
10.2.3 Model Adaptation
One challenge in biometric verification is accommodating factors that change someone's appearance over time – either intentionally (e.g., makeup) or unintentionally (e.g., wrinkles) – as well as external influences in the environment (e.g., lighting, background noise) that affect performance. Therefore, the model of the user that was created when they enrolled cannot remain fixed – it must adapt to current conditions and adjust its criteria for accepting or rejecting a claim accordingly.
In experiments with face verification, we began by building a generic model of appearance from training data that included many individuals, enabling us to model effects such as lighting and head pose that were not present in every individual's enrolment data. We then adapted this generic model to each specific user, by adjusting model parameters based on user-specific training data. In our case, we used a Gaussian Mixture Model to represent facial appearance, because of its tolerance to localization errors. We also adapted the model a second time to account for any expected variation in capture conditions.
To account for changes in the capture environment (e.g., the BANCA dataset contains examples captured under controlled, adverse and degraded conditions), we computed parameters of error distributions for each condition, ![]() independently during training, and used score normalization such as the Z-norm,
independently during training, and used score normalization such as the Z-norm,
or Bayesian-based normalization (implemented via logistic regression):
to reduce the effect of capture conditions (where ![]() and
and ![]() are parameters estimated by learning). During testing, we computed measures of signal quality that identified which of the known conditions most closely matched the current environment, and adapted the classifier score accordingly.
are parameters estimated by learning). During testing, we computed measures of signal quality that identified which of the known conditions most closely matched the current environment, and adapted the classifier score accordingly.
In our experiments [28], normalizing the score reduced the equal error rate in some tests by 20–30% (from 19.59% to 15.31% for the face; from 4.80% to 3.38% for speech), whereas adapting the model to capture conditions had an even greater effect on performance, reducing equal error rates by over 50% in some trials (from 19.37% to 9.69% for the face; from 4.80% to 2.29% for speech).
10.2.4 Data Fusion
At this point, every sample in a video sequence has a score that tells us how much the person looks like their claimed identity and another score for how much they sound like their claimed identity. To give a system that performs better than either biometric on its own, we fuse these two modalities, either by classifying each modality independently and feeding the resulting pair of scores into a third classifier (score-level fusion), or by fusing the features and passing the result to a single classifier (feature-level fusion). Since we are concerned with video sequences, it is also beneficial to fuse scores (or features) over time.
A naïve approach is to score-level fusion pools data over time by averaging scores over the sequence. More principled methods model the distribution of scores over the observed sequence and compare this to distributions, learned from training data, that correspond to true and false matches. As a baseline, we computed non-parametric statistics (such as mean, variance and inter-quartile range) of the score distributions, and separated true and false matches using a classifier trained via logistic regression. Again, score normalization can be used to ensure that the outputs from different sensing modalities are comparable, while also taking into account the quality of the signal [38].
Though score-level fusion is popular when using proprietary software (where the internal classifier workings are hidden), feature-level fusion can capture relationships between the two modalities. Feature-level fusion may, however, result in a large joint feature space where the “curse of dimensionality” becomes problematic, and we must also take care when fusing sources with different sampling rates (e.g., video and audio).
We therefore developed a novel feature-level fusion technique, dubbed the “boosted slice classifier”, that searched over the space of feature pairs (one face and one speech) to find the pair for which quadratic discriminant analysis (QDA) minimized misclassification rate, iteratively reweighting training samples in the process. Although this approach had only a small effect under controlled conditions, it outperformed the baseline score-level fusion system when one modality was corrupted, confirming that fusion does, indeed, make the system more robust.
In a different experiment, the benefit of fusing modalities was more pronounced, as indicated by the Detection Error Tradeoff curves (Figure 10.6a).3 This illustrates the tradeoff between false rejections and false acceptances for varying thresholds of the classifier score – accepting more claimants reduces false rejections but increases false acceptances (and vice versa).
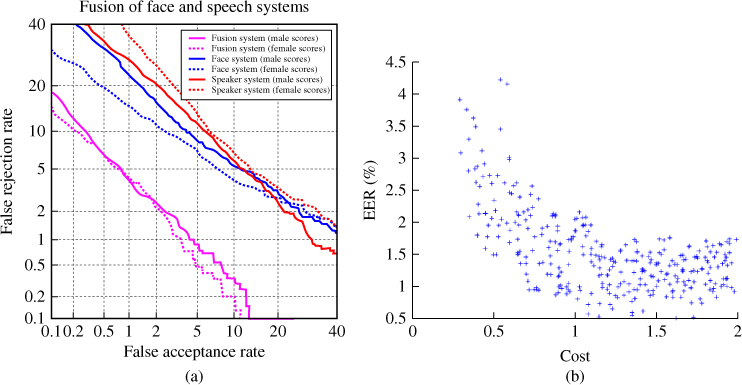
Figure 10.6 (a) Detection Error Tradeoff curves for unimodal and fused bimodal systems tested on the MoBio database; plots show false acceptance and false rejection rates on a logarithmic scale for a range of decision thresholds, where the lower left point is optimal. The equal error rate (EER) for a given curve occurs at the point where the curve intersects the line  . (b) EER vs. efficiency for various scaled systems, confirming that better accuracy comes at a cost, defined as the lower of two proportions (memory consumption and time taken) with respect to a baseline system.
10.2.5 Mobile Platform Implementation
To run the system on a mobile device, we need to consider the limitations of the available hardware such as low-power processing, a fixed-point architecture and limited memory. We therefore carried out experiments that looked at the effect on accuracy when making approximations that would make the system more efficient.
One very effective modification was to implement as many methods as possible using fixed-point (rather than floating-point) arithmetic; although some modern devices are equipped with floating-point units, they are far from common and are less efficient. Other ways to reduce computation included applying an early stopping criterion for the face detection and reducing the number of iterations used in facial feature localization. Because reducing memory consumption also has performance benefits, we made further gains by reducing parameters such as the number of LBP scales, the dimensionality of feature vectors and the number of Gaussian mixture components for speech verification. As a quantitative evaluation of these approximations, we rated 1296 scaled systems (![]() speech) by two criteria: an abstract cost reflecting both memory consumption and speed, and resultant generalization performance measured by equal error rate. As expected, increasing efficiency came at a cost in accuracy, whereas increasing complexity resulted in much smaller gains (Figure 10.6b).
speech) by two criteria: an abstract cost reflecting both memory consumption and speed, and resultant generalization performance measured by equal error rate. As expected, increasing efficiency came at a cost in accuracy, whereas increasing complexity resulted in much smaller gains (Figure 10.6b).
To test the system under real conditions, we developed a prototype application (Figure 10.7) for the Nokia N900 that has a front-facing VGA camera for video capture, a Texas Instruments OMAP3 microprocessor with a 600 MHz ARM Cortex-A8 core, and 256 Mb RAM. Using GTK for the user interface and gstreamer to handle video capture, we achieved near frame-rate operation for the identity verification system.
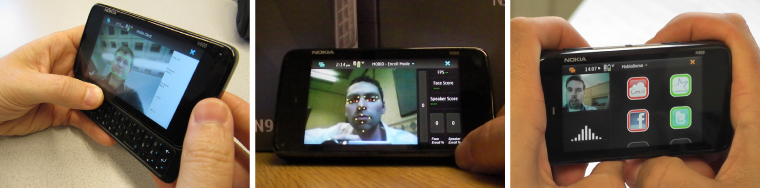
Figure 10.7 Mobile biometrics interface demonstrating face detection, facial feature localization (for shape normalization) and the user interface with automated login and logout for popular websites such as email and social networking.
10.2.6 MoBio Database and Protocol
One major difference between the MoBio project and other related projects is that the MoBio system is a bimodal system that uses the face and the voice and, therefore, needs a bimodal dataset on which to evaluate performance. Many publicly available datasets, however, contain either face data or voice data but not both. Even those few that do include both video and audio [20, 21] captured the data using high-quality cameras and microphones under controlled conditions, and are therefore not realistic for our application; we are limited to a low-quality, hand-held camera. The few that come close (e.g., the BANCA dataset) use a static camera and so do not have the image ‘jitter’, caused by small hand movements, that we have to deal with.
Since we anticipate other mobile recognition and verification applications in the future, we used a handheld mobile device (the Nokia N93i) to collect a new database that is realistic and is publicly available4 for research purposes (Figure 10.8). This database was collected over a period of 18 months from six sites across Europe, contains 150 subjects and was collected in two phases for each subject. The first phase includes 21 videos per session for six sessions; the second contains 11 videos per session for six sessions. A testing protocol is also supplied with the data, defining how the database should be split into training, development and test sets, and how evaluation scores should be computed. This protocol was subsequently applied in a competition entered by 14 sites: nine for face verification and five for speaker verification [39].

Figure 10.8 Screenshots from database, showing the unconstrained nature of the indoor environments and uncontrolled lighting conditions.
10.3 Case Study: Usability Study for the Visually Impaired
This section explores the usability of face recognition system for visually impaired users. Inspired by the success of audio feedback in assisting the visually impaired in various human-computer interface applications, we attempted to improve the quality of the images captured by the visually impaired using audio feedback. The problem will be addressed in several stages. In the first stage, we extensively evaluated the impact of head pose on image quality and on the face verification performance. In the second stage, a prototype system was developed to integrate the head pose scores with increasing frequencies and tempos to provide a user-interaction mechanism and feedback. Finally, the last stage consists of conducting experiments with visually impaired subjects, interacting with a face authentication system enhanced by head-pose-driven audio feedback.
10.3.1 Impact of Head Pose Variations on Performance
In order to quantify how head pose can impact the performance of a face recognition system, we need a database annotated with the ground-truth pose information. The database should contain one degradation factor only, e.g., head pose variations, and should not contain other factors such as illumination, facial expression and background variations. For this purpose, we used a database of 3D models consisting of 168 subjects collected at the University of Surrey [40]. For each subject, we rendered their 2D images at different tilt and pan angles, such that the angles are more densely sampled around a frontal face image and sparser towards the extreme poses. The mean images of each of the 81 poses used in this study are shown in Figure 10.9.
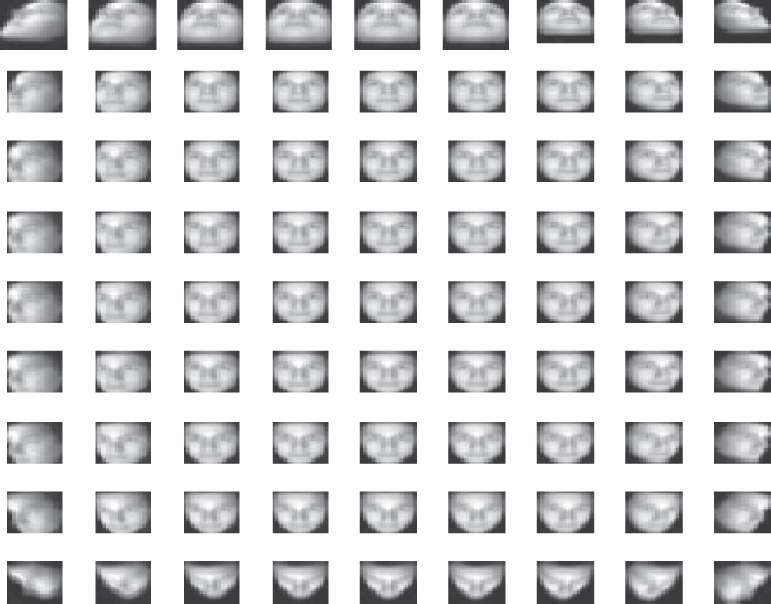
Figure 10.9 The 81 head poses generated from a single 3D model. Each image shown here is an average image of the training data at a given pose. The sampling angles in each of the pan and tilt directions are sampled in logarithmic scale as follows:  .
.
Let ![]() be a vector describing the pan and tilt angles, and
be a vector describing the pan and tilt angles, and ![]() be the system error that is dependent on
be the system error that is dependent on ![]() . Formally, we aspire to find a set of allowable
. Formally, we aspire to find a set of allowable ![]() such that an acceptable level of recognition error,
such that an acceptable level of recognition error, ![]() , can be tolerated:
, can be tolerated:
where ![]() is a small number.
is a small number.
In the sequel, ![]() is approximated by Equal Error Rate (EER). EER is a point at which the probability of a false accept is equal to the probability of a false reject. For a perfect face authentication module, the error is zero; for a poorly performing system, its error can be at most 50% (beyond which the system would have accepted an impostor and rejected a genuine user). Such an approximation implies that the error estimate enforces equal prior class probability. This is desirable, considering that there are many more non-match (impostor) accesses than match (genuine) ones in a typical biometric experiment.
is approximated by Equal Error Rate (EER). EER is a point at which the probability of a false accept is equal to the probability of a false reject. For a perfect face authentication module, the error is zero; for a poorly performing system, its error can be at most 50% (beyond which the system would have accepted an impostor and rejected a genuine user). Such an approximation implies that the error estimate enforces equal prior class probability. This is desirable, considering that there are many more non-match (impostor) accesses than match (genuine) ones in a typical biometric experiment.
In order to estimate EER, all the accesses of each of the 150 legitimate users are matched against the remaining 18 users (who serve as impostors), and this is done for each of the 81 possible head poses.
We expect that EER would varies as a function of tilt and pan. This conjecture is confirmed by Figure 10.10, which serves as a basis for the specification of our prototype system. For instance, based on the above results, in order to attain EER below 5% (hence setting ![]() ), the head pose variation should be within five degrees in both the pan and tilt directions (the range of values for
), the head pose variation should be within five degrees in both the pan and tilt directions (the range of values for ![]() ). On the other hand, if the accuracy is relaxed to, say less than 15% EER, a greater head pose variation would be tolerated.
). On the other hand, if the accuracy is relaxed to, say less than 15% EER, a greater head pose variation would be tolerated.

Figure 10.10 EER as a function of pan and tilt directions in degrees.
10.3.2 User Interaction Module: Head Pose Quality Assessment
While the previous section provides a specification of how head pose would affect the system performance, this section examines the mechanism that can be used to drive the user feedback. In this work, we explored two approaches: (i) using the face detection confidence, and (ii) estimating the head pose.
10.3.2.1 Face Detection Approach
Face detection has been intensively studied for the last decade and many approaches have been proposed [41]. Among these are feature dimension reduction methods (e.g., Principle Component Analysis, Linear Discriminant Analysis), skin color analysis, filtering techniques and image-based methods (e.g., Adaboost, Neural Networks). In this study, an image-based face detection module using a cascade of classifiers is used [42], called WaldBoost. This is a variant of Adaboost, a state-of-the-art approach proposed by [43]. This detector is appealing because it can operate in real time, with images of varying resolutions, and it is not affected by cluttered background. In addition, can we use the output of the face detector as a quality assessment. The output is a log-likelihood ratio indicating how likely it is that a face is detected.
Let ![]() denote the face detection output. Then, using the same database as before, we estimate
denote the face detection output. Then, using the same database as before, we estimate ![]() , where
, where ![]() is a vector of pan and tilt angles. The median value of this distribution is shown in Figure 10.11. We note that this figure is correlated with the EER contour plot to some extent. This implies that it is feasible to drive the feedback based on the face detection output.
is a vector of pan and tilt angles. The median value of this distribution is shown in Figure 10.11. We note that this figure is correlated with the EER contour plot to some extent. This implies that it is feasible to drive the feedback based on the face detection output.
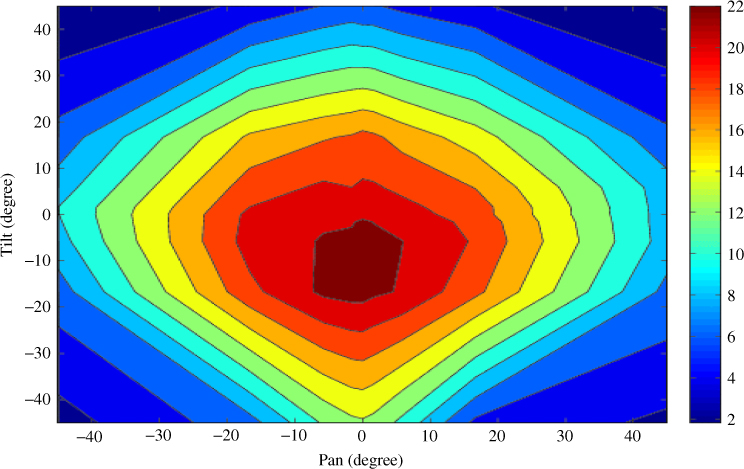
Figure 10.11 A contour plot of the median of face detection output as a function of pan and tilt directions in degrees.
10.3.2.2 Head Pose Estimation Approach
While there exist many algorithms that can be used for head pose estimation [44], our choice is restricted by the application requirements on handheld devices: real time, lightweight computation, small memory consumption and coarse head pose estimation. The real-time requirement is important in order to feed the pose information back to the user.
In this study, we employed a dimensionality reduction method which meets these requirements – in particular, the Learning Discriminative Projections and Prototypes (LDPP) algorithm [45]. This algorithm simultaneously learns a linear projection base and a reduced set of prototypes for Nearest-Neighbor classification. However, since our task is regression rather than classification, the algorithm is modified slightly to cater for our needs. The description here explains briefly the algorithm and the introduced modification.
Let ![]() be a cropped image for an arbitrary pose, represented as a column vector having
be a cropped image for an arbitrary pose, represented as a column vector having ![]() image pixels (in gray level). The projected image (of size
image pixels (in gray level). The projected image (of size ![]() ) can be written as:
) can be written as:
where ![]() is a projection basis matrix and t is a matrix transpose operation. The number of bases to use,
is a projection basis matrix and t is a matrix transpose operation. The number of bases to use, ![]() , is determined by trading off the generalization performance for speed of computation requirement (smaller
, is determined by trading off the generalization performance for speed of computation requirement (smaller ![]() implies smaller computation). Note that the projection basis
implies smaller computation). Note that the projection basis ![]() is not necessarily orthogonal, since it is obtained by LDPP via gradient descent.
is not necessarily orthogonal, since it is obtained by LDPP via gradient descent.
Let ![]() be a bi-variate vector consisting of the tilt and pan angles of a head pose. Using the 81 discrete poses as defined by angle vectors
be a bi-variate vector consisting of the tilt and pan angles of a head pose. Using the 81 discrete poses as defined by angle vectors ![]() , for
, for ![]() , we can effectively cover the continuum of the entire view-based head pose range. Furthermore, let
, we can effectively cover the continuum of the entire view-based head pose range. Furthermore, let ![]() be the prototype (the mean image) of one of the 81 head poses (as shown in Figure 10.9) and
be the prototype (the mean image) of one of the 81 head poses (as shown in Figure 10.9) and ![]() be its corresponding projected vector.
be its corresponding projected vector.
The original formulation of LDPP solves the classification problem via the nearest-neighbor rule, i.e., a query sample ![]() is assigned the class label whose prototype
is assigned the class label whose prototype ![]() is closest to the query sample. However, since our problem here is regression, the nearest-neighbor rule is not applicable here. Instead, we need a function that quantifies how similar a query sample
is closest to the query sample. However, since our problem here is regression, the nearest-neighbor rule is not applicable here. Instead, we need a function that quantifies how similar a query sample ![]() is to a given prototype
is to a given prototype ![]() , for all possible poses spanned by
, for all possible poses spanned by ![]() . The similarity measure should give a high response when
. The similarity measure should give a high response when ![]() is near
is near ![]() , eventually producing a peak value when
, eventually producing a peak value when ![]() . Conversely, when
. Conversely, when ![]() is far from
is far from ![]() , the measure should be small, eventually attaining zero.
, the measure should be small, eventually attaining zero.
A possible measure exhibiting the above characteristics is the radial basis function (RBF), also commonly referred to as the Gaussian kernel, having the form ![]() , where
, where ![]() is the kernel width, a parameter that controls how drastic the measure will drop as the sample
is the kernel width, a parameter that controls how drastic the measure will drop as the sample ![]() is located further away from the centroid
is located further away from the centroid ![]() . The optimal value of
. The optimal value of ![]() is data- and problem-dependent (since it is defined on the manifold spanned by
is data- and problem-dependent (since it is defined on the manifold spanned by ![]() ,
, ![]() ) and is determined by experiments. We found that
) and is determined by experiments. We found that ![]() is appropriate for our task at hand. The RBF, when used in the context of other poses, can be interpreted as the posterior probability of a head pose, i.e.,
is appropriate for our task at hand. The RBF, when used in the context of other poses, can be interpreted as the posterior probability of a head pose, i.e.,
where ![]() is a normalizing factor such that axiom of probability is respected, i.e.,
is a normalizing factor such that axiom of probability is respected, i.e., ![]() . From this, it follows that
. From this, it follows that ![]() . Then, the expected head pose is:
. Then, the expected head pose is:
which is, in essence, an expectation operator (in the usual statistic sense) under the posterior distribution of head poses, given the observation ![]() in the reduced dimension,
in the reduced dimension, ![]() .
.
The condition ![]() , where
, where ![]() is a small value, is in order here because in case the original image
is a small value, is in order here because in case the original image ![]() is not a face image, the response of RBF, hence that of
is not a face image, the response of RBF, hence that of ![]() , is likely to be random to the extent that
, is likely to be random to the extent that ![]() , for all
, for all ![]() 's, will be small. The consequence of this is that
's, will be small. The consequence of this is that ![]() will converge to the mean value. By setting
will converge to the mean value. By setting ![]() , one effectively rules out the head pose whose corresponding RBF response is too small.
, one effectively rules out the head pose whose corresponding RBF response is too small.
Another sanity check that we have considered is to ensure that ![]() is, indeed, a face prior to head pose estimation. This is achieved by using the face detection confidence, via the quality(
is, indeed, a face prior to head pose estimation. This is achieved by using the face detection confidence, via the quality(![]() ) function, as discussed in Section 10.3.2. Since the details of head pose estimation are not extremely crucial in this paper, the validation of this approach is not further discussed.
) function, as discussed in Section 10.3.2. Since the details of head pose estimation are not extremely crucial in this paper, the validation of this approach is not further discussed.
Prior to concluding this section, it is instructive to visualize the distribution of samples spanned by ![]() . For this purpose, we chose five distinctive head poses, covering essentially frontal, upper left, upper right, lower left and lower right poses. The scatter plots of these poses on the test data sets are shown in Figure 10.12. As can be observed, the poses are somewhat well separated.
. For this purpose, we chose five distinctive head poses, covering essentially frontal, upper left, upper right, lower left and lower right poses. The scatter plots of these poses on the test data sets are shown in Figure 10.12. As can be observed, the poses are somewhat well separated.
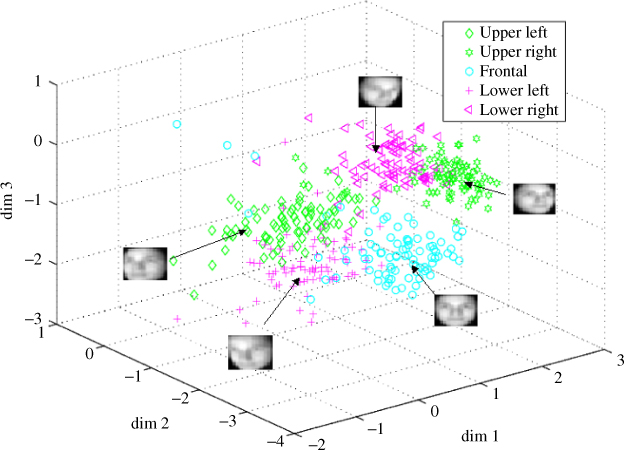
Figure 10.12 A scatter plot of five out of 81 head poses in three dimensions.
10.3.3 User-Interaction Module: Audio Feedback Mechanism
A generic way to feed the head pose quality information back to the user is to continuously assess the probability of error and instantaneously control a feedback mechanism (see Algorithm 1).
Let us define the quality information to be ![]() , which is composed of the face detection confidence and an estimated head pose. The quality-conditioned probability of error to be characterized by
, which is composed of the face detection confidence and an estimated head pose. The quality-conditioned probability of error to be characterized by ![]() . In the literature, several methods exist that could be used to estimate
. In the literature, several methods exist that could be used to estimate ![]() , such as generalized linear mixed model (GLMM) [46] and logistic regression (noting that logistic regression is a special case of the former). The advantage of using GLMM is the possibility of identifying several factors or covariates simultaneously, e.g., gender, presence of classes, ethnics, etc.
, such as generalized linear mixed model (GLMM) [46] and logistic regression (noting that logistic regression is a special case of the former). The advantage of using GLMM is the possibility of identifying several factors or covariates simultaneously, e.g., gender, presence of classes, ethnics, etc.
Although the vector ![]() is rich in information (i.e., containing the estimated head pose and face detection confidence), it is not clear at this point how this rich information can be conveyed to the user in a meaningful way, for instance using 3D sound to guide the user, or giving explicit instructions. In either case, conveying this information may incur some mental workload upon users. Another observation is that the face detection confidence alone correlates strongly with the head pose, i.e.,
is rich in information (i.e., containing the estimated head pose and face detection confidence), it is not clear at this point how this rich information can be conveyed to the user in a meaningful way, for instance using 3D sound to guide the user, or giving explicit instructions. In either case, conveying this information may incur some mental workload upon users. Another observation is that the face detection confidence alone correlates strongly with the head pose, i.e., ![]() and
and ![]() happen to be closely related (compare Figure 10.10 with 10.11). Based on the above reasoning and observation, instead of estimating
happen to be closely related (compare Figure 10.10 with 10.11). Based on the above reasoning and observation, instead of estimating ![]() using a separate database, we opted for the following simpler deterministic function:
using a separate database, we opted for the following simpler deterministic function:
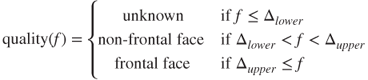
which implies that the quality of a detected face is defined by a lower threshold (_lower) and an upper threshold (_upper) of the face detection output.
An immediate utility of the above function is to drive the user feedback mechanism differently, depending on the state of the facial quality. In our knowledge, although there exist already biometric systems designed with feedback, they remain very basic. For instance, the feedback information consists of two states, each denoting the start and end of the data acquisition process. In our proposed feedback mechanism, a richer information (head pose) is conveyed to the user. However, this information is not as rich as using the estimated head pose, as discussed in the previous section. This is because we have no means of conveying this even richer information in a meaningful way to the user. This part of the exercise is left for a future research study.
Having determined the level of quality information to be fed to the user, the next issue is the actual type of feedback modality, which can be transmitted to the user via a screen display – hence visual feedback; or sound – audio feedback; and vibration – in tactile/haptic mode.
In this study, the audio feedback will be used. We created three different sinusoidal wave sounds at increasing frequencies, and the tempos were used to indicate three different qualitative stages (from unknown and non-frontal to frontal face).
In our study, the “unknown” qualitative stage is associated with a low-frequency sound played in a slow tempo; the “non-frontal face” stage is associated with a moderate frequency sound played at a faster tempo; and, finally, the “frontal face” stage has the highest frequency sound played at the fastest tempo. The frequencies used are respectively, 400, 800 and 1200 Hz.
The feedback is provided instantaneously and continuously during the acquisition process. Figure 10.13 shows the proposed system architecture when head pose quality assessment and feedback mechanism (the dotted lines square box) are integrated in a biometric system. When a user acquires a biometric data, the quality is checked in the quality assessment module. If the quality is considered high, the biometric data will be passed on to the feature extraction module, otherwise the system will feedback the quality to the user, and another interaction is necessary to acquire new biometric data. The process will continue until the timeout, or when a head pose with sufficient quality is acquired.
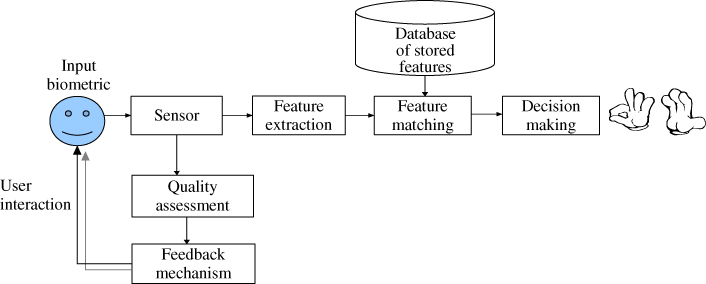
Figure 10.13 The system architecture of the proposed quality assessment and feedback mechanism in a biometric system.
10.3.4 Usability Testing with the Visually Impaired
This section explores the usability issue specifically related to how a visually impaired user interacts with a mobile biometry system. For this purpose, we recruited 40 visually impaired subjects from different age groups, genders, and level of impairment from St. Nicholas's Home, Penang, Malaysia. The demographic is depicted in Figure 10.14.
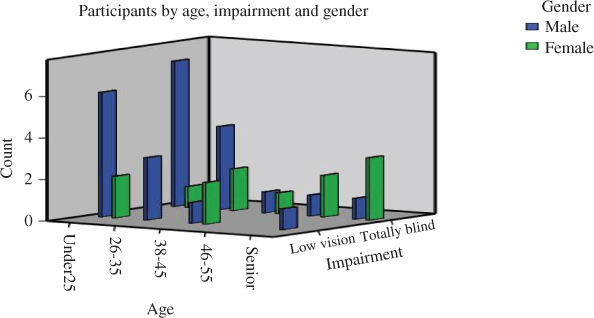
Figure 10.14 The demographic information of the participants.
Although these participants can use mobile phones, they are not familiar with the camera functionality. Some of them have had undergone training to use computers. They are cooperative and sensitive to sound changes.
During the testing session, the participants were arranged in a quite room and asked to perform an image acquisition task using our prototype system. Each subject was told to capture his/her own face image as frontal as possible in a video clip. They had to perform it under three conditions: no feedback, with audio feedback, and with oral instruction followed by audio feedback. By audio feedback, we understand that sounds with different frequency tunes are played in order to provide an indication of their head pose, as in Equation (3). The mode of instruction, followed by audio feedback – audio ![]() instruction – refers to the combination of audio feedback and oral explanation given to the volunteers about the association of the frequency and tempo to the image quality. In particular, the participants were instructed to hold their camera at arm's length just before starting the image acquisition process.
instruction – refers to the combination of audio feedback and oral explanation given to the volunteers about the association of the frequency and tempo to the image quality. In particular, the participants were instructed to hold their camera at arm's length just before starting the image acquisition process.
There are two possible outcomes in a session, i.e., either no face is detected or that a face is detected in the sequence. The first case is considered a failure, while the second case is considered a success. However, for the latter case, the level of success can still be further differentiated, depending on the confidence of the detected face. There are, therefore, two types of statistics that we can derive from each session of trial: success or failure of the image acquisition, and the value of confidence produced by the face detector in the case of a successful image acquisition.
We report the success/failure rate on visually impaired subjects for a given condition in Figure 10.15. This figure shows that the success rate of the audio feedback alone, as well as that of instruction ![]() audio, is significantly higher (both attaining 65% and 94%, respectively) than the baseline condition without feedback, which has a success rate of 49%. Therefore, the visually impaired can potentially use mobile biometry when the system is supplemented with audio feedback and instructions.
audio, is significantly higher (both attaining 65% and 94%, respectively) than the baseline condition without feedback, which has a success rate of 49%. Therefore, the visually impaired can potentially use mobile biometry when the system is supplemented with audio feedback and instructions.
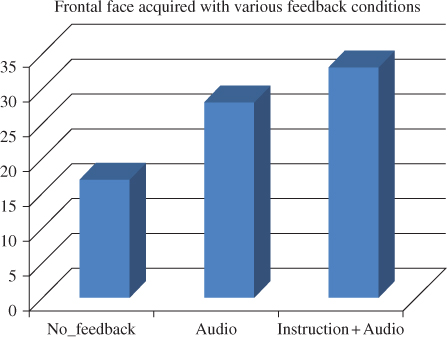
Figure 10.15 The confidence of the detected face under three experimental conditions.
The procedure for obtaining the face detection confidence for each session of trial is as follows: when a sequence has no detected face, the facial detection confidence is set to the default zero value. However, when a face is detected, the highest value of facial detection confidence in the sequence is used. We show some of the detected face images in Figure 10.16.
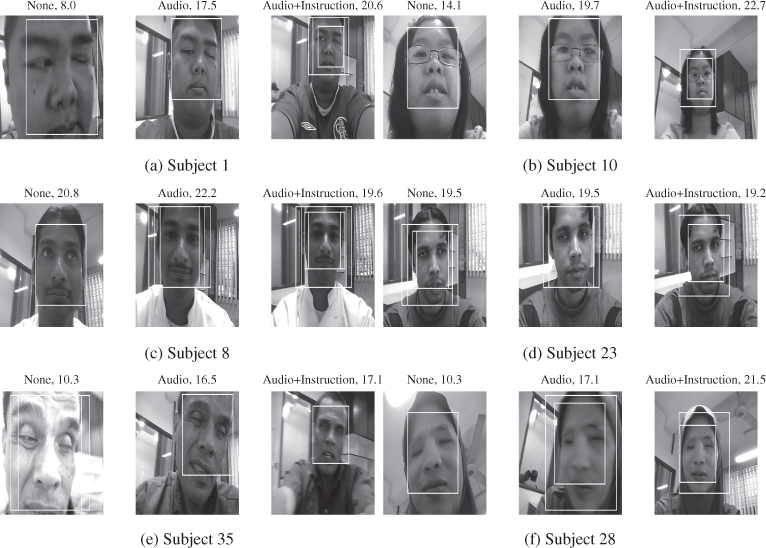
Figure 10.16 Example of detected facial images with the highest confidence in each of the four experimental configurations for six randomly subjects, all taken in session one. As can be observed, images taken with audio  instruction are likely to produce higher face detection confidence than audio or instruction alone.
We also performed a paired t-test on the continuous values of the detected facial confidence, in order to see if the mean value of the confidence of the detected faces of the three conditions are significantly different or not. The result is shown in Table 10.1. As can be seen, in each of the comparison under paired t-test, the results are all significant (under 5%). This further confirms the effectiveness of the proposed mechanism in improving the usability aspect.
Table 10.1 Paired significant t-test carried out under different conditions
| Experiment | Paired differences | t | df | Sig. (2-tailed) | ||||
| 95% CI | ||||||||
| Mean | Std. Dev | SE Mean | Lower | Upper | ||||
| No FB vs. A | 8.42 | 1.40 | |
35 | .002 | |||
| No FB vs. |
7.58 | 1.26 | 35 | .000 | ||||
| Audio vs. |
4.86 | .81 | |
35 | .001 | |||
FB = Feedback, A = Audio, I = Instruction, CI = Confidence Interval
10.4 Discussions and Conclusions
Identity assurance plays a central role in our daily lives. Biometrics, as an enabling technology that delivers this assurance, has to deal with a number of challenging issues. Although humans can recognize familiar people in very unconstrained environments, biometric systems can recognize millions of people, but under very controlled environments. The systems can be easily affected by sources of environmental noise, which humans can easily, and naturally, overcome.
In this chapter, we have explored multimodal biometrics as a viable means to take advantage of the diverse ways human interacts with the system. We have surveyed a number of scenarios where multimodal biometrics are required. In addition, we also outlined a new system for identity verification on a mobile platform that uses both face and voice characteristics. Specifically, state of the art video modules detect, normalize and verify the face, while audio modules segment speech and verify the speaker. To ensure that the system is robust, we adapt models to the estimated capture conditions and fuse signal modalities, all within the constraints of a consumer-grade mobile device.
In a separate case study, we also demonstrated that mobile biometry has a potential to be applied by visually impaired. Through providing appropriate feedback, the quality of the captured signals could be improved significantly.
Acknowledgements
This work was performed by the MOBIO project (http://www.mobioproject.org) 7th Framework Research Programme of the European Union (EU), grant agreement number 214324. The authors would like to thank the EU for the financial support and the consortium partners for a fruitful collaboration, especially Visidon Ltd., for their invaluable work in developing the mobile phone user interface. Rita Wong thanks the volunteers of St. Nicholas Home, Penang, Malaysia, for having participated in the usability case study.
References
- 1. Ross, A., Poh, N. (2009). Fusion in Biometrics: An Overview of Multibiometric Systems, chapter 8, 273–292. Springer, London.
- 2. Bhavan. Y., Marg, S. (2009). Biometrics design standards for UID applications.
- 3. Johnson, P.A., Tan, B., Schuckers, S. (2010). Multimodal fusion vulnerability to non-zero effort (spoof) imposters.
- 4. Rodrigues, R.N., Ling, L.L., Govindaraju, V. (2009). Robustness of multimodal biometric fusion methods against spoof attacks. Journal of Visual Languages Computing 20, 169–179.
- 5. Altinok, A., Turk, M. (2003). Temporal integration for continuous multimodal biometrics Multimodal User Authentication, pp. 131–137.
- 6. Azzini, A., Marrara, S., Sassi, R., Scotti, F. (2008). A fuzzy approach to multimodal biometric continuous authentication. Fuzzy Optimization and Decision Making 7(3), 243–256.
- 7. Sim, T., Zhang, S., Janakiraman, R., Kumar, S. (2007). Continuous verification using multimodal biometrics. IEEE Trans. Pattern Anal. Mach. Intell. 29(4), 687–700.
- 8. Niinuma, K., Jain, A.K. (2010). Continuous user authentication using temporal information.
- 9. Li, X., Chen, G., Ji, Q., Blasch, E. (2008). A non-cooperative long-range biometric system for maritime surveillance Pattern Recognition. 19th International Conference on ICPR, 1–4.
- 10. Nixon, M.S., Bouchrika, I., Arbab-Zavar, B., Carter, J.N. (2010). On use of biometrics in forensics: gait and ear, 1655–1659.
- 11. Tresadern, P., Cootes, T., Poh, N., Matejka, P., Hadid, A., Levy, C., McCool, C., Marcel, S. (2013). Mobile biometrics: Combined face and voice verification for a mobile platform. Pervasive Computing, IEEE 12(1), 79–87.
- 12. Taigman, Y., Wolf, L. (2011). Leveraging billions of faces to overcome performance barriers in unconstrained face recognition. arXiv preprint arXiv: 1108.1122.
- 13. Cardinaux, F., Sanderson, C., Bengio, S. (2006). User Authentication via Adapted Statistical Models of Face Images. IEEE Trans. on Signal Processing 54(1), 361–373.
- 14. Gorodnichy, D. (2005). Video-based framework for face recognition in video. Proceedings of The 2nd Canadian Conference on Computer and Robot Vision, 330–338
- 15. Poh, N., Chan, C.H., Kittler, J., Marcel, S., McCool, C., Rua, E., Castro, J., Villegas, M., Paredes, R., Struc, V., Pavesic, N., Salah, A., Fang, H., Costen, N. (2010a). An evaluation of video-to-video face verification. IEEE Transactions on Information Forensics and Security 5(4), 781–801.
- 16. Wheeler, F.W., Liu, X., Tu, P.H. (2007). Multi-frame super-resolution for face recognition. First IEEE International Conference on Biometrics: Theory, Applications, and Systems, BTAS 2007, 1–6.
- 17. Blanz, V., Vetter, T. (1999). A morphable model for the synthesis of 3d faces. Proceedings of the 26th annual conference on Computer graphics and interactive techniques, SIGGRAPH '99, 187–194. ACM Press/Addison-Wesley Publishing Co., New York, NY, USA.
- 18. Schimbinschi, F., Wiering, M., Mohan, R., Sheba, J. (2012). 4D unconstrained real-time face recognition using a commodity depth camera. 7th IEEE Conference on Industrial Electronics and Applications (ICIEA), 166–173.
- 19 Ricci, R., Chollet, G., Crispino, M., Jassim, S., Koreman, J., Olivar-Dimas, M., Garcia-Salicetti, S., Soria-Rodriguez, P. (2006). Securephone: a mobile phone with biometric authentication and e-signature support for dealing secure transactions on the fly. Society of Photo-Optical Instrumentation Engineers (SPIE) Conference Series, vol. 6250 of Presented at the Society of Photo-Optical Instrumentation Engineers (SPIE) Conference.
- 20. Chetty, G., Wagner, M. (2006). Multi-level liveness verification for face-voice biometric authentication. Biometric Symp.
- 21. Teoh, A.B.J., Samad, S.A., Hussain, A. (2005). A face and speech biometric verification system using a simple Bayesian structure. J. Inf. Sci. Eng. 21, 1121–1137.
- 22. Atanasoaei, C., McCool, C., Marcel, S. (2010). A principled approach to remove false alarms by modelling the context of a face detector, pp. 1–11, Aberystwyth, UK.
- 23. Tresadern, P.A., Ionita, M.C., Cootes, T.F. (2011). Real-time facial feature tracking on a mobile device.
- 24. Ahonen, T., Rahtu, E., Ojansivu, V., Heikkila, J. (2008). Recognition of blurred faces using local phase quantization. 19th International Conference on Pattern Recognition, ICPR 2008, 1–4.
- 25. Chan, C.H., Kittler, J. (2010). Sparse representation of (multiscale) histograms for face recognition robust to registration and illumination problems. 17th IEEE International Conference on Image Processing (ICIP), 2441–2444.
- 26. Glembek, O., Burget, L., Mat
 jka, P., Karafiát, M., Kenny, P. (2011). Simplification and optimization of i-vector extraction.
 - 27. Larcher, A., Lévy, C., Matrouf, D., Bonastre, J.F. (2010). Decoupling session variability modelling and speaker characterisation. Proceedings of the 11th Annual Conference of the International Speech Communication Association (INTERSPEECH).
- 28. Poh, N., Kittler, J., Marcel, S., Matrouf, D., Bonastre, J.F. (2010c). Model and score adaptation for biometric systems: Coping with device interoperability and changing acquisition conditions.
- 29. Furui, S. (1997). Recent advances in speaker recognition. Pattern Recognition Letters 18(9), 859–872. Audio- and Video-Based Person Authentication.
- 30. Perronnin, F., Dugelay, J.L. (2003). A Model of Illumination Variation for Robust Face Recognition Workshop on Multimodal User Authentication (MMUA 2003), pp. 157–164, Santa Barbara, CA.
- 31. Zou, X., Kittler, J., Messer, K. (2007). Illumination invariant face recognition: A survey. First IEEE International Conference on Biometrics: Theory, Applications, and Systems, BTAS 2007, 1–8.
- 32. Okada, K., Akamatsu, S., von der Malsburg, C. (2000). Analysis and synthesis of pose variations of human faces by a linear pcmap model and its application for pose-invariant face recognition system. Int'l Conf. on Automatic Face and Gesture Recognition, 142–149.
- 33. Salah, A.A., Nar, H., Akarun, L., Sankur, B. (2007). Robust facial landmarking for registration. Annals of Telecommunications 62(1–2), 1608–1633.
- 34. Pietikainen, M., Hadid, A., Zhao, G., Ahonen, T. (2011). Computer Vision Using Local Binary Patterns. Springer.
- 35. Viola, P., Jones, M.J. (2004). Robust real-time face detection. International Journal of Computer Vision 57(2), 137–154.
- 36. Roy, A., Magimai-Doss, M., Marcel, S. (2011b). Phoneme recognition using boosted binary features. Proc. IEEE Int. Conf. on Acoustics, Speech and Sig. Proc.
- 37. Roy, A., Magimai-Doss, M., Marcel, S. (2011a). A fast parts-based approach to speaker verification using boosted slice classifiers. DOI: 10.1109/TIFS.2011.2166387.
- 38. Poh, N., Kittler, J., Bourlai, T. (2010b). Quality-based score normalization with device qualitative information for multimodal biometric fusion. IEEE Trans. on Systems, Man, Cybernatics Part B : Systems and Humans 40(3), 539–554.
- 39. Marcel, S., McCool, C., Matcka, P., Ahonen, T.,
 ernocky, J., Chakraborty, S., Balasubramanian, V., Panchanathan, S., Chan, C.H., Kittler, J., Poh, N., Fauve, B., Glembek, O., Plchot, O., Jan
 ik, Z., Larcher, A., Lévy, C., Matrouf, D., Bonatre, J.F., Lee, P.H., Hung, J.Y., Wu, S.W., Hung, Y.P., Machlica, L.J.M., Mau, S., Sanderson, C., Monzo, D., Albiol, A., Albiol, A., Nguyen, H., Li, B., Wang, Y., Niskanen, M., Turtinen, M., Nolazco-Flores, J.A., Garcia-Perera, L.P., Aceves-Lopez, R., Villegas, M., Paredes, R. (2011). On the results of the first mobile biometry (mobio) face and speaker verification evaluation ICPR (Contests).
 - 40. Tena, J. (2007). 3D Face Modelling for 2D+3D Face Recognition. PhD thesis, University of Surrey.
- 41. Hjelmas, E., Low, B. (2001). Face detection: A survey. Computer Vision and Image Understanding 83, 236–274.
- 42. Kalal, Z., Matas, J., Mikolajczyk, K. (2008). Weighted sampling for large-scale boosting. Proc. BMVC.
- 43. Viola, P., Jones, M. (2001). Rapid object detection using a boosted cascade of simple features. IEEE Conference on Computer Vision and Pattern Recognition.
- 44 Murphy-Chutorian, E., Trivedi, M. (2009). Head pose estimation in computer vision: A survey. IEEE Trans. Pattern Anal. Mach. Intell. 31(4), 607–626.
- 45. Villegas, M., Paredes, R. (2008). Simultaneous learning of a discriminative projection and prototypes for nearestneighbor classification. IEEE Computer Society Conference on Computer Vision and Pattern Recognition.
- 46. Givens, G.H., Beveridge, J.R., Draper, B.A., Phillips, P.J. (2005). Repeated measures GLMM estimation of subject-related and false positive threshold effects on human face verification performance. Proceedings of Computer Vision and Pattern Recognition (CVPR), 40.