
Chapter 11
Towards “True” 3D Interactive Displays
Jim Larimer1, Philip J. Bos2 and Achintya K. Bhowmik3
1ImageMetrics, Half Moon Bay, California
2Kent State University, Kent, Ohio
3Intel Corporation, Santa Clara, California
11.1 Introduction
We use all of our senses to interact with the environment, but there can be no doubt that vision provides the most immediate and important impressions of our surroundings. The signals that generate those experiences are in the light field. The light field is all of the information contained in light as it passes through a finite volume in space as we look in any direction from a vantage point within this small finite volume.
Displays today can reconstruct 2D and stereo-pair 3D (s3D) imagery, but there are visual signals in the natural environment that humans sense and use that are missing when images are reconstructed on these displays. This gap between a human's ability to extract information from the light field, and a similar ability to capture and reconstruct these signals, is being closed as improvements to cameras and displays replace current technologies used in computing and video entertainment systems. The missing signals are the subject of this section.
If you try to focus on an object that is out of focus in an image presented on a modern display, you will not be able to bring it into focus. This outcome can be irritating and uncomfortable. The information needed to bring the object into focus is absent in the signal as reconstructed on the display screen. 2D, s3D, and multi-view s3D displays do not reconstruct all of the signals that we routinely sample from the light field in the real world and, as a result, we are operating with an open control loop as we view images on these displays.
Of all the information in the light field, only a small fraction of it is sensed by human vision. There is information in frequencies outside of the narrow visual band of energies that we can see when we look about us. Additionally, there is information within the visual band of energies we can see that we do not sample. We are insensitive to the polarization of light, we are unable to see large intensity differences or very small ones, small spatial details or rapid changes in time are invisible to us without special aids to vision, and we are not very good at identifying the precise spectral characteristics of the light we see.
In the vision research literature, the information in the light field that we cannot sense is said to be outside the window of visibility [1]. This window changes with viewing conditions – for example, the closer we are to a surface the more detail we can see on the surface and, as the level of illumination changes, so does our ability to see details and changes taking place during a brief temporal interval. Some information is always outside the window of visibility. Efficient engineering design requires knowing which signals the eye captures and which are outside the window of visibility. Including information that we cannot see is wasteful. Not including information that we can see and use means that the experience of viewing images on displays will be significantly different from viewing natural scenes with our unaided eyes.
Artists use all of the features and abilities of imaging technology to create unique visual experiences. Examples of this include the photographs of Ansel Adams, who manipulated image contrast to make images more dramatic, or the Joel and Ethan Coen, Roger Deakins movie, O Brother, Where Art Thou? that manipulated image color to give the impression of a drought to scenes captured during lush Mississippi summer months [2].
Not every manipulation of the signals captured from the light field and displayed on the screen will necessarily serve a desired purpose. Leaving out information needed for the visual system to close the loop can cause visual discomfort and fatigue [3]. The mismatch between where an object appears in space and where it is in focus in space in current s3D and multi-view s3D displays, and the visual discomfort that results, is an example of the kind of problem that can be created by not providing sufficient information for the visual task of viewing images on a display.
Ideally, imaging technology, cameras and displays would be capable of capturing or reconstructing all of the signals used by humans when interacting with the visual environment. For some tasks, capturing and reconstructing these signals faithfully is the appropriate goal. Artistic expression in visual media, however, implies that controlling and manipulating these signals is equally important. The image fidelity that matters to the artist is the reproduction of their artistic intent. For other applications – for example, medical imaging – it might be to detect disease. In this case, signal manipulation to enhance detection may be the engineering design goal. Nonetheless, these different intents all depend upon technologies capable of capturing or reconstructing a complete set of the visual signals sensed by humans. The choice to remove information from the reconstructed signal or to transform it should be by design, not by accident or due to technical limitations that could be overcome.
The process of sampling information from the natural light field with the unaided eye can produce distortions, artifacts and aliases, despite our belief that what we experience visually is an accurate representation of the environment. The Müller-Lyer illusion, shown in the upper left corner of Figure 11.1, is an example of how perception can distort the physical ground truth. These lines have exactly the same length, yet one appears shorter than the other. The colors we experience in photographs, in movies, and on displays are examples of a perceptual experience that can be generated by physically distinct input signals. The spectral energy distribution of the light imaged onto the retina when viewing a person's face is virtually never the same as the energy distribution when viewing their face in a photograph, despite the difference going unnoticed. The vision literature calls this phenomena metamerism; in communication theory, it is called aliasing. Metamers, the technical name for two different spectral energy distributions that appear to have the same color, are rare in natural scenes but common in man-made ones.
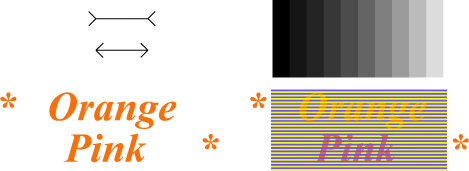
Figure 11.1 Three aspects of the visual system are illustrated in this figure. The Müller-Lyer illusion in the upper left, Mach Bands in the upper right, and a color appearance phenomenon related to spatial frequency and color contrasts in the bottom of the figure, all illustrate how the visual system interacts with the light field signal captured on the retina. There is a detailed discussion of these phenomena in the text.
The gray bars in the upper right of Figure 11.1 appear to be brighter on their left edge at the boundary with a darker bar, while at the same time appearing slightly darker on the right edge adjacent to a lighter bar. Despite the scalloped appearance of the bars the ground truth is that they are uniform in intensity within each bar. This phenomenon is called Mach Bands and it serves to enhance the visibility of the edges. It is an example of how evolution has evolved visual mechanisms that enhance perceptions to detect image details that might otherwise be less salient. This evolutionary enhancement is not unlike the goal in medical imaging to transform the image data to optimize the detection of pathologies.
The bottom of Figure 11.1 illustrates another feature of the human visual system. The words orange and pink are printed with the same color ink on the left and right sides of this illustration, but the colors appear very different on the right. Color perception is influenced by the surrounding imagery as much as by the signals created by the light at any particular location within the entire image. In this example, the spacing of the bars and whether or not a yellow or blue bar covers or goes under the letter determine the apparent color of the letters.
The spectral characteristic of the light reflected from surfaces depends upon the illuminant as well as the surface. The illuminant changes dramatically over the course of a day or in man-made illumination, yet most the time we are able to correctly identify the surface colors independent of these changes. In the example in the lower portion of Figure 11.1, however, a mechanism designed to discount the illuminant has produced a color perception different from the color of the surface. Magnifying the image in the lower right is all that is required to change the color percept. With increasing magnification, which changes the scale of the spatial relationships, the illusion of different colors for the letters vanishes.
The examples of artistic manipulations of imagery to achieve an artistic goal and of our visual system adding distortion, aliasing, and creating artifacts in the percepts corresponding to signals gathered from the light field, raise the issue of the purpose of vision. Why do we extract some information from the light field and not others, what is the evolutionary goal in seeing, and how closely related to the physical ground truth of objects are our perceptual experiences of them? To understand how missing signals from the light field in current imaging systems impact our perceptions and our ability to interact with machines, and to provide answers to some of these questions, it is useful to understand the evolutionary context of biological vision.
11.2 The Origins of Biological Vision
Biological sensory systems evolved shortly after the Cambrian explosion, 550 million years ago, when predation became a part of life. Vision evolved so that creatures could find food and avoid being eaten. The sense of vision plays a central role in cognition, the language we use to express ideas, and our understanding of the world about us. Vision provides the basic information we use to orient in our immediate environment, and it is the primary input data upon which we base many actions. Almost all ideas have images as correlates; a chair is a visual pattern, a tiger is a large cat. Even abstract concepts such as satisfaction can be imagined as a smile on someone's face. Visual cognition – understanding images – is not the mental equivalent of a photograph; our visual experience is more akin to Plato's concept of Ideals and Forms. We see people, objects, and actions, and not their images as projected onto our retinas. The process of seeing is dynamic and constructive; it is not a passive system.
Human vision is object-oriented. We use information extracted from the light field and neural signal processing based upon learning and memory to understand the environment we sense from the images projected onto our retinas. The image formed on the retina is the raw data for vision; it is not a sufficient signal for image understanding. To understand what we see, we change eye positions and focus to de-clutter or segment a scene into whole objects. Perception relies on experience as well as the immediately available data. This is obvious when you consider the common experience of finding and recognizing an object in a cluttered scene. Once an object is recognized and familiar, it is difficult, from that point onward, not to see it.
Images exist because we have a chambered eye with an entrance pupil similar to a pinhole camera such as the camera obscura shown in Figure 11.2. Understanding how our eyes extract useful information from the light field and the physics of light both began with the camera obscura. The camera obscura's connection to sight was described by Mozi and by Aristotle centuries ago and is featured in da Vinci's notes on light and imaging [4]. The idea that light from a point on any surface can be considered as rays emanating in all directions external to the surface, a central idea in geometric optics, is based upon the pinhole camera. Evolution discovered the pinhole camera shortly after the Cambrian explosion, and a chambered complex eye like ours evolved over 500 million years ago [5].
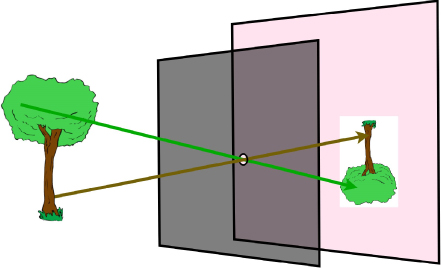
Figure 11.2 A camera obscura or pinhole camera is shown in this illustration. The discovery of the pinhole camera gave rise to geometric optics and the ray theory that postulates that light travels in straight lines.
Michael Faraday, in 1846 [6], was the first to describe light as a field similar to the field theory he developed for electricity and magnetism. Almost 100 years later, Gershun [7] defined the light field as the uncountable infinity of points in three-dimensional space where each point can be characterized as a radiance function that depends upon the location of the point in space and the radiance traversing through it in every direction (Figure 11.3).
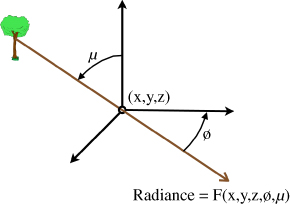
Figure 11.3 An arbitrary point in space is shown with a ray that originated on the trunk of a tree passing through it in a direction relative to the point at azimuth and elevation angles  and
and  , respectively. The radiance in this direction through the point is
  . This is Gershun's definition of a point in the light field; Adelson and Bergen called this the 5-D plenoptic function.
Light traversing a point in the light field continues to move beyond the point until it encounters impedance that can alter its course by reflection, refraction, or extinction. Every line or ray passing through a point in the light field in terrestrial space will be terminated by two surfaces, one at each end. Every ray defined this way contains two packets of information, each going in opposite directions. If the ray is not very long and there is nothing to impede it, this information is almost entirely redundant at every point along the ray. The information carried on the ray is unique to the surfaces and light sources creating the packets, and this is the information biological vision has evolved to sample and use.
Adelson and Bergen [8] called Gershun's radiance function the 5-D plenoptic function, indicating that everything that is visible from a point in free space is contained in it. They described how our visual system extracts information from the light field to discover properties of objects and actions in our visual environment. The plenoptic function contains information about every unobstructed surface in the lines of sight to the point in space and, by adding time, the 6-D plenoptic function, how these surfaces change over time.
J. J. Gibson called the information we gather from the light field affordances [9], because it informs behavior; for example, when to duck as an object looms towards us. Information that is not useful in affording an action is not extracted from the light field. The Mach Bands illustrated earlier is evidence that our visual system sometimes enhances the information by signal processing to make features such as edges more salient and visible. Discounting the illuminant is an example of an affordance. It is more important for behavior to recognize the light-reflecting properties of a surface than it is to sense how the illuminant changes those signals. For example, it is important to detect ripe or spoiled food equally well in firelight or in sunlight. The illusionary colors in Figure 11.1 are actually examples of how the visual system attempts to remove changes in the illuminant that occur in shadowy environments, or as the illumination changes (e.g., when surface reflections alter the spectral content of illuminating a surface).
The physical ground truth of a perception can be considered in terms of the utility of the actions taken in response to a perceptual experience. Evolution has optimized percepts to generate behaviors that support survival. The percept of an object will correspond to the real physical properties of the object when those properties are critical to affording an appropriate action that assures the survival of the organism and, thereby, the genes it passes on to future generations [10].
A pinhole camera forms an image based upon half of the plenoptic function at the location of the pinhole. The pointing direction of the camera determines which half is selected. The ideal, or theoretical, pinhole camera consists of a vanishingly small hole or aperture that, in theory, would allow a vanishingly small amount of light through to form the image. In practice, the pinhole camera's aperture is always large relative to the wavelength of light and, therefore, consist of many ideal pinhole cameras, each slightly displaced spatially relative to their neighbors within the plane of the pinhole camera's aperture. Real pinhole cameras, as opposed to ideal ones, create an image that therefore is a composite of many ideal pinhole cameras, each projecting an image slightly displaced relative to its neighbor on the projection surface of the camera. The shifting and combination of images by light addition is illustrated in Figure 11.4; it is expressed as blur.
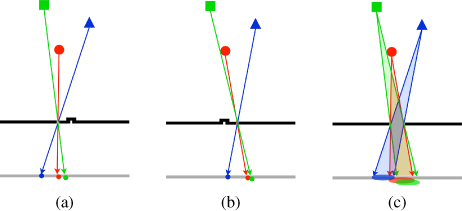
Figure 11.4 A pinhole camera with a variable size and location aperture is illustrated in this diagram. In panel A, a small aperture is located on the left and rays from points on three objects are traced to the projection surface of the camera. The small aperture is moved to the right in panel B illustrating parallax changes, and finally in panel C the aperture is enlarged from location A to B to illustrate blur created by the superposition of all of the pinhole images generated by small pinholes filling the larger aperture.
In the left panel, labeled A, in Figure 11.4 three points of the surface of three different objects within the field of view of a pinhole camera are shown. The arrowed lines indicate rays originating at these points as they pass through the pinhole and ending on the projection surface of the camera. In panel B, the pinhole has been moved slightly to the right and the corresponding locations of the projected points, again illustrated with the arrows, has shifted on the projection plane. The rightmost panel, labeled C, shows the composite of all of the idealized aperture projections when the pinhole is enlarged from its location in panel A to its location in panel B. Now a bundle of rays from each surface point send rays of light onto the projection surface. The resulting projections of each point on these three objects surfaces have grown larger on the projection surface in panel C. This is called blur, and it takes the shape of the pinhole aperture. Additionally, these regions of blur overlap, reducing image contrast in the overlapping regions. As the aperture is enlarged to let in more light, the resulting pinhole camera image is increasingly degraded by blur. The amount of blur depends upon the aperture's size and shape.
The pinhole-chambered eye of the Nautilus can sense the direction from which images are formed on its circular projection surface or retina. It has been demonstrated in laboratory tests that the Nautilus's visual system is capable of sensing the direction of motion [5, pp. ![]() ] of objects in its field of view. This behavioral response to motion is evidence for the evolution of a neural signal processing system capable of extracting affordances from the light field of even a simple eye. This behavior is valuable to the Nautilus in escaping predation. It is an example of image understanding in the Nautilus's visual system.
] of objects in its field of view. This behavioral response to motion is evidence for the evolution of a neural signal processing system capable of extracting affordances from the light field of even a simple eye. This behavior is valuable to the Nautilus in escaping predation. It is an example of image understanding in the Nautilus's visual system.
The individual rays that pass through the aperture can also be characterized by the time it takes for light to travel along each ray from a point on the surface of the object, to a location within the camera's entrance aperture, and then onto the projection surface. Most of these distances will be slightly different and, therefore, associated with slightly different times. This information is called phase. Biological systems do not respond fast enough to measure the time differences, but phase has spatial consequences on the projection surface.
As the size of the pinhole aperture increases, more light is imaged onto the retina, improving sensitivity – but spatial resolution is lost due to blur. As a result, a more complex chambered eye, with a lens in the entrance aperture, similar to most cameras today, evolved during the Cambrian Explosion. The common snail, Helix, is an example of a simple chambered eye with a lens. Eyes with lens are found in the fossil record of the eye, going as far back as the just a few million years after the Cambrian Explosion began. A complex chambered eye similar to the human eye evolved within the first 50 million years of the Cambrian period [5].
A lens placed in the aperture takes all the rays emanating from single points on the surface of objects that are at the focal distance of the lens passing through the entrance aperture, and brings these rays to focus at single locations on the projection. Image details are critical to affording critical behaviors (e.g., foraging) so, in biological systems, eyes have developed lens systems capable of changing focus to bring surface detail into sharp focus. The lens, then, is a solution for the resolution loss caused by blur.
The lens solution requires some means of controlling the lens focus. Surfaces that are not at the focal distance remain blurry. Points on out-of-focus surfaces come to focus either in front or behind the projection surface. For these bundles of rays, their projection on the projection surface of the camera or eye are dispersed as blur. For cameras and eyes where the aperture is circular, the blurred points form circles of blur on the projection surface. When a lens is added to the system, the size of the blur circle will depend upon the relative distance of the surfaces, either in front or behind the focal distance of the lens. Just as in the case of the pinhole camera blur not only limits spatial resolution, it also reduces image contrast by overlapping circles of blur.
A naïve view of biological vision is that chambered eyes are insensitive to phase. Blur information is the product of phase differences, as light at any moment in time reflecting from points on a surface arrives at the entrance aperture of the camera or eye at slightly different times. The focus mechanisms in biological vision use blur to close the control loop, bringing the lens to focus at distances determined by attentive mechanisms within the visual system.
The amount of blur in a lens system depends upon the aperture size and the relative distance to the in-focus surfaces in the camera's field of view. Blur has been shown in the laboratory to permit the human visual system to estimate depth when it is the only cue present in the image [11]. The visual system is, therefore, capable of extracting useful information generated by phase differences in the images projected onto the retina in this limited sense of using phase correlated information sampled from the light field.
As the location of the idealized pinhole changes within the aperture of a camera, so does the spatial information contained in the plenoptic function. These changes are due to parallax. Moving the camera or the eye to the left or right is often all that is required to see around an occluding object, as this action results in sampling a slightly different set of plenoptic functions in the light field. However, some of this occluded information is available at every camera or eye position, because the entrance aperture of the camera or eye is not a single point in space. Only the parallax information contained in rays for points on in-focus surfaces is lost, because the lens places all of these rays on top of each other within the image projected onto the projection surface of the camera or eye. Information from points on occluded surfaces remains available on the projection surface.
The top diagram in Figure 11.5, labeled A, shows a ball focused onto the projection surface of a single lens camera; the projection surface is shown as a vertical line in the figure. The bundle of rays show the collective paths of all of the rays emanating from a point on the ball as they are collected by the entrance aperture of the camera and focused onto a point on the projection surface. A triangle behind the ball is partially occluded. Neveretheless, rays from a point on the triangle's surface that are on the camera's optical axis and occluded by the ball are still imaged onto the projection surface. These rays enter the camera near the peripheral edge of the camera's entrance aperture and are blurred on the projection surface.
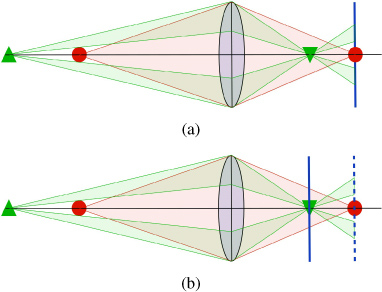
Figure 11.5 In the upper diagram in this figure, a ball with a triangle behind it is imaged onto the projection surface by a lens. In the bottom diagram, the triangle is brought to focus on the solid surface by changing the focal length of the lens. Despite the pyramid being occluded by the ball, it can still be brought to focus, because enough rays are collected through the periphery of the lens aperture in this illustration. The contrast of the triangle would be degraded (i.e., reduced) by the blurred image of the occluding ball. Changing focus would, in this limited way, be “looking through” the ball.
Focusing the camera at the focal distance of the green triangle would bring the rays from the triangle into sharp focus. This is shown in the bottom diagram, labeled B. Cameras change focus by changing the distance to the projection surface, as shown in Figure 11.5, diagram B. A chambered eye would change the focal length of the lens to bring a different focal distance within its field of view into focus on the eye's retinal surface. These are nearly equivalent ways of achieving the same goal. Now the point on the triangle is in sharp focus, despite being occluded by the ball along the primary optical axis of the camera or eye. When this situation exists, changing the focal distance can make the occluded surface visible. The visibility of the occluded surface depends upon the size of the occluder, the separation between the occluded and occluding surfaces, image contrast, and the entrance aperture or pupil size. It is possible to see behind occluding surfaces by just changing focus.
Ordinary cameras do not capture the angular information contained in these rays and, once the image is captured, the information is lost. In biological vision systems, this information is sensed as blur and can be accessed by changing focus, or by translating the eye to a slightly different location. Because the center of rotation and the eye's optical nodal point are displaced relative to each other, a small eye movement produces a translational change and a new heading direction. Biological vision has evolved to use all of these techniques to access the parallax information in the light field.
Motion parallax is generated by object motion in the field of view of the camera or eye and by camera or eye motion. Motion parallax is captured in video recordings, and can give the viewer a strong sense of depth while watching a video sequence where objects in the field of view or the camera are moving. The Nautilus example mentioned earlier is evidence that the early evolution of biological vision systems created mechanisms capable extracting parallax information from the light field. Visual systems with two or more eyes with overlapping visual fields also extract parallax information from static imagery [5].
We are rarely aware of occasions when occlusions can be defeated by changing eye focus, but it is believed to be a common occurrence for small objects in the near field. Blur information in the image has been proven to be useful in perceiving depth [11]. Some of the parallax information in the light field that affords these behaviors is lost when imagery is gathered and archived by ordinary still and video cameras. Without this information, these behaviors are not possible. The ability to reconstruct this information in future imaging systems would, therefore, add useful information to current video imaging technology.
Cameras are not capable of understanding the image without an active process to analyze the image data. The only data captured by a traditional camera can be described as a two-dimensional array of intensities indexed by their location on the projection plane. In the case of the eye, the retina, where the image is formed, is populated with photoreceptors that encode the image as punctate neural signals. These signals are analyzed by a network of neurons within the visual pathways of the brain.
The distance to objects in the camera's field of view can be derived from the size of objects within the image, the occlusion of objects by other objects, from blur, from perspective, or from the loss of contrast due to scattering in the atmosphere. Parallax information projected as blur, even in static images, is a useful signal from the light field to derive object distances. In order for any of these signals to be used to extract distance information, the image processing must be able to segment the image into distinct objects. This is why biological vision and imaging processing for image understanding are both fundamentally object-oriented processes.
Our visual system has evolved neural mechanisms that use parallax to estimate the distance to objects and the closing rates of looming objects. These estimates are based upon data extracted from the light field sampled over a period of several milliseconds. Object recognition and identification, linear and aerial perspective, occlusion, familiarity, and other features of the imagery projected onto our retinas over time, are all used by the visual system to augment our image understanding of the location, size, range, surface relief, etc., of objects in the visual field.
11.3 Light Field Imaging
The information in the light field passing through the pupil becomes more or less accessible to visual cognition, depending upon the eye's focus. Focusing, as noted above, superimposes all of the rays passing through the pupil that originated at single points on the surfaces at the lens focal distance to single in-focus points on the retina. Rays originating on out-of-focus points are spread over the retina in circles of blur whose size depends upon focus and pupil diameter. Figure 11.6 illustrates focus for a schematic eye showing four bundles of rays that originated from each of the ends of two arrows. The arrow on far left is in focus while the other arrow is not.
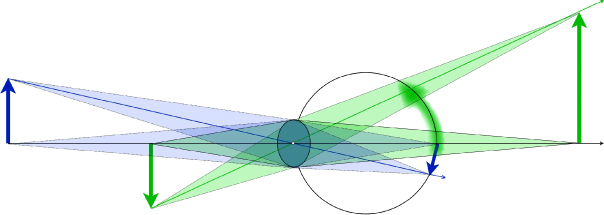
Figure 11.6 This diagram shows a schematic eye focused on the blue arrow. The transparent bundles are the rays from the end points of both arrows that form images of the end points on the retina. The leftmost arrow's image is sharp on the retina and the bundles converge to a point on the retina. The other arrow would come to focus on a projection plane behind the retina. Rays emanating from the this arrow's end points are spread or blurred over a wide area of the retina. When an out-of-focus object occludes an in-focus object, the blur reduces the image contrast of parts of the in-focus object.
Focusing the image on the projection surface aggregates information from all the rays passing through the pupil. When the information in these rays is correlated, (i.e., originated from the same point on an in-focus surface), the aggregate signal is strengthened. When the rays projected onto retinal locations come from several different surface points, and are therefore uncorrelated, information is mixed together and blurred, reducing the signal strength and image contrast. The information captured from the light field is not lost but to see it we must focus on different surfaces.
Image-capture and reconstruction in traditional 2D and s3D imaging systems do not support refocusing, and the only parallax information available in s3D is fixed by the location of the two cameras. When viewing natural scenes, we move our eyes and translate and rotate our heads to obtain more parallax information from the light field. We can refocus our eyes to rearrange and sort the bundles of rays coming from all the points that traverse our pupils.
The signal for focusing is missing with traditional image technology, as is a great deal of the parallax information, but our visual system has evolved to use this information. The result can be annoying and uncomfortable. For example, when viewing a large displayed image, the viewer might attempt to view an object on the screen that is out of focus or may move their head to see around something in the scene. No effort on the viewer's part can bring an out-of-focus object in a displayed image into focus, or allow them to see behind an occlusion.
A 2D video sequence, during which the camera moves, or in which objects are moving in the scene, can evoke the perception of depth in a scene. However, as soon as the motion stops, these motion-parallax-driven cues, along with the sense of depth, are lost. The inability to see around occlusions and the fixed image focus in standard 2-D and s3D imagery are the missing and/or inaccessible light field data.
Cameras that can retain the perceptually relevant information in the light field have been developed. The idea for this camera has many sources: Lippmann and Ives [12] and, more recently, Adelson and Wang [13] and Ng et al. [14]. Lytro recently introduced a light-field camera into consumer markets, and a commercial version of a light-field camera is available from Raytrix [15]. Understanding how these cameras capture the light field reveals what is required to build a true light-field display capable of reconstructing parallax information appropriate for any head position, and which supports attention-driven focusing.
The plenoptic camera design of Lytro and Raytrix is similar to an ordinary camera or to the eye in its basic design. To illustrate the principles of operation of this type of plenoptic camera, a spherical camera similar in geometry to the eye will be used. We will call the entrance aperture of the plenoptic camera the pupil, and the projection surface where images are formed will be called the retina. The eye's lens, called the primary lens, is located very close to the eye's pupil, and we will imply the same geometry for this plenoptic camera, although that is not a requirement [16].
A plenoptic camera has an array of tiny pinhole cameras located where the retina would be located in a real eye. These cameras can also have a lens, but that is not a requirement. The tiny cameras located on the projection surface capture images of the rays passing through the pupil. Every pinhole camera has its own unique entrance aperture, located at uniformly spaced positions within the array of tiny cameras. The uniform spacing is required to sample the light field uniformly, but this, too, is not a hard requirement. The human eye, for example, does not have a homogenous uniform array of photoreceptors, because the image we sense is a construction of the visual system and not simply a representation of the momentary image formed on the retina. Two of these pinhole cameras are illustrated, very much enlarged, in Figure 11.7; all of the other pinhole cameras are too small to be seen in this illustration.
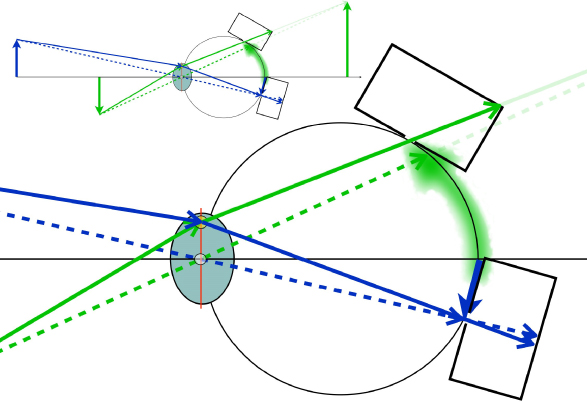
Figure 11.7 Ray tracings for two rays originating at the tip of the left arrow and two rays originating at the tip of the right arrow are followed as they come to focus at different depths in the upper small illustration. The left arrow is in focus on the retina, whereas the right arrow comes to focus behind the arrow. The enlarged illustration traces the rays as they are captured by the apertures, or miss them, in the case of the green dashed ray of two pinhole cameras located on the retina.
Every tiny camera captures a slightly different image, depending upon its location in the array. Where rays from points in the 3D object space enter the plenoptic camera depends upon the location of these points in the visual field. Where rays traversing locations in the pupil of the plenoptic camera are projected onto the pinholes in the tiny camera array depends on the plenoptic camera's primary lens focus. A plenoptic camera does not require a primary lens that can change focus to make sharp images of any point in the visual field. A 2D image, reconstructed from the plenoptic camera's data and focused at a different focal distance than the primary lens, is made possible by rearranging the data captured by the array of tiny pinhole cameras.
Two rays from separate points in the 3-D object space entering the plenoptic camera at the same location in the pupil will generally be imaged to separate pinhole cameras. Two rays entering the plenoptic camera from the same point in 3-D object space will only be projected to the same pinhole in the tiny camera array if their point of origin is at the focal distance of the primary lens. This is illustrated in Figure 11.7, which traces four rays as they traverse the pupil and are projected onto the pinhole camera array. One ray from each of the two arrow tips passes through the center of the pupil; these rays are shown as dashed lines in the figure. A second ray from each arrow's tip passes through the same peripheral location in the pupil; these rays are represented as solid lines.
The leftmost arrow is in focus; it is at the focal distance of the primary lens, which forms a sharp image of all points in the camera's field of view located at the lens' focal distance on the retina. The solid and dashed rays are both projected by the lens to the same pinhole camera location in the tiny camera array. The two rays are traced as they pass through the pinhole at this location and are projected onto the back surface of this tiny camera. The locations of the rays on the pinhole camera's back surface are correlated with the entrance pupil locations of the rays. These locations are correlated with phase differences in the rays traveling from the arrow's tip. This is the directional information that is lost in ordinary cameras. Most, or even all, of the rays projected onto this pinhole will have originated at the same point on the leftmost arrow's tip. The image projected on the back surface of this pinhole camera records each ray's location and phase in the plane of the pupil.
The dashed and green lines tracing the path of rays from the right arrow tip are projected to different locations on the pinhole array, because this arrow is not in focus. Different pinhole cameras will record the directional information contained in these two rays. The plenoptic camera nonetheless captures all of the directional information contained in these rays, so no directional information is lost. The plane of the pupil or camera aperture was characterized earlier as a collection of plenoptic functions each slightly displaced relative to the others within the aperture plane. The array of tiny cameras is sampling these plenoptic functions. Each unique location on the projection surface of this array of cameras corresponds to a single ray or heading direction from one of the plenoptic functions in the aperture plane. The plenoptic camera is effectively sampling all of these functions simultaneously.
Rearranging the data collected by the plenoptic camera allows the reconstruction of a 2D image that can be focused arbitrarily at a focal distance different from the primary lens focus of the plenoptic camera. The resolution of this reconstructed image is limited by the resolution of the micro camera array and the lens. A plenoptic imaging system capable of reconstructing a 2D image at an arbitrary depth cannot be a passive system; it requires image processing to work. The basic operating principles of this camera are similar to the system described by Lippmann [12].
In summary, rays originating at points in focus in the scene will be captured by a single pinhole camera in the array and rays originating from out-of-focus points will be captured by different pinhole cameras. Capturing the directional information is the key to capturing the light field in a small region in free space, i.e., where the plenoptic camera's entrance aperture is located.
Figure 11.8 illustrates what happens in a plenoptic camera when two points in 3D object space are located along the same direction from the eye, and one point is nearer to the eye than the other. This is illustrated with points on the base of the two arrows illustrated in Figure 11.7. These figures represent a top down view through the camera with the lefmost arrow pointing to the right from the camera's point of view and the right arrow pointing to the left. The latter arrow is out of focus and its base occludes some of the rays from a point on the base of the in-focus leftmost arrow.
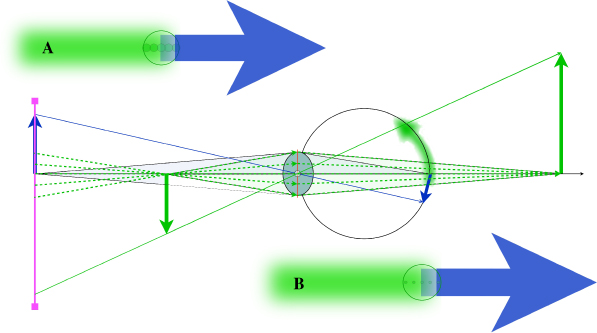
Figure 11.8 The middle of this diagram is a top down view of an eye that has focused on a green arrow pointing towards the observer's right. This arrow is partially occluded by an out of focus green arrow. In this diagram the purple line on the left represents a horizontal cross section of a light field display. The green dashed lines represent rays from the display surface that are discretely reconstructing the blur signal contained in the light field. Suppose the number of rays reconstructing the blur is sufficient to drive the eye's focus, which would mean that the observer viewing this display could focus at arbitrary depths within the viewing volume reconstructed by the display. Nonetheless the reconstructed blur might appear as a series of intense greenish spots as depicted on the retina in the insert labelled B in the lower right corner of the diagram or as overlapping small patches that merge smoothly into a blur as depicted on the left insert labelled A. The point here is that there might be a salient difference in the resolution required to drive the focus control mechanism of human vision and the number or rays required to produce good image quality in a light field display of the future.
The dashed lines in Figure 11.8 represent the rays from the base of the right arrow (ignoring for the moment the dashed lines continuing to the left from the base of the right arrow to the vertical line) that pass through the camera's entrance aperture and are projected onto the entrance apertures of five adjacent micro-cameras on the micro-camera array located on the camera's projection surface or retina. The micro-cameras are not shown in the diagram, but they would be located and centered at the locations where the dashed lines intersect the retina.
The spacing of the micro-cameras determines the spatial resolution of the captured image. In the insert in the upper left of this figure, labeled A, is an illustration of the image formed on the plenoptic camera's retina. The large circle within the base of the right arrow's out-of-focus image on the retinal surface is a large circle representing the blur from a single point at the base of this arrow. The five smaller circles within this circle represent the footprints of the pixels in the adjacent micro-camera array that are sampling the directional information from this point.
The micro-camera located on the optical axis of the primary lens will sample three rays, not shown in the diagram, from the base of the left arrow that is in-focus on the camera's retina. The left arrow occludes rays from the base of the right arrow that would pass through the left half of the primary lens. This data could be rearranged by image processing to render a 2D image reconstruction that changes the focus of the camera from the left arrow to the right one. In that case, the five samples from the base of the right arrow would be added together to form one pixel in the reconstructed image of this arrow that would now be in-focus. The three ray samples captured from the base of the left arrow by the micro-camera located on the optical axis of the plenoptic camera would be dispersed in this refocused and reconstructed 2D image as blur.
Now consider a different interpretation of the diagram in Figure 11.8. Suppose that the vertical line on the far left is the surface of a light field display viewed from above. In this interpretation of the diagram, the eye shaped camera is not a camera, it is a real eye. The display, represented by the vertical line, consists of an array of projectors, with each surface point reconstructing the plenoptic function at that location on the screen. The viewing volume, within which an observer can peer into a reconstructed light field, is located to the right of the display, where the eye is located in the diagram. The display must be able to reconstruct the plenoptic functions that would exist within this volume and within a finite volume behind the screen, so that when an eye is located at any point within the viewing volume, it can sample reconstructed plenoptic functions as if they were virtual.
There are at least two resolution requirements: first, for good image quality, the display element pitch much be good enough to reproduce the range of spatial frequencies that are considered acceptable. The window of visibility of the eye with regard to spatial details is bounded by several limits: brightness, contrast, and spatial frequency [17]. High-quality displays today are designed to produce approximately 30 line pairs of spatial information at the near viewing point. For a cell phone display that can be held very close to the eye, this means a dot pitch of over 200 pixels per inch.
In most viewing conditions, there is rarely sufficient contrast in the reconstructed signal to require more spatial information in the reconstructed imagery. Additional spatial resolution beyond this limit can nevertheless improve image quality when the spatial limit of the window of visibility has been exceeded. The added detail produces a spatial dither that can improve the tone scale rendering by effectively adding one or more bits of grayscale information to the reconstructed image. The ability to modulate the intensity of the picture elements over a range of at least three orders of magnitude, and the ability to produce a good black, are both critical determiners of subjective image quality.
The light field provides the signals that the nervous system uses to close the loop on focus, so these signals must be reconstructed, too. There is no reason to suppose that providing an adequate signal to drive focus will also provide an adequate signal to produce an acceptable level of image quality.
In this alternative interpretation of Figure 11.8, there is an object in front of the display – the right arrow – and one located in the plane of the display, the left arrow. The dashed lines represent rays projected from the light field display screen towards the eye viewing the display. In this example alone, in the horizontal extent of the display only, five light field picture elements project rays that pass through a point in space representing the base of the right arrow and additionally go through the eye's pupil, producing an image on the retina. If five rays must pass through the pupil on a diameter of the pupil to close the control loop for focus, then this would define the furthest distance from the screen that a viewer could view the display and focus within the viewing volume. A similar limit exists for the distance behind the screen.
When the eye is focused on the left arrow located on the light field display surface in this illustration, the five rays reconstructing the right arrow base must form a circle of blur on the observer's retina. Ideally, the rays within the circle of blur on the observer's retina would be overlapping and large, as in insert A in this figure. If, however, they are punctate non-overlapping and bright, as in insert B in Figure 11.8, then they might be sufficient to drive focus but insufficient to produce an adequate level of image quality. The optical requirements for these rays and the number of rays required to drive focus are unknown quantities today, because the appropriate experiments to determine them have not yet been performed.
Another aspect of the display that is illustrated in this diagram is the need for the display to sense the distance from the observer to the display screen. In this example, the right arrow is occluding the left arrow, so not all of the rays from the left arrow base are being rendered by the display. Suppose, however, that the observer were to move closer to the display. In this case, it might be possible to position the eye between the location of the virtual arrow reconstructed in front of the light field display screen and the screen. In a virtual reconstruction of the light field, it would be possible to physically pass through virtual objects reconstructed in front of the display. Once this has occurred, the occlusion created by the virtual object would vanish. The light field display would have to be able to sense the location of the observer relative to the display, and adjust the reconstruction imagery accordingly.
In s3D displays today, there is a clipping artifact that is called an edge violation in the entertainment video industry. In everyday visual experience, we perceive objects going behind occlusions, e.g., someone seen through a window walking past it inside a building. The disappearance of the person as they walk behind the wall is expected and ordinary. In stereo pair display reconstructions, especially in entertainment videos and cinema, it is commonplace to reconstruct objects and people in front of the display screen. When these objects and people move beyond the limits of the reconstructed image pairs on the right, left, top or bottom of the screen, the resulting appearance of an object or person being occluded without an obvious occluder is perceptually disruptive and odd.
The entertainment industry has adopted four workarounds and combinations of them to avoid these artifacts. Objects in front of the screen and near an edge can be rendered out of focus to reduce their salience in the scene and their physical contrast on the screen. In front of the screen, objects are rendered with a vignette or spatial apodization as they approach the screen edge. This also reduces the object's image contrast as it nears the edge. A floating window, or high contrast occluding edge, is created in one or both of the image pairs to produce a surface that, if it existed in the theatre, would occlude objects in front of the screen. A fourth workaround is to vary the flatness of the objects in various parts of the scene by changing the amount of image pair disparity – typically flattening objects in front of the screen and near edges, to reduce the perceptual salience of these artifacts.
Figure 11.9 illustrates the equivalent clipping artifact in a light field display reconstruction of a scene. In the top portion of this illustration, the upward-pointing and downward-pointing arrows are both fully rendered by rays produced by the light field display surface and that enter the obsever's pupil. The lower illustration shows the ray clipping that will occur if the imagery and observer are both translated to the left (recall that this is a top-down illustration). Now there is no display surface to reconstruct the tip of the downward-pointing arrow. It simply vanishes from view. This is essentially the more general case of the edge violation in today's s3D reconstruction. Whether or not similar workarounds to those used by the entertainment video industry today to mitigate this kind of artifact is another subject for future research and development.
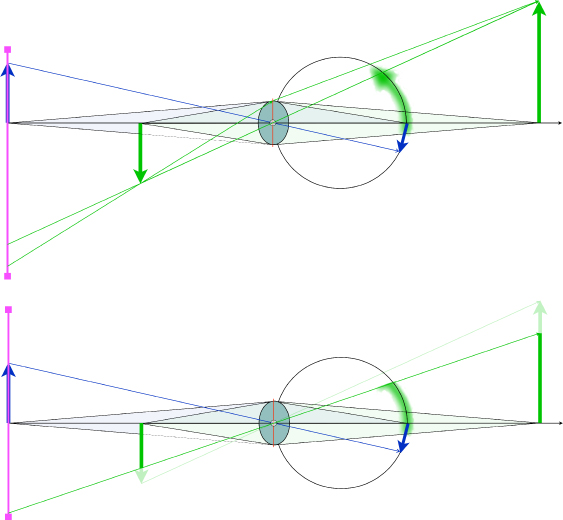
Figure 11.9 The top diagram in this illustration shows side view of a light field display (vertical lines on the extreme left) reconstructing an upward-pointing arrow that is in focus and a downward-pointing arrow partially occluding it and out of focus. Rays from the bottom (in the diagram) of the screen are necessary to render the blurred tip of the out-of-focus downward-pointing arrow. If the image and observer were to shift downward relative to the display screen, then a more general form of an edge violation will occur in this rendering of the light field and, just as in s3D displays, it is likely to appear very strange to an observer as the object that would be occluding the downward-pointing arrow's tip, which would logically be between the observer and the arrow is missing.
In video communication systems, where imagery is captured or constructed by a computer graphics system, it is possible to manipulate the scale and perspective of objects rendered on the display screen. One can only speculate about how these parameters will impact the appearance of imagery reconstructed on a light field display. Another phenomenon unique to today's s3D imaging technology is the cardboard effect. Watching a soccer game on a s3D display can make the players look like miniature people who are flat when viewed from a wide angle long shot from the top of a stadium. What is causing these perceptual phenomena is currently a research topic. It may be due to scaling issues created by exaggerating disparities in scenes with wide depths of field and sharp focus, but what exactly causes this perceptual artifact is yet to be determined. Nonetheless, one can expect similar issues to emerge as light field display and light field capture become part of the tool set for video communications.
The same spatial and temporal resolution requirements that apply to ordinary 2D displays will apply to a light field display. At half a meter viewing distance, a 100-dpi display produces about 15 line pairs per degree of visual angle, adequate for many display tasks at this viewing distance. For a handheld display that will be viewed closer to the eye, 200 dpi or more is appropriate. Temporal-resolution requirements are the same as in current displays. Avoiding or controlling temporal artifacts such as flicker, judder, motion blur, and a recently documented temporal artifact in s3D imaging [18], must be considered to determine the frame rates required for any specific task, especially if interlacing becomes part of the reconstruction architecture of these devices.
11.4 Towards “True” 3D Visual Displays
To summarize the discussion of the proceeding sections, the requirements for the optical system of a true 3D display can be understood by thinking of the display as a plane of plenoptic function generators. One way to visualize this is to consider the display system as a window. Consider a window to be divided into small area patches – so small that if we were to block off the entire window except a given patch, we would only see a color and intensity, as it is too small to see image detail. Considering the descriptions in the previous sections, the window can be considered to be an array of pinholes, where the light coming from each pinhole is half of the plenoptic function for the point located at the pinhole. In our depiction of the display system, each of these window patches will correspond to a pixel. For example, consider Figure 11.10, showing the light passing through a very small patch of a window near its center.
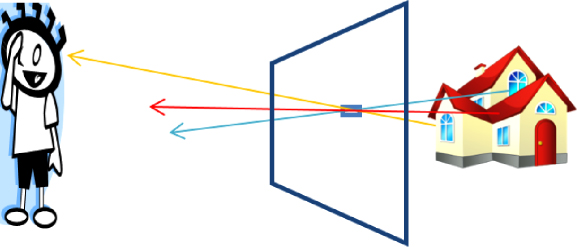
Figure 11.10 Depiction of the light rays going through one “pixel” of a window coming from different points of a toy house behind the window. To the viewer, in the position shown, the pixel will appear to be the color of the walls.
The color and intensity of light that comes through the small patch depends on its angle. From the angle shown in Figure 11.10 going to the viewer's eye, the viewer sees the color of the walls, but at other angles the viewer would see the color of the roof or the color of one of the windows. So, from each patch on the window, there is a bundle of rays emerging that is characterized by an angle, color, and intensity.
Thinking of the display as a window, we only consider displayed objects that are behind the display screen. As shown in the previous sections, it is possible to display objects in front of the display screen as well. However, in this case, the display cannot be considered to be a plane of points where the plenoptic function is uniquely defined. For objects in front of the screen, as pointed out earlier, the display would need to adjust its output, taking into account the location of the observer relative to the display.
The window analogy also points out that for some cases, the display needs to be physically large to provide a “true” life-like 3D image. For example, in Figure 11.10 the toy house is shown to be smaller than the display screen. If a real house were behind the display screen, a distance roughly equal to the size of the window, it would obviously only be possible to see a very small portion of the house.
From the window analogy for the display, it can be considered that the difference between a 3D and 2D display is the angular dependence of the pixel (plenoptic function) information. This angular dependent information conveys three aspects of the 3D scene:
- Relative motion of objects (an eye sees a different view when it is moved).
- Stereopsis (each eye sees a different view).
- Focus (the angular spread of rays, intercepted by the pupil from a point in the scene, is determined by its distance from the viewer).
In adding these characteristics to a 2D display, it is also important that the resolution of the display remains high – near the limiting resolution of the eye – as the textural cues are important in perception of depth and “realism” of the image. If we consider the “ultimate” 3D display as one that can emulate a window as described above, we need to have a display with a high density of pixels that change color and intensity for different directions of view with very high angular resolution. If we say the eye collects a cone of rays spanning several tenths of a degree, and we would like have an adequate angular resolution to achieve a proper focus, it is likely that we would need a 0.1 degree angular resolution. If we then consider that we would like the window to be viewed over a 100 degree field of regard, we would need each pixel to provide 1 million rays of light, each with a defined color and intensity. A 3D display with these specifications would have its bandwidth increased by a factor of 1 million over a 2D display with the same size and resolution, which is well beyond the current state of liquid crystal technology.
Due to this information content issue, many 3D display systems only provide the stereopsis cue. This can be done with “autostereoscopic” systems, where the color and intensity of each pixel on the screen varies as the angle of observation is changed [19]. In these systems, the angular dependence of the information does not need to be so high, with only enough to get separate views to each eye. However, in such systems, the spatial resolution of the display is lowered.
Using polarized glasses is another method to provide the stereopsis cue. Systems using this approach can be divided into those that use “active” glasses and those that use “passive” glasses [20]. Passive glasses, however, have the advantages of light weight and being able to provide improved brightness, through the use of an active shutter as shown in Figure 11.11.

Figure 11.11 A display screen in the background and a polarization rotator panel in the foreground. The image is being rastered downwards, changing from the left eye view to the right eye view. The polarization rotator is designed to output light of one polarization state, that is transmitted by the left lens of the glasses (not shown) worn by the viewer, and another polarization state that is transmitted by the right lens.
The figure shows a display screen that field-sequentially shows the left and right eye view images, at the instant in time where the scanning of the display is halfway down the screen, erasing the previous right eye's view and writing the left eye view. In synchronism with this, the segmented active shutter, which controls the polarization state of light, changes its segments from passing the polarization sate that is transmitted by the right eye to that which is transmitted by the left eye [21].
In the case where the display screen is far from the viewer, the first and third cues listed above may be less important and ignorable (as in the case of a movie theater), and only the stereopsis is needed to provide a 3D image. However, this simplification may not work for scenes close to the viewer, such as would be portrayed on a desktop or mobile display. In this case, both the cues of relative motion and focus could be significant, especially the relative motion cue. The significance of the effect of relative motion is most easily understood by noting how the 3D information in a scene can seemingly jump out at the viewer if the viewer location is in motion. An excellent video that demonstrates this effect has been made by Lee [22].
Taking into account the relative motion cue, but not attempting to take into account the focus cue, reduces the requirement on the angular resolution to that which is required to produce stereopsis and smooth motion. The angular resolution, in this case, might be on the order of one degree, and can further be considered to be limited to only the horizontal direction. Here, the bandwidth of a 3D display is increased by a factor of “only” 100 over a 2D version. However, if a single viewer is considered and head tracking is used, systems with only two views are required.
Systems using passive glasses and head tracking have been demonstrated by zSpace [23], as well as autostereoscopic systems by SuperD [24]. Systems of this type that provide both the relative motion and stereopsis cues are quite effective. However for a “truer” 3D display, the focus cue should be added. While the need to include the stereopsis cue and relative motion cues are recognized as being essential to true three-dimensional displays, the importance of the focus cue may be less obvious.
An early paper investigating the importance of the focus cue was done by Inoue [25], who showed that, in the case of the presentation of a 3D image, the eyes accommodative response attempts to follow the pupillary response and focus at the target depth. However, the fact that the eyes need to focus on the image source to see the image sharply causes a conflict with this response. A recent complete review of the discomfort that can result from this conflict has been provided by Shibata [26].
Shibata's “zone of comfort” graph is shown in Figure 11.12. The axes is scaled in Diopters, that is, the inverse of the focal length measured in meters. If we consider a display screen that is half a meter from the viewer (vergence distance is then 2D), the region of comfort for a stereo image will be about from 67 cm to 40 cm (1.5–2.5D), or only about 17 cm behind the screen and 10 cm in front of it. This is a very limited range of depth and is a major issue for future development of true interactive and immersive 3D displays.
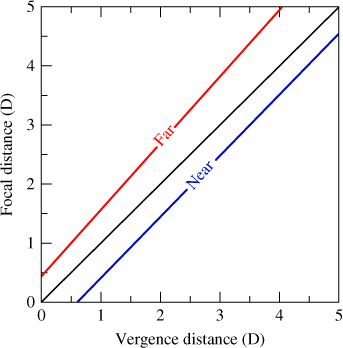
Figure 11.12 Zone of comfort is between the lines marked “Far” and “Near”, where the convergence distance and focus distance are similar. Adapted from T. Shibata, J. Kim, D. Hoffman, M. Banks, 2011.
In considering a solution to this problem, Kajiki [27] and Takaki [28] have shown that an autostereoscopic system that has high enough angular resolution to provide several distinct views to the eye's pupil can cause the correct focus response. Figure 11.13 shows the idea that diverging rays from a 3D object are brought into focus on the retina by the appropriate focus response of the eye.
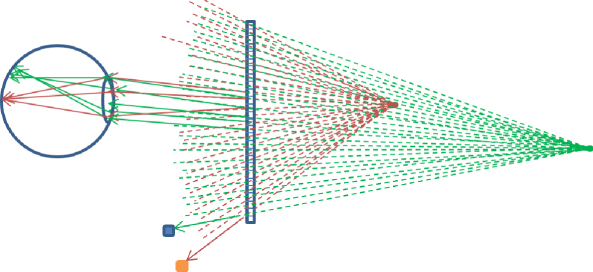
Figure 11.13 Accommodation with high-density of horizontal parallax images. Shown are two objects (dots) to be presented to the viewer by the display screen for a top view of the display screen that here has about 25 pixels. Each dashed line corresponds to the light ray from one of the dots through each pixel of the display. For the uppermost small detector, the bottom pixel on the display would appear the colour of the object further away, while for the lower detector it would appear the colour of the nearer object. For other detector positions, light from the dots would not be detected by those detectors looking at the bottom pixel. Rays from the screen related to the closer dot are more diverging than those from the more distant dot because of their relative distance behind the screen. The eye is shown focusing the rays from the closer dot on the retina. For this case the rays from the more distant dot would not be in focus.
Takaki further showed a relation between the angular resolution of distinct rays intercepted by the pupil, and the depth range of the correct accommodative response of the eye [29]. One issue with the above approach is that the angular spread of rays is only along a horizontal direction and, therefore, may be considered to cause an astigmatism issue. One approach to alleviating this problem has been shown by Kim, who used slanted rays of light [30]. Figure 11.14 shows the idea where two rays enter the pupil along a slanted plane. The effect of having two or four rays enter the pupil is shown in Figure 11.15, where the focus is on one of three different objects.
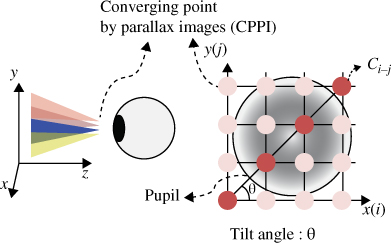
Figure 11.14 Intersection of rays of light from a common point with the pupil. Source: S-K Kim, S-H Kim, D-W Kim 2011. Reproduced with permission from SPIE.
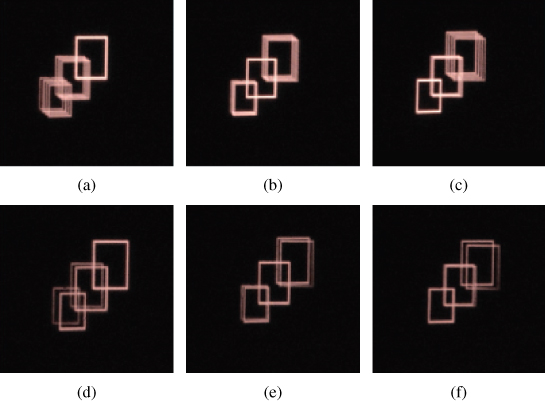
Figure 11.15 A comparison of the defocus effect in the case of using four rays from common points (top row), and with two rays from common points (bottom row), focusing on objects at: 0.25m (a) and (d); 0.6m (b) and (e); 1.8m (c) and (f). Source: S-K Kim, S-H Kim, D-W Kim 2011. Reproduced with permission from SPIE.
A more complete solution may come from the use of integral imaging, where rays are emitted along all angles. A recent review of this approach has been completed by Xiao [31]. Figure 11.16 shows a focusing effect in these type of systems.
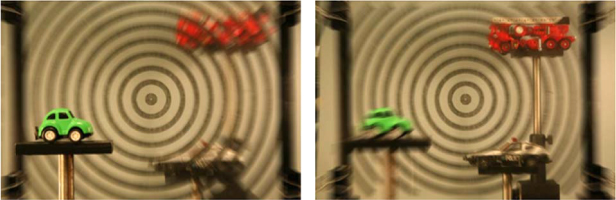
Figure 11.16 A computational reconstruction of the focusing effect for a type of integral imaging system. The picture at the left is where the closer car is in focus, and the picture on the right is where the further truck is in focus. Source: X. Xiao, B. Javidi, M. Martinex-Corral, A. Stern 2013. Reproduced with permission from the Optical Society of America.
We have seen that including the focus cue with the above approaches requires that multiple rays enter the pupil of each eye. This added information can cause the bandwidth of the display to become very high, as mentioned earlier.
Therefore, to limit the bandwidth requirement of the display, our window needs to be smart enough only to direct light to the eyes of the viewer, instead of sending out rays to all directions. An eye tracking system could be used to determine the location of viewers' eyes, and each pixel of the display then only needs to be able to provide light of the colors and intensities corresponding to the angle of the rays leaving the pixel and headed for each eye (as shown in Figure 11.13). For example, if three rays are needed to be directed toward each pupil for it to focus properly, then a six-view system could be sufficient.
An autostereoscopic system that uses head tracking to allow a high angular resolution of rays to be sent to the viewer, while maintaining a relatively high image resolution, has been shown by Nakamura et al. [32]. Another approach, where an array of lenses is placed on the display screen, has also been proposed [33]. Related to the idea of sending several light rays to each pupil is the idea of sending a non-planar wavefront to the pupil, as provided by a hologram. However, the bandwidth and technical problems associated with accomplishing this for a multiviewer display prevents high-resolution video rate devices that use this approach. A book chapter from Reichelt et al. makes clear these issues and demonstrates a solution that involves sending the holographic information only to areas in space where the viewers' eyes are located, as illustrated in Figure 11.17 [34].
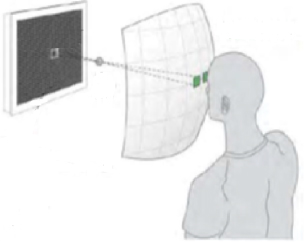
Figure 11.17 A method to decrease the information and diffraction angle requirements where holographic information is only directed toward the viewer's eyes. Source: S. Reichelt, R. Haussler, N. Leister, G. Futterer, H. Stolle, A. Schwerdtner 2010. Reproduced with permission of SeeReal Technologies.
While the above approaches are conceptually the most appealing, it is difficult to achieve both the desired image resolution and a sufficient number of rays to each eye to cause the focus cue. Another approach to the accommodation convergence problem is to consider an additional lens between the display and the viewer. Yanagisawa developed and analyzed a prototype system based on a display with an adjustable focus lens [35]. These concepts have been investigated in detail by Shibata [36].
These considerations lead towards solving the focus problem with a combination of the advantages of a volumetric display and a stereoscopic display. The advantage of the volumetric display is that it portrays focus naturally, but it has the disadvantage of not being able to handle occluded images well, and the bandwidth of the system is proportional to the number of depth planes. Love has proposed a system where a lens is placed in front of a flat panel stereoscopic display to provide field sequential focus planes of the displayed stereo images, as depicted in Figure 11.18 [37]. The field sequential approach requires the refresh rate to be multiplied by the number of focus depth planes. However, this is not as large a problem as for the case of a typical volumetric display, because the number of focus planes may be not be very large for an acceptable display. The number of depth planes where the eyes can converge is not limited as it is in a purely volumetric display.

Figure 11.18 A multi-focal length lens on the left with an overview of the eye, lens, and display screen on the right. The four focal positions on the left correspond to the four depth planes on the right [37]. Source: G. Love, D. Hoffman, P. Hands, J. Gao, A. Kirby, M. Banks 2009. Reproduced with permission from the Optical Society of America.
Another approach to address the accommodation problem is a “fix” suggested by Bos to use multi-focal length lenses (like bifocal or progressive lenses), worn by the user [38]. The multi-focal length lens is used to allow the user's eye to have a focal length consistent with the target location of the 3D object, while the focal length of the user's eyes, combined with the corrective lens, would allow the image to be in focus on the retina. A practical implementation of this approach would be to use eye-tracking to allow the display system to measure the toe-in of the user's pupils to determine the depth of the user's gaze and, coupled with knowledge of the distance of the user from the display screen, to adjust the power of an electronic lens worn by the user.
As described in the chapter by Drewes (Chapter 8), advances are being made in eye gaze tracking technologies that are ushering in low-cost eye-tracker systems, which could be utilized for this application. The advantage of this approach over the others considered here is that no additional bandwidth or compromise of the image resolution is required from the display system over a conventional stereoscopic display. To be more specific about this approach, we can consider a “passive glasses” stereoscopic system with head tracking described above. The idea of the system is shown in Figure 11.19 [39].
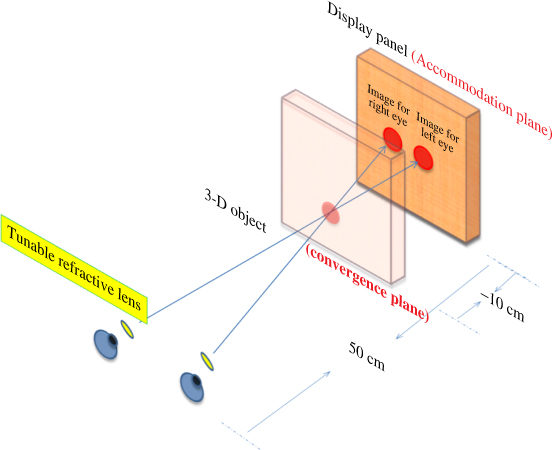
Figure 11.19 The use of tunable lenses near the eye to cause the eye to accommodate at the convergence plane, while the combination of the focusing power of the eye and the tunable lens causes the screen to be in focus on the retina. Source: P. J. Bos and A. K. Bhowmik 2010. Reproduced with permission from SID/Wiley.
If the corrective lenses are adjusted properly, we can have the focal power of the eyes to be consistent with focusing at the convergence plane, while at the same time have the image of the display panel to be in focus on the retina.
As mentioned above, detection of the “toe-in” of the viewer's pupils will allow the computer to know the convergence point of the eyes and, therefore, the distance to the object in the 3D scene being viewed. With the additional information of the distance of the viewer from the display screen, we can determine the power needed for the corrective lens. If we call the distances from the eye's lens to the panel “dp”, to the convergence point “dc”, and to the retina “dr”, then we would need the power of the eye's lens to be:
for it to be focused at the convergence plane. However, for the image to actually be focused on the retina, we need the power of the electronic lens “Pl” to be determined by:
This leads to:
which, in the case of th Figure 11.12, is –0.5 diopters. An electrically controllable lens, applicable to this type of system, has been presented [40].
Figure 11.20 shows a picture of the lens that is approximately 1 cm in diameter. The ability of this electrically controllable lens to shift the focus point of an object is illustrated in Figure 11.21, which shows that if we consider our eye to be accommodated to a 50 cm distance, the actual object can be between 40–60 cm from this lens. This demonstrates that if the display was at a fixed distance of 50 cm, the electronic lens could be used to cause the eye to refocus in the same way it would be required to if the display were between 40–60 cm.
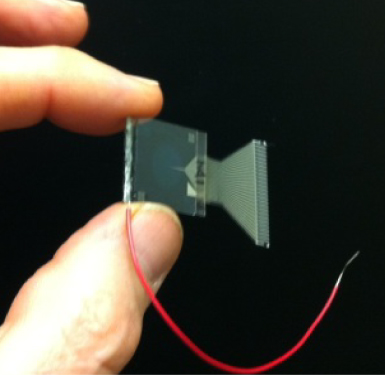
Figure 11.20 A tunable liquid crystal based lens similar to that used in Figure 11.19.
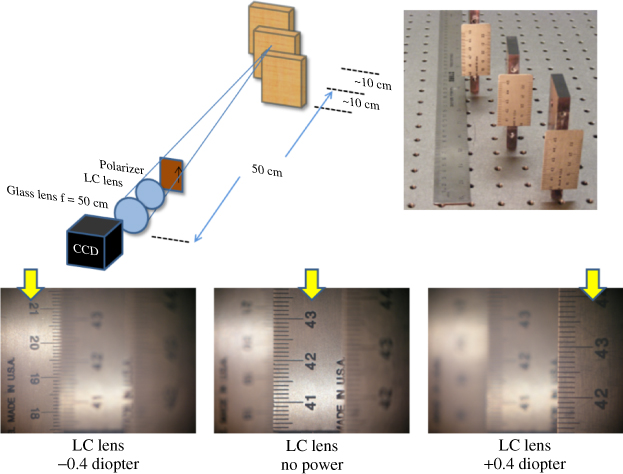
Figure 11.21 The lower three pictures are taken using the set up shown in the upper pictures, for three different sets of voltages applied to the tunable liquid crystal lens to provide the powers shown.
This type of simple system could be useful in achieving 3D stereoscopic display systems that reduce the discrepancy between accommodation and convergence and, as a result, to reduce eye fatigue. However, it should be realized that this corrector-based approach is a “fix”, as opposed to the more natural approaches of high resolution super-multi-view, integral imaging devices, holographic methods as presented by See-Real, or the volumetric display concept of Love. For example, one issue with this approach is that while the accommodation convergence ratio mismatch is addressed here, the method has the effect of unnaturally putting the entire display screen in focus at the depth of the particular aspect of the image being viewed. Artificially blurring images that are not at the depth of the object being viewed could alleviate this problem.
11.5 Interacting with Visual Content on a 3D Display
In the previous sections, we have discussed the fundamentals of 3D visual perception, 3D visual information capture, and the requirements of a “true” 3D display with an objective to deliver life-like visual experiences to the user. We then reviewed the progress in technologies towards achieving these goals. Here, we consider human inputs and interactions with the content displayed on such systems.
Historically, the development of 3D display systems focused on one primary application– presenting 3D photos and videos to the viewers to produce a depth perception. In recent years, displays have increasingly been adding touch sensing capabilities, especially on mobile communications and entertainment devices, thereby also becoming the primary human interaction interfaces. In addition, advances in real-time 3D imaging and computer vision techniques are starting to enable the implementation of user interactions in the 3D space in front of the display [41]. These developments promise to bring about a revolutionary change in human-computer interactions by making it possible to manipulate objects in the 3D environment directly and intuitively. Empirical studies have shown that when people are presented with 3D imagery in the 3D space in front of them, the natural tendency is to reach out and interact with them with their fingers [42]. This is not surprising, since we are used to doing so in the real world in our daily activities.
As we have discussed in previous sections in this chapter, a “true” 3D display must go beyond just presenting a stereo-pair of images for a scene being displayed (stereopsis cue). It must also provide seamlessly changing views corresponding to the movement of the head and the eyes of the viewer (motion parallax cue). In addition, the convergence of the eyes on the rendered object must be consistent with the focus of the lenses in the eyes (focus cue). While these are important requirements to produce a natural 3D viewing experience, they become even more critical for interactive applications where a user would reach out to manipulate a virtually rendered object in the 3D space with real body parts, such as the hands and the fingers.
Interacting with virtual objects in the 3D space with real body parts, e.g., “touching” with fingers or “grabbing” with hands, is limited to objects rendered with negative parallax so that they float in the space between the user and the display surface. Similar direct 3D interactions with the objects rendered with positive parallax, which float in the virtual space behind the plane of the display, are not possible, as the physical display surface would prevent reaching out through it. So, interactions with objects in these environments would require doing so with virtual body parts, such as hands rendered in the virtual environment and driven by the motions dynamically captured from the real hands of the users.
Let us consider the case of negative parallax, where an object is rendered between the user and the plane of the display. Although this allows physical interactions with the virtual objects rendered by providing the stereopsis cue, both motion parallax and focus cues become important because of the proximity of the user to the displayed content. As the user reaches out and grabs a rendered object floating in space, his or her visual system has to see both the virtual object and the real hand simultaneously. Absence of motion parallax cue in such cases, where the views of the displayed object on the retina remain fixed despite movements of the head and the eyes of the user, would cause confusion and discomfort, as the real hand obviously produces continuously varying images on the retina in coordination with the user's movements. Similarly, the absence of focus cue would create significant convergence-accommodation mismatches, so therefore either the object or the fingers will appear blurred, as both cannot be in focus at the same time. Since our perceptual system makes use of all these visual cues to understand the physical world and guide our interaction processes, the visual conflicts arising from the absence of these cues would impact our performance as we interface and interact with content displayed on a 3D display. A solution to the problem is to avoid bringing real and virtual objects in the view at the same time, and to use a virtually rendered equivalent of the hand for interactions with virtual objects.
The impact of these visual conflicts on the performance of the user, and the efficacy of the solution mentioned above, were evaluated with a Fitt's Law experiment by Bruder et al. [43]. Figure 11.22 illustrates the experiments and the key results from Bruder's work. Interestingly, as intuition would suggest, people were most efficient when using their real hands for interacting with the virtual objects rendered on a stereoscopic 3D display, but made more errors when compared to interacting with the same environments with virtual hands.
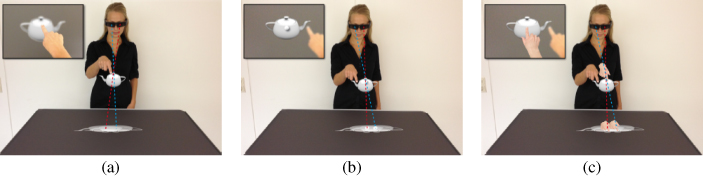
Figure 11.22 Illustration of visual conflicts during 3D selection of stereoscopically displayed objects:(a) The user is focused on her finger, with the virtual object appearing blurred. (b) Displaying a virtual offset cursor (white marker) at a fixed distance from the real fingertip reduces visual conflicts. (c) A virtual offset hand cursor provides familiar and additional size and distance cues for selection. Source: Bruder, Steinicke, Stuerzlinger 2013. Reproduced with permission from IEEE.
Using 3D visual displays for real-time interactive applications imposes additional requirements from the human factors perspective, besides the 3D visual cues described above. These include the need for fast response, such that there are no perceptible delays or lags between the human actions and the resulting system responses that lead to changes in the visual content.
The effects of inconsistencies between user actions and visual responses due to system lags have been studied and reported by La Viola [44]. Stuerzlinger et al. proposed limiting the degrees of freedom for user interactions within a virtual environment to reduce the failures and inconsistencies [45]. In addition, the fields of view for both the visual display and the real-time image capture device for human inputs are also a critical factor for ensuring good user experience. For example, it would be a frustrating experience for a user interacting with the content on a 3D display equipped with 3D gesture input capabilities, if the limited viewing angle of the 3D imaging device restricts user interactions to only a small active zone.
The user interface designs for interactive applications on systems and devices incorporating such 3D visual displays and 3D user input technologies would have to carefully consider and take into account human factors aspects of our interactions with the physical world, as well as the limitations with of the technologies and systems described above. For example, unlike a traditional 2D display with a touch-sensitive overlay, interacting with virtual objects in front of the display would provide no tactile feedback when touched. Therefore, the user interface designer needs to utilize other means of providing real-time feedback to the user, such as audio-visual cues that are appropriately designed in the context of the specific application and dependent on the extent of interactions. For example, squeezing a virtual ball would need to result in appropriate deformations of the ball, conveyed via changes in the shape and color that are consistent with the forces applied indicated by the motions of the fingers.
In addition, careful use of audio cues would also make the interaction “life-like”, such as squeaking of the deforming ball in response and proportional to the squeezing action. Similarly, carefully designed audio-visual cues can provide guidance to the user when the boundaries of the interaction zones are reached due to limited viewing angles.
In addition to 3D vision-based gestural interactions, multimodal user interfaces, including voice as an input as elaborated in the chapter by Breen et al. (Chapter 3) and eye gaze tracking technologies and interactions described in the chapter by Drewes (Chapter 8), can make the user interactions with content on a 3D display a more immersive and engaging experience. The considerations to make such interactions easy and intuitive for the user have been discussed in detail by LaViola et al. in the chapter on multimodal interfaces (Chapter 9).
11.6 Summary
While we use all our senses to perceive and interact with the physical world, vision plays the most important role. Visual displays have become an indispensable element of electronic devices of all form factors, ranging from the “small” displays on watches worn on the hand, to “medium” displays on smartphones, tablets, or laptop computers, to “large” displays on television sets or information kiosks. Visual displays have come a long way in recent years, with significantly improved visual qualities such as brightness, contrast, speed, and color performance. In addition, stereoscopic displays that can show visual content with stereopsis cues to the viewer have already entered the mainstream market. However, a “true” 3D display that would provide life-like immersive visual experience also needs to provide motion parallax and focus cues. In this chapter, we have considered the fundamentals of human vision and 3D visual perception to articulate the requirements of a “true” 3D display, and have reviewed the technologies required to realize such systems and their development status.
In recent years, displays have also been becoming highly interactive. Mobile displays have already become the primary human interface systems on mobile devices, by adding a touch-sensitive layer and associated user interface. As described in the chapter on touch technologies, touch-based user interfaces continue to be rapidly adopted in a wide range of devices and systems. The subsequent chapters presented the developments in voice and vision-based interfaces. The advances in speech recognition algorithms, 3D imaging and inference, and eye-gaze tracking technologies, are poised to bring about a revolutionary change to human interactions with the content on displays. These new human interface and interaction technologies, added to displays that will be capable of presenting “true” 3D visual content along with appropriately designed multimodal user interface schemes, promise to deliver life-like interaction experiences in the 3D space in front of the displays.
It is clear that the era of “interactive displays” is here. In the coming years and decades, we expect to see further proliferation of interactive displays into a broad range of devices and systems. This is a new area that requires further research and development, but it holds significant potential to bring about exciting new interactive applications and user experiences.
References
- 1. Watson, A.B., Ahumada, A.J., Farrell, J.E. (1986). Window of visibility: psychophysical theory of fidelity in time-sampled visual motion displays. J. Opt. Soc. Am 3, 300–307.
- 2. Adams, A. (1948). Camera and Lens: The Creative Approach. ISBN 0-8212-0716-4.Adams, A. (1950). The Print: Contact Printing and Enlarging. ISBN 0-8212-0718-0. http://en.wikipedia.org/wiki/O_Brother,_Where_Art_Thou%3F#cite_note-CGS-7.
- 3 Shibata, T., Kim, J., Hoffman, D.M., Banks, M.S. (2011). The zone of comfort: Predicting visual discomfort with stereo displays. J. Vis. 11(8), 11, 1–29.Banks, M.S., Akeley, K., Hoffman, D.M., Girshick, A.R. (2008). Consequences of incorrect focus cues in stereo displays. Information Display 7/8, 10–14.
- 4. Needham, J. (1986). Science and Civilization in China: Volume 4, Physics and Physical Technology, Part 1, Physics. Caves Books, Ltd, Taipei.Richter, J.P. (ed.) (1970). Aristotle, Problems, Book XV. The notebooks of Leonardo da Vinci. Dover, New York.
- 5. Land, M.F., Nilsson, D.-E. (2001). Animal Eyes. Oxford University Press. ISBN 0-19-850968-5.
- 6. Faraday, M. (1846). Thoughts on Ray Vibrations. Philosophical Magazine S.3, Vol XXVIII, N188.
- 7. Gershun, A. (1936). The Light Field. Moscow. Translated by Moon, P and Timoshenko G. in Journal of Mathematics and Physics 1939 XVIII, 51–151.
- 8. Adelson, E.H., Bergen, J.R. (1991). The plenoptic function and the elements of early vision, In Landy, M., Movshon, J.A. (eds.) Computation Models of Visual Processing, 3–20. MIT Press, Cambridge.
- 9. Gibson, J.J. (1966). The Senses Considered as Perceptual Systems. Houghton Mifflin, Boston. ISBN 0-313-23961-4.Gibson, J.J. (1977). The Theory of Affordances (pp. 67-82). In Shaw, R., Bransford, J. (Eds.). Perceiving, Acting, and Knowing: Toward an Ecological Psychology. Lawrence Erlbaum, Hillsdale, NJ.
- 10. Dawkins, R. (2006). The Selfish Gene: 30th Anniversary Edition. Oxford University Press. ISBN 0-19-929114-4.
- 11. Held, R.T., Cooper, E.A., Banks, M.S. (2012). Blur and Disparity Are Complementary Cues to Depth. Current Biology 22, 1–6.Held, R.T., Cooper, E.A., O'Brien, J.F., Banks, M.S. (2010). Using blur to affect perceived distance and size. ACM Transactions on Graphics 29, 1–16.
- 12. Lippmann, G. (1908). Epreuves reversible donnant la sensation du relief. J. de Physique 7, 821–825.Ives, H.E. (1930). Parallax panoramagrams made possible with a large diameter lens. JOSA 20, 332–342.
- 13. Adelson, T., Wang, J.Y.A. (1992). Single lens stereo with a plenoptic camera. IEEE Transactions on Pattern Analysis and Machine Intelligence 14(2), 99–106.
- 14. Ng, R., Levoy, M., Brédif, M., Duval, G., Horowitz, M., Hanrahan, P. (2005). Light Field Photography with a Hand-held Plenoptic Camera. Stanford Tech Report CTSR 2005-02.
- 15. www.lytro.com, www.raytrix.de
- 16. Xiao, X., Javidi, B., Martinez-Corral, M., Stern, A. (2013). Advances in three-dimensional integral imaging: sensing, display, and applications. Appl. Optics 52(4), 546–560.
- 17. van Nes, F.L., Bouman, M.A. (1967). Spatial Modulation Transfer in the Human Eye. JOSA 57(3), 401–406.
- 18. Hoffman, D.M., Darasev, V.I., Banks, M.S. (2011). Temporal presentation protocols in stereoscopic displays: Flicker visibility, perceived motion, and perceived depth. JSID 19(3), 255–281.
- 19. Dodgson, N. (2005). Autostereoscopic 3D displays. Computer 31(August).
- 20. Kim, J.H. (2010). Evolving Technologies for LCD Based 3-D Entertainment. Information Display 9, 8.
- 21. Bos, P.J. (1993). Stereo Computer Graphics and Other True 3D Technologies, Chapter 6. McAllister D. (Ed.). Princeton University Press.
- 22. Lee, J. (2007). Head Tracking for Desktop VR Displays using the Wii Remote. http://www.youtube.com/watch?v=Jd3-eiid-Uw
- 23. http://zspace.com/
- 24. http://www.superd3d.com/
- 25. Inoue, T., Ohzu, H. (1997). Accomodative responses to stereoscopic three-dimentional display. Applied Optics 36, 4509.
- 26. Shibata, T., Kim, J., Hoffman, D., Banks, M. (2011). The zone of comfort: Predicting visual discomfort with stereo displays. Journal of Vision 11, 1.
- 27. Kajiki, T., Yoshikawa, H., Honda, T. (1996). Ocular Accommodation by Super Multi-View stereogram and 45-view Stereoscopic Display. Proceedings for the third international display workshops (IDW'96), 2, 489.
- 28. Takaki, Y. (2002). Universal Stereoscopic Display using 64 LCDs. Proc. 2nd International Meeting of Information Display, 289, Daegu, Korea.
- 29. Takaki, Y., Kikuta, K. (2006). 3D Images with Enhanced DOF produced by 128-Directional Display. Proc. IDW '06, 1909.
- 30. Kim, S.-K., Kim, S.-H., Kim, D.-W. (2011). Full parallax multifocus three-dimensional display using a slanted light source array. Optical Engineering 50, 114001.
- 31. Xiao, X., Javidi, B., Martinex-Corral, M., Stern, A. (2013). Advances in three dimensional integral imaging: sensing, display, and applications. Applied Optics 52, 546.
- 32 Nakamura, J., Takahashi, T., Chen, C.-W., Huang, Y.-P., Takaki, Y. (2012). Analysis of longitudinal viewing freedom of reduced-view super multi-view display and increased longitudinal viewing freedom using eye-tracking technique. Journal of the SID 20, 228.
- 33. Hong, Q., Wu, T., Lu, R., Wu, S.-T. (2007). Reduced Aberration Tunable Focus Liquid Crystal Lenses for 3D displays. SID Symposium Digest 38, 496.
- 34. Reichelt, S., Haussler, R., Leister, N., Futterer, G., Stolle, H., Schwerdtner, A. (2010). Holographic 3D displays – Electro-holography with the Grasp of Commercialization. In Costa, N., Cartaxo, A. (eds). Advances in Lasers and Electro Optics, Chapter 29. INTECH.
- 35. Yanagisawa, N. et al. (1995). A focus distance controlled 3D television. The journal of three dimensional images 9, 14.
- 36. Shibata, T., Kawai, T., Ohta, K., Otsuki, M., Miyake, N., Yoshihara, Y., Iwasaki, T. (2005). Stereoscopic 3D display with optical correction for the reduction of the discrepancy between accommodation and convergence. JSID 13, 665.
- 37. Love, G., Hoffman, D., Hands, P., Gao, J., Kirby, A., Banks, M. (2009). High speed switchable lens enables the development of a volumetric stereoscopic display. Optics Express 17, 15716.
- 38. Bos, K. (1998). Reducing the accommodation and convergence difference in stereoscopic three-dimensional displays by using correction lenses. Optical Engineering 37, 1078.
- 39. Bos, P.J., Bhowmik, A.K. (2011). Liquid-Crystal Technology Advances toward Future True 3-D Flat-Panel Displays. Inf. Display 27, 6.
- 40. Li, L., Bryant, D., van Heugten, T., Duston, D., Bos, P. (2013). Near-diffraction limited tunable liquid crystal lens with simplified design. Optical Engineering 52, 035007-1.Li, L., Bryant, D., van Heugten, T., Bos, P. (2013). Physical limitations and fundamental factors affecting performance of liquid crystal tunable lenses with concentric electrode rings. Applied Optics 52, 1978.Li, L., Bryant, D., van Heugten, T., Bos, P. (2013). Near Diffraction limited and low haze electrooptical tunable liquid crystal lens with floating electrodes. Optics Express 21, 8371.
- 41. Bhowmik, A.K. (2013). Natural and Intuitive User Interfaces with Perceptual Computing Technologies. Inf. Display 29, 6.
- 42. Grossman, T., Wigdor, D., Balakrishnan, R. (2004). Multi-finger gestural interaction with 3D volumetric displays. Proceedings of the 17th annual ACM symposium on User interface software and technology, 61–70.
- 43. Bruder, G., Steinicke, F., Stuerzlinger, W. (2013). Effects of Visual Conflicts on 3D Selection Task Performance in Stereoscopic Display Environments. Proceedings of IEEE Symposium on 3D User Interfaces (3DUI). IEEE Press.
- 44. La Viola, J. (2000). A discussion of cybersickness in virtual environments. SIGCHI Bulletin 32, 47–56.
- 45. Stuerzlinger, W., Wingrave, C.A. (2011). The Value of Constraints for 3D User Interfaces. In Brunnett, G., Coquillart, S., Welch, G. (eds). Virtual Realities, 203–223.