
Chapter 20
Debugging Your Programs, Part 3
In This Chapter
![]() Debugging using the built-in debugger
Debugging using the built-in debugger
![]() Building your application with debugger information
Building your application with debugger information
![]() Setting a breakpoint
Setting a breakpoint
![]() Single-stepping your program
Single-stepping your program
![]() Fixing a sample problem
Fixing a sample problem
I introduce a few techniques for finding errors at the end of Parts II (Chapter 8) and III (Chapter 13). Here, near the end of Part IV, I want to touch on debugging techniques one final time.
In this chapter, I introduce you to the debugging tools built into the Code::Blocks development environment (similar tools exist for most other environments). Learning to use the debugger will give you clear insight into what your program is doing (and what it’s not doing, at times).
A New Approach to Debugging
Chapters 8 and 13 demonstrated how to find problems by adding output statements in key positions. Outputting key variables lets you see what intermediate values your program is calculating and what path it’s taking through your C++ code.
However, the output technique has several distinct disadvantages. The first is the difficulty of knowing what to display. In a small program, such as most of the programs in this book, you can display almost everything — there just aren’t that many variables to slog through. A major-league program, however, may contain many hundreds of variables, especially if you include all of the elements in the arrays. Knowing which variables to display can be problematic.
A second problem is the time it takes to rebuild the program. Once again, this isn’t a problem with small programs. Code::Blocks can rebuild a small program in just a few seconds. In these cases, adding or changing output statements doesn’t take more than a few minutes. However, I have been on projects where rebuilding the entire program took many hours. In a big program, adding new output statements as you zero in on a bug can take a long time.
Finally, it’s very difficult to debug a pointer problem by using the output approach. If a pointer is invalid, any attempt to use it will cause the program to abort, and discerning a valid pointer from an invalid one simply by displaying its value on cout is almost impossible.
The solution
What you need is a way to stop the program in the middle of its execution and query the value of key variables. That’s exactly what the debugger does.
The debugger is actually a utility built into the Code::Blocks environment. Every environment has some type of debugger; all offer the same basic features, though the specific commands may be different. The debugger allows the programmer to control the execution of her program. She can execute one step in the program at a time, she can stop the program at any point, and she can examine the value of variables.
 Unlike the C++ language, which is standardized, every debugger has its own command set. Fortunately, once you’ve learned how to use the Code::Blocks debugger, you won’t have any trouble learning to use the debugger that comes with your favorite C++ environment.
 As of this writing, Code::Blocks did not work with the gnu debugger on the Machintosh.
The programmer controls the debugger through commands entered from the keyboard within the Code::Blocks environment exactly as she would use the edit commands to modify the C++ source code or build commands to create the executable program. The debug commands are available from both menu items and hot keys.
The best way to learn how to use the Code::Blocks debugger is to use it to find a couple of nasty problems in a buggy version of one of the programs you’ve already seen.
Entomology for Dummies
The following version of the Concatenate program (which you’ll find in the online material as ConcatenateError1) represents my first attempt at the ConcatenatePtr program from Chapter 18.
This version has at least two serious bugs, both of which are in the concatenateString() function.
//
// ConcatenateError1 - similar to ConcatenatePtr except
// this version has several bugs in it
// that can be easily found with the
// debugger
//
#include <cstdio>
#include <cstdlib>
#include <iostream>
#include <cstring>
using namespace std;
// concatenateString - concatenate two strings together
// into an array allocated off of the
// heap
char* concatenateString(const char* pszSrc1,
const char* pszSrc2)
{
// allocate an array of sufficient length
int nTargetSize = strlen(pszSrc1)+strlen(pszSrc2)+1;
char* pszTarget = new char[nTargetSize];
// first copy the first string into the target
while(*pszSrc1 != '�')
{
*pszTarget++ = *pszSrc1++;
}
// now copy the contents of the second string onto
// the end of the first
while(*pszSrc2 != '�')
{
*pszTarget++ = *pszSrc2++;
}
// return the resulting string to the caller
return pszTarget;
}
int main(int nNumberofArgs, char* pszArgs[])
{
// Prompt user
cout << "This program accepts two strings
"
<< "from the keyboard and outputs them
"
<< "concatenated together.
" << endl;
// input two strings
cout << "Enter first string: ";
char szString1[256];
cin.getline(szString1, 256);
cout << "Enter the second string: ";
char szString2[256];
cin.getline(szString2, 256);
// now concatenate one onto the end of the other
cout << "Concatenate first string onto the second"
<< endl;
char* pszT = concatenateString(szString1, szString2);
// and display the result
cout << "Result: <"
<< pszT
<< ">" << endl;
// return the memory to the heap
delete pszT;
pszT = nullptr;
// wait until user is ready before terminating program
// to allow the user to see the program results
cout << "Press Enter to continue..." << endl;
cin.ignore(10, '
'),
cin.get();
return 0;
}
The following shows the results of executing the program (you may see a different Result for reasons that will quickly become clear):
This program accepts two strings
from the keyboard and outputs them
concatenated together.
Enter first string: this is a string
Enter the second string: THIS IS ALSO A STRING
Concatenate first string onto the second
Result: <OF_ƒdT☻ΓD>
Press Enter to continue …
Clearly, the result is not correct, so something must be wrong. Rather than start inserting output statements, I will use the debugger to find the problems this time.
I suggest that you follow along with me and take the same steps I do in the following section. You can start with the ConcatenateError1 program from the online material.
Starting the debugger
I can tell the debugger that I want to execute the program up to a certain line or view a particular variable. In order for me to do that, however, the debugger has to know exactly where each C++ line of code is stored and where each variable is kept. It does this by attaching extra information onto the executable — actually, quite a bit of extra information. Because this information can get really lengthy — and because I don’t need it for the release version that I ship to the public — including debug information is optional.
I decided whether to include debug information in the executable when I created the project. Figure 20-1 shows the next-to-last dialog box presented by the Project Wizard, the Console Application dialog box. The default is to generate debug information as shown here. The Release configuration is the version of the executable without the extra debug information. I cannot use the debugger if I do not create a Debug configuration version.
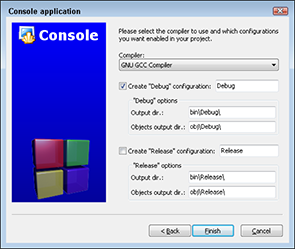
Figure 20-1: The Console Application dialog box of the Project Wizard allows you to select whether to build a debug version of the executable.
I can turn debugger information on at any time by selecting Settings⇒Compiler and Debugger and then making sure that the Produce Debugging Symbols [-g] check box is checked in the Compiler Flags subwindow of the Compiler Settings window. I have to rebuild the executable by selecting Build⇒Rebuild for the change to have any effect.
So assume that I did tell Code::Blocks to include debug information in the executable.
I’m reasonably certain that the problem is in the concatenateString() function itself. So I decide that I want to stop executing the program at the call to concatenateString(). To do this, I need to do what’s called setting a breakpoint.
A breakpoint is a command to the debugger that says, “Stop execution of the program if you get to this spot.” There are at least four ways to set a breakpoint, all of which are equivalent:
- Click with the cursor just to the right of the line number on line 60 (see Figure 20-2).
- Right-click on line 60 and select Toggle Breakpoint from the menu that appears (it’s the first option).
- Put the cursor on line 60 and select F5 (Toggle Breakpoint).
- Put the cursor on line 60 and select Debug⇒Toggle Breakpoint.
Multiple methods exist for entering almost every other debugger command that I describe in this chapter, but in the interest of brevity, I describe only one. You can experiment to find the others.
A small stop sign appears just to the right of the line number, as shown in Figure 20-2.
To start the program, I select Debug⇒Start. At first, the program seems to execute like normal. It first prompts me for the first string. It follows that by prompting me for a second string. As soon as I enter that string, however, the program appears to stop, and a small, yellow arrow appears inside the stop sign on the source code display. This is shown in Figure 20-3. This little, yellow arrow is the current location indicator. This points to the next C++ line to be executed.
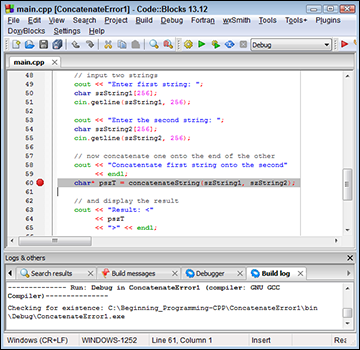
Figure 20-2: A small, red stop sign indicates that a breakpoint has been set at the specified location.
You will also notice from Figure 20-3 that another toolbar appears. The Debugger toolbar includes the most common debug commands, including most of the commands that I demonstrate in this chapter. (I’ve added callouts for the commands I describe later in this chapter.) Navigating through a program with the debugger
Okay, so I’ve managed to stop the execution of my program in the middle with the debugger. What can I do now?
I’ll start by executing the concatenateString() function one statement at a time. I could set a new breakpoint at the first instruction in the function, but setting a new breakpoint on every line is tedious. Fortunately, the Code::Blocks debugger offers a more convenient choice: the Step Into command.
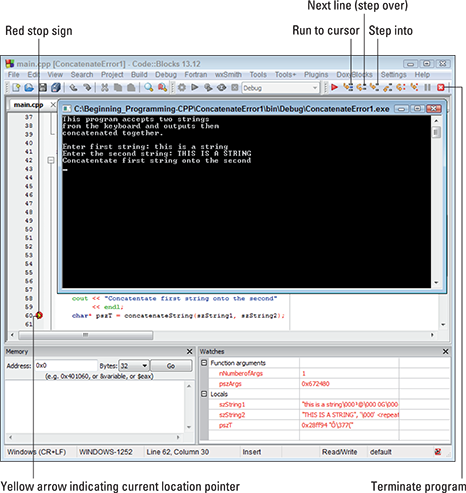
Figure 20-3: The program stops executing, and a small, yellow arrow appears at the next line to be executed when the program encounters a breakpoint.
On the Debug toolbar, this is the fifth command from the left. However, if you get confused, this menu has Tool Tips — just point at the command in the toolbar and leave the arrow motionless. After a few seconds, the name of the command will pop up. Or you can select Debug⇒Step Into from the main menu.
The Step Into command executes a single C++ statement; in this case, the command steps into the function call. Execution stops immediately before the first executable statement in concatenateString(). Next, I select Debug⇒Debugging Windows⇒Watches to display the window shown in Figure 20-4. From this window, I can see that the two arguments to the function, pszSrc1 and pszSrc2, appear to be correct.
 The values of nTargetSize and pszTarget have no meaning at this point since they have yet to be initialized.
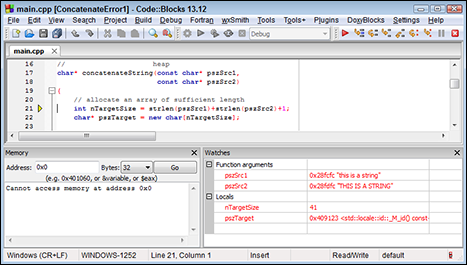
Figure 20-4: The Watches window shows both the arguments to the functions and any locally defined variables.
I could select Step Into again to move forward, but doing so would step me into the strlen() functions.
The other option is known as Next Line. Next Line steps to the next line of C++ code in the current function, treating function calls just like any other C++ command.
Together, Step Into and Next Line are known as single-step commands. For commands other than function calls, the two commands are equivalent. Many debuggers use the term Step Over rather than Next Line to highlight the distinction from Step Into.
I select Next Line from the Debug toolbar. Notice how the Current location pointer moves from line 21 to line 22, as shown in Figure 20-5. In addition, the nTargetSize variable is highlighted red in the Watch window to indicate that its value has changed. The value of nTargetSize is now 33, the correct length of the sum of the two strings.
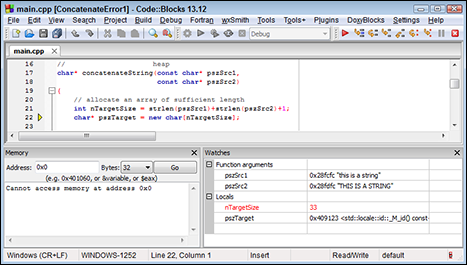
Figure 20-5: Selecting Next Line moves the current location pointer to line 22 and initializes nTargetSize.
You need to be absolutely clear about what just happened. All you see is that the screen blinks and the current location pointer moves down one line. What actually happened is that the debugger set a temporary breakpoint at line 22 and then restarted the program at line 21. The program executed the two calls to strlen() and then performed the addition, storing the results in nTargetSize. You may have seen only the one line of code get executed, but in fact many lines of C++ code were executed within the strlen() functions (executed twice, actually).
So far, so good, so I select Next Line a few more times until I enter the while loop.
This while loop is structured a little differently from what you’ve seen before. Here I increment the pointer as part of the assignment itself, rather than in the increment clause of a for loop, as follows:
while(*pszSrc1 != '�')
{
*pszTarget++ = *pszSrc1++; // Line 27
}
Line 27 of the program says, “Store the value of the char pointed at by pszSrc1 into the char location pointed at by pszTarget and then increment pszSrc1 and pszTarget.”
Figure 20-6 shows the debug display after I execute the loop a few times. Notice after each execution that, since their value is modified, both pszSrc1 and pszTarget are highlighted in the Watches window.
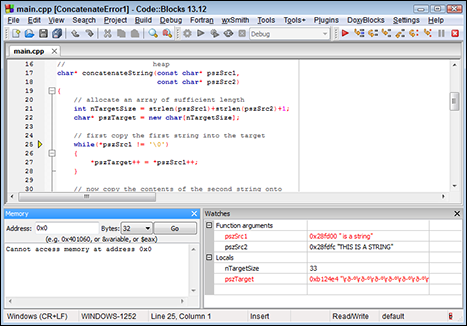
Figure 20-6: The while loop increments pszSrc1 and pszTarget on each pass.
Also notice that the string pointed at by pszSrc1 seems to be shrinking. This is because as pszSrc1 is incremented, it is effectively moving down the string until eventually it will point to nothing more than the terminating null. That’s when control will leave the while loop and continue on to the next loop.
But wait! The string pointed at by pszTarget is not growing. Remember that the intent is to copy the contents of pszSrc1 into pszTarget. What’s happening?
After a moment’s reflection, the answer is obvious: I’m also changing the value of pszTarget and leaving behind the characters I’ve copied. That’s what was wrong with my function in the first place. I need to keep a copy of the original pointer unmodified to return to the caller!
Now that I know the problem (or, at least, a problem — there may be more), I stop the debugger by clicking Stop Debugger on the Debug toolbar. The Console Application dialog box disappears immediately, and the Code::Blocks display returns to that used for editing.
Fixing the (first) bug
To solve the problem that I noted, I only need to save the value returned by new and return it rather than the modified pszTarget pointer from the function. I include only the modified concatenateString() function here (the rest of the program is unchanged — the entire program is included in the online material as ConcatenateError2):
char* concatenateString(const char* pszSrc1,
const char* pszSrc2)
{
// allocate an array of sufficient length
int nTargetSize = strlen(pszSrc1)+strlen(pszSrc2)+1;
char* pszTarget = new char[nTargetSize];
char* pszT = pszTarget; // save a pointer to return
// first copy the first string into the target
while(*pszSrc1 != '�')
{
*pszTarget++ = *pszSrc1++;
}
// now copy the contents of the second string onto
// the end of the first
while(*pszSrc2 != '�')
{
*pszTarget++ = *pszSrc2++;
}
// return the original pointer to the caller
return pszT;
}
Here I save the pointer returned by new into both pszTarget, which I intend to increment, and pszT, which will stay unmodified. The function returns the latter, unmodified pointer to the caller.
I rebuild the application, and then I repeat my earlier steps to single-step through the first loop within concatenateString(). Figure 20-7 shows the display after executing the loop seven times.
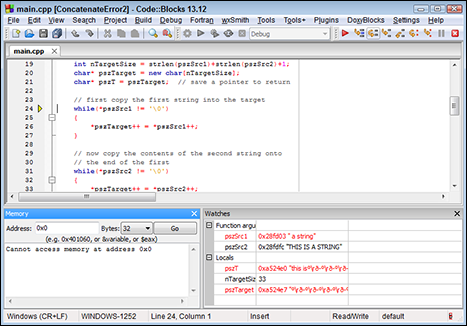
Figure 20-7: The Watches window of the updated concatenateString() function shows the string being built in the array pointed at by pszT.
Notice how pszT points to an array containing the first seven characters of the source string this is. Also notice that the value of pszTarget is 7 larger than pszT.
But also notice all the garbage characters in the pszT string that appear after this is. Code::Blocks displays extra garbage because the target string has no terminating null. It doesn’t need one yet, because I haven’t completed constructing it.
Finding and fixing the second bug
The two source strings aren’t all that long, so I use the Next Line command to single-step through the entire loop. Figure 20-8 shows the Debug window after executing the second loop for the last time. Here, pszT points to the completed target string with both source strings concatenated together. Without a terminating null, however, the string still displays garbage after the final character.
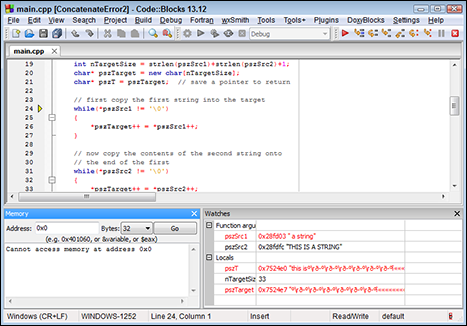
Figure 20-8: The Debug window after executing the second loop for the last time.
Because I’m now done with the function, I select Debug⇒Continue from the Code::Blocks menu. This causes the debugger to resume the program where it left off — and to continue to the next breakpoint or to the end of the program, whichever comes first.
Sure enough, the displayed concatenated array includes the same garbage that I saw in the debugger:
This program accepts two strings
from the keyboard and outputs them
concatenated together.
Enter first string: this is a string
Enter the second string: THIS IS A STRING
Concatenate first string onto the second
Result: <this is a stringTHIS IS A STRINGε½½½½½½½½■ε■ε■ε■>
Press Enter to continue …
 If I didn’t include a terminating null, then what caused the string returned by concatenateString() to terminate at all? Why didn’t the string continue on for pages? The short answer is, “Nothing.” It could be that C++ had to display many thousands of characters before eventually hitting a character containing a null. In practice, this rarely happens, however. Zero is by far the most common value in memory. You generally don’t have to look too far before you find a byte containing a zero that terminates the string.
All I need to do to fix this problem is add a terminating null after the final while loop:
char* concatenateString(const char* pszSrc1,
const char* pszSrc2)
{
// allocate an array of sufficient length
int nTargetSize = strlen(pszSrc1)+strlen(pszSrc2)+1;
char* pszTarget = new char[nTargetSize];
char* pszT = pszTarget; // save a pointer to return
// first copy the first string into the target
while(*pszSrc1 != '�')
{
*pszTarget++ = *pszSrc1++;
}
// now copy the contents of the second string onto
// the end of the first
while(*pszSrc2 != '�')
{
*pszTarget++ = *pszSrc2++;
}
// add a terminating NULL
*pszTarget = '�';
// return the unmodified pointer to the caller
return pszT;
}
Executing this version in the debugger creates the display shown in Figure 20-9. Notice that after the terminating null is added, the string pointed at by pszT magically “cleans up,” losing all the garbage that strings on after the data that I put there.
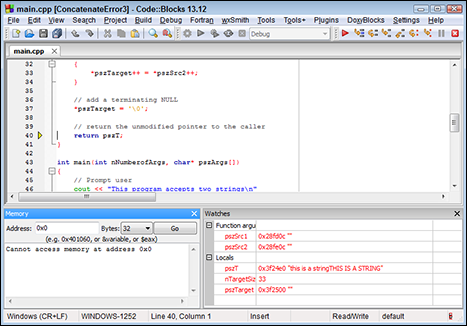
Figure 20-9: Adding the terminating null removes all of the garbage characters at the end of the concatenated string.
Let me be clear: Those garbage characters are still there. It’s just that the terminating null tells C++ not to display them.
The output from the program is the predictable string that you’ve come to love and admire:
This program accepts two strings
from the keyboard and outputs them
concatenated together.
Enter first string: this is a string
Enter the second string: THIS IS A STRING
Concatenate first string onto the second
Result: <this is a stringTHIS IS A STRING>
Press Enter to continue …
It’s possible to find problems in small programs by adding output statements at key locations. However, the debugger is a much more elegant and powerful tool for finding problems. Single-stepping your way through a program in the debugger gives you a real feel for what the computer is doing with your source code. You develop an understanding for how the computer works that I don’t think you can get any other way. The debugger that comes with Code::Blocks is about as easy to use as any that I’ve seen. I recommend that you use it early and often.